INTRODUCTION
Giardiasis is quite common among people (Plutzer et al. Reference Plutzer, Ongerth and Karanis2010), domestic and farm animals (Ballweber et al. Reference Ballweber, Xiao, Bowman, Kahn and Cama2010; Geurden et al. Reference Geurden, Vercruysse and Claerebout2010) and despite intense research, the disease mechanisms, host response and factors determining the variability in clinical outcome are still poorly understood. Specific virulence factors linked to Giardia pathogenicity have not been identified yet (Roxstrom-Lindquist et al. Reference Roxstrom-Lindquist, Palm, Reiner, Ringqvist and Svard2006). The clinical manifestations of giardiasis may vary from asymptomatic carrier-state to long-lasting diarrhoea and malabsorption (Robertson et al. Reference Robertson, Hanevik, Escobedo, Morch and Langeland2010). Studies on epithelial cell lines (Chavez et al. Reference Chavez, Gonzalez-Mariscal, Cedillo-Rivera and Martinez-Palomo1995), laboratory animals (Belosevic et al. Reference Belosevic, Faubert and MacLean1989; Cevallos et al. Reference Cevallos, Carnaby, James and Farthing1995), man (Oberhuber et al. Reference Oberhuber, Kastner and Stolte1997; Hanevik et al. Reference Hanevik, Hausken, Morken, Strand, Morch, Coll, Helgeland and Langeland2007) and livestock (Ruest et al. Reference Ruest, Couture, Faubert and Girard1997; Koudela and Vitovec, Reference Koudela and Vitovec1998) demonstrated a variable degree of damage to the small intestinal surface, ranging from no abnormalities to microvillus brush-border injury, villus atrophy and crypt hyperplasia, which explain the typical symptoms of malabsorption and maldigestion (Buret et al. Reference Buret, Gall and Olson1991, Reference Buret, Hardin, Olson and Gall1992).
Currently, isolates of G. duodenalis are assigned to 7 genotypes: assemblages A and B infect humans and a broad range of animals, while assemblages C, D, E, F and G are restricted to domestic animals, livestock and wild animals (Read et al. Reference Read, Monis and Thompson2004; Caccio and Ryan, Reference Caccio and Ryan2008). This host restriction may suggest that assemblages C to G are phenotypically distinct from assemblages A and B, although a clear correlation between genetic and biological markers has not yet been established (Roxstrom-Lindquist et al. Reference Roxstrom-Lindquist, Palm, Reiner, Ringqvist and Svard2006). T-cell stimulating antigens (Astiazaran-Garcia et al. Reference Astiazaran-Garcia, Quintero, Vega, Briceno, Oviedo, Rascon, Garibay-Escobar, Castillo-Yanez, Robles-Zepeda, Hernandez and Velazquez2009), variant-specific surface proteins (VSP) (Franzen et al. Reference Franzen, Jerlstrom-Hultqvist, Castro, Sherwood, Ankarklev, Reiner, Palm, Andersson, Andersson and Svard2009; Jerlstrom-Hultqvist et al. Reference Jerlstrom-Hultqvist, Franzen, Ankarklev, Xu, Nohynkova, Andersson, Svard and Andersson2010) and other surface antigens (Aggarwal and Nash, Reference Aggarwal and Nash1987; Franzen et al. Reference Franzen, Jerlstrom-Hultqvist, Castro, Sherwood, Ankarklev, Reiner, Palm, Andersson, Andersson and Svard2009) are variably expressed on the WB (assemblage AI), GS (assemblage B) and P15 (assemblage EIII) strains. Hence, it is of interest to study how these differences may relate to biological properties, such as infectivity and pathogenicity. Some authors report a connection between assemblage A with symptomatic infections and assemblage B with asymptomatic cases in man (Haque et al. Reference Haque, Roy, Kabir, Stroup, Mondal and Houpt2005; Sahagun et al. Reference Sahagun, Clavel, Goni, Seral, Llorente, Castillo, Capilla, Arias and Gomez-Lus2008), while others found the opposite (Geurden et al. Reference Geurden, Levecke, Caccio, Visser, De, Casaert, Vercruysse and Claerebout2009; Singh et al. Reference Singh, Janaki, Petri and Houpt2009) or no relation at all (Kohli et al. Reference Kohli, Bushen, Pinkerton, Houpt, Newman, Sears, Lima and Guerrant2008; Ajjampur et al. Reference Ajjampur, Sankaran, Kannan, Sathyakumar, Sarkar, Gladstone and Kang2009).
Variation in infectivity, pathogenicity and immune response has been demonstrated extensively in laboratory animal models (Aggarwal and Nash, Reference Aggarwal and Nash1987; Majewska and Gustowska, Reference Majewska and Gustowska1996; Williamson et al. Reference Williamson, O'Donoghue, Upcroft and Upcroft2000), even within isolates of the same host species (Visvesvara et al. Reference Visvesvara, Dickerson and Healy1988; Cevallos et al. Reference Cevallos, Carnaby, James and Farthing1995) and among clones of the same isolate (Udezulu et al. Reference Udezulu, Visvesvara, Moss and Leitch1992). Differences in virulence have been defined in terms of infectivity rates (Visvesvara et al. Reference Visvesvara, Dickerson and Healy1988), minimal infective dose (Visvesvara et al. Reference Visvesvara, Dickerson and Healy1988), maximal parasite load (Udezulu et al. Reference Udezulu, Visvesvara, Moss and Leitch1992; Williamson et al. Reference Williamson, O'Donoghue, Upcroft and Upcroft2000) or small intestinal injury (Cevallos et al. Reference Cevallos, Carnaby, James and Farthing1995; Majewska and Gustowska, Reference Majewska and Gustowska1996). However, the pathogenic significance of the various genotypes has yet to be established since information about the infecting genotype is mostly not available. In addition, available literature on pathology involves G. muris infections in mice (Buret et al. Reference Buret, Gall and Olson1990) or is based on a small number of G. duodenalis isolates (Buret et al. Reference Buret, Gall and Olson1991; Cevallos et al. Reference Cevallos, Carnaby, James and Farthing1995), trophozoites of a reference strain with a long history of laboratory culturing (Aggarwal and Nash, Reference Aggarwal and Nash1987; Belosevic et al. Reference Belosevic, Faubert and MacLean1989) or heterogeneous Giardia populations (trophozoites or pooled cyst samples) without prior cloning (Visvesvara et al. Reference Visvesvara, Dickerson and Healy1988; Majewska and Gustowska, Reference Majewska and Gustowska1996). Furthermore, diverse endpoints are used, resulting in a great variability and difficult interpretation of published data.
Taking advantage of the fact that in vitro trophozoite culture and gerbil infections have recently been established for assemblages A, B and E strains (Benere et al. Reference Benere, Geurden, Robertson, Van Assche, Cos and Maes2010) enabled us to investigate the possible correlation between the assemblage subtype and in vivo phenotype for intestinal growth and overall virulence in the gerbil model.
MATERIALS AND METHODS
Parasite cultures
Eight strains of G. duodenalis were selected according to genotype (assemblages A, B and E), host species (human [h] or cattle [c]), history (lab or field strain) and geographical origin (Belgium, Alaska, Afghanistan or Norway). Laboratory strains were defined as isolates that have been maintained in culture for more than 20 years and included the WB (ATCC 30957; assemblage AI; originated from Afghanistan (Smith et al. Reference Smith, Gillin, Spira and Nash1982)) and GS/M-83-H7 (ATCC 50581; assemblage B; originated from USA (Nash et al. Reference Nash, McCutchan, Keister, Dame, Conrad and Gillin1985; Nash and Keister, Reference Nash and Keister1985)) strains (Baruch et al. Reference Baruch, Isaac-Renton and Adam1996), kindly provided by Professor Dr R. Brun of the Swiss Tropical and Public Health Institute (Basel, Switzerland) and Professor Dr N. Mueller of the Institute of Parasitology (Berne, Switzerland). All field isolates, 3 of assemblage AI (Ah2; Ac1; Ac2), 1 of assemblage AII (Ah1) and 2 of assemblage EIII (Ec1, Ec2), were recently established in our laboratory as cloned in vitro trophozoite cultures and characterized by sequence analysis of the glutamate dehydrogenase (gdh), β-giardin (bg), triosephosphate isomerase (tpi) gene (Benere et al. Reference Benere, Geurden, Robertson, Van Assche, Cos and Maes2010). The cattle isolates of assemblage AI and EIII were derived from cysts collected from different animals at 1 (Ec1 and Ec2) or 2 (Ac1 and Ac2) farms in Belgium. The human isolates Ah2 (assemblage AI) and Ah1 (assemblage AII) were isolated from different symptomatic patients in Norway (Benere et al. Reference Benere, Geurden, Robertson, Van Assche, Cos and Maes2010). Before use in experiments, field isolate cryostabilates were thawed and the number of passages was kept to a minimum (<15). Assemblage A and E trophozoites were routinely maintained in TYI-S-33 medium at pH 6·8, supplemented with 10% heat-inactivated bovine serum and 1 μl/ml fresh bovine bile (Benere et al. Reference Benere, da Luz, Vermeersch, Cos and Maes2007). Assemblage B trophozoites were grown in TYI-S-33 medium supplemented with 0·5 g/l powdered bovine bile and 10% heat-inactivated fresh human serum (Benere et al. Reference Benere, Geurden, Robertson, Van Assche, Cos and Maes2010). Detachment of trophozoites for preparation of inocula was achieved by chilling the cultures on ice for 20 min. The number of trophozoites was determined using 0·4% trypan blue (w/v) (Sigma, Bornem, Belgium) and 0·04% formol in a KOVA Glasstic® counting slide (Bayer, Brussels, Belgium).
Animal model
Four to five week-old male SPF gerbils (34·7 g±0·6) were purchased from Janvier (St Isle, France). After acclimatization for 1 week, they were randomly allocated to experimental groups of 4 animals each. Before experimental infection, previous contacts with Giardia were excluded by microscopic examination of faeces collected over 3 consecutive days. The experimental infections were established using fresh trophozoites from axenic in vitro cultures. The gerbils were fasted overnight before oral inoculation with 106 trophozoites in 500 μl of phosphate-buffered saline (PBS). All animal experiments were approved by the ethical committee of the University of Antwerp.
Experimental design
The growth dynamics of the G. duodenalis isolates were determined by monitoring the number of trophozoites in the small intestine on days 4, 7, 11, 14, 18, 21, 25 and 29 post-infection (p.i.). Clinical signs of diarrhoea and evolution of body weight were also monitored. Faecal consistency was scored using an ordinal scale with 0=normal, 1=slight softening, and 2=severe softening. Faecal cyst excretion was not monitored. On each time-point, 4 gerbils were euthanized with 100% CO2 for collection of the entire small intestine and enumeration of the number of trophozoites. Briefly, the intestine was opened longitudinally and suspended in PBS on ice for 35 min to detach trophozoites. After removal of the intestine, the test tube was centrifuged at 800 g for 10 min at 4°C, to separate the trophozoites, which were then counted using a KOVA Glasstic® chamber. If no trophozoites were observed, the entire suspension was transferred to a 6-well plate and further examined using an inverted microscope, achieving a limit of detection of about 104 trophozoites/gerbil. To represent the growth dynamics of each strain as a single value, the area under the infection curve from day 0 to day 18 (AUC) was calculated using GraphPad Prism software (San Diego, California, USA).
Sample collection
Duodenal and jejunal segments were collected for histopathological analysis from animals sacrificed on days 7 and 18 p.i. Beginning at the gastro-duodenal junction, the first 5 mm was discarded, the next 5 mm was collected for histopathological examination and the next 15 mm for the evaluation of brush-border enzyme activities. Similar tissue samples from the middle jejunum section were taken. The samples for evaluation of enzyme activities were immediately frozen in liquid nitrogen and stored at −80°C until further processing.
Histology
The small intestinal segments were fixed for 2 h in 4% paraformaldehyde (0·1 m, pH 7·4) at room temperature and rinsed 4 times in PBS (0·01 m, pH 7·4) for 10 min. Tissues were dehydrated through a graded series of ethanol and at random embedded in paraffin wax. Sections (4 μm) were made, rehydrated, mounted and stained with haematoxylin – eosin for routine histology or toluidine blue for the visualization of mast cells. Villus height (μm) and crypt depth (μm) were measured in 30 perpendicular oriented villus-crypt units, divided over a minimum of 10 high-power fields (HPF). The epithelial cell height (μm) of 3 scattered enterocytes was determined in each villus. All measurements were performed by the same person at ×100 using morphometric analysis software (Axiovision 4.8, Zeiss, Germany). Inflammation was assessed using a semi-quantitative estimation of the amount of inflammatory cells present in the lamina propria of 5 randomly chosen HPF's: Score 0=comparable to uninfected control (UC), Score 1=a slightly increased number of inflammatory cells in the villi; Score 2=moderate increased number of inflammatory cells in both villi and crypt; Score 3=severe inflammation with higher numbers of inflammatory cells compared to score 2. For each strain, data are presented as the weighted means of the scores obtained for each individual gerbil. For all assemblage subtypes, samples collected at the time-point (day 18) and small intestinal localization (duodenum) with the highest intestinal inflammation was stained with toluidine blue to specifically evaluate the infiltration of mast cells in the lamina propria.
Brush-border enzyme activity
The intestinal segments collected on day 7 p.i. were homogenized in ice-cold distilled water using a tissue grinder, frozen in liquid nitrogen and kept at −80°C until analysis. The activities of sucrase, maltase and lactase were determined by measuring the D-glucose liberated from the respective substrates using the glucose oxidase-peroxidase system (Dahlqvist, Reference DAHLQVIST1964). Alkaline phosphatase was measured by the rate of splitting the paranitrophenylphosphate substrate into the yellow paranitrophenol (Millington and Tovell, Reference Millington and Tovell1969). Enzyme-specific activities (SA) are expressed as μmol substrate hydrolysed per min and related to 1 g of protein, estimated according to the Bradford method (Bradford, Reference Bradford1976). The results are expressed as mg protein per g fresh organ weight. All reagents were from Sigma Chemical Co. (St Louis, MO, USA) or from Merck (Darmstadt, Germany).
Statistics
All results were compared to the UC and expressed as group means±standard error of the mean (s.e.m.). For the statistical evaluations, SPSS® 17.0 (SPSS Inc, Chicago, Illinois, USA) was used. Comparison between the Giardia isolates was performed using a one-way analysis of variance (ANOVA) with LSD post-hoc for histopathology and enzyme activity data, and AUC values generated from intestinal trophozoite burdens and weight gain. The categorical inflammation data were analysed using a Chi-square test. A P-value of less than 0·05 was considered statistically significant.
RESULTS
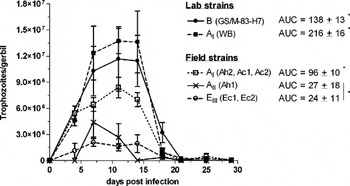
Infection dynamics (Fig. 1)
All isolates showed a similar basic pattern of infection but with variable levels of trophozoite burdens. All gerbils inoculated with GS/M-83-H7, WB and AI field isolates were positive on day 4 p.i., while only 50–75% were positive for the EIII field isolates and none for the AII field isolate. Trophozoites steadily increased in number and remained high until day 14 p.i., except for assemblage AII which already started to decrease on day 11 p.i. All isolates showed low trophozoite loads at day 18 p.i. (mean 1×10⁶/gerbil). Minimal residual burdens were still present on day 29 p.i. (mean 4·3×104/gerbil), except for the assemblage EIII field isolates that cleared around day 25 p.i. All assemblage subtypes displayed significantly different growth dynamics (P<0·05), with the exception of assemblage subtype AII and EIII, which showed comparable growth (P>0·05). The AI laboratory (WB) strain demonstrated the highest trophozoite burdens and AII and EIII subtypes the lowest.
The growth dynamics of laboratory and field strains of assemblage A, B and E. (Each data point represents the group means±s.e.m. of 4 gerbils.) *Significantly different from the other strains, P<0·05.

Clinical manifestations
The overall weight gain per assemblage subtype was significantly lower in infected gerbils (AUC=491·7±16·7), compared to the UC (AUC=769·4±59·2), but was not significantly different among the assemblage subtypes (P<0·05). Gerbils infected with the AI laboratory (WB), AI field and EIII field isolates showed occasional slight softening of the faeces, while infection with the GS/M-83-H7 strain resulted in more consistent softened faeces from day 7 until day 16 p.i.
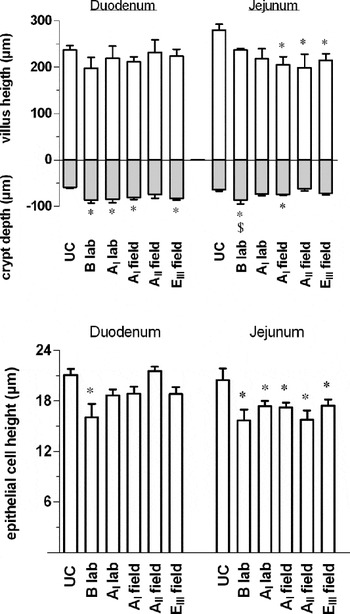
Mucosal architecture (Fig. 2)
On day 7 p.i., the duodenal villus height did not differ from the UC while the crypt depth was significantly increased by about 38% to 47% (P<0·05), except for the assemblage subtype AII field isolate. Jejunal villus height became reduced by 23% to 29% after infection with AI, AII and EIII field isolates, but the degree of villus shortening remained comparable between the subtypes mentioned. Jejunal crypt depth was increased by 35% and 16% upon infection with the assemblage B (GS/M-83-H7) laboratory strain and AI field isolates, respectively (P<0·05). Epithelial cell height in the duodenum did not differ from the UC, except for the assemblage B laboratory strain, while a reduction of 15% to 23% was observed in the jejunum for all strains without significant differences between the different subtypes. By day 18 p.i., almost full recovery was noted. Villus height had returned to UC values in both duodenum and jejunum. However, crypt hyperplasia was still present in the duodenum and jejunum of gerbils infected with the WB (AI laboratory) strain (+59%, +70%) and in the jejunum of GS/M-83-H7 (+22%) and AI field (+23%) isolate infected animals (P<0·05). Epithelial cell height had returned to UC values in the jejunum, but was still markedly decreased in the duodenum of gerbils infected with the GS/M-83-H7 (−35%) and AI field (−14%) isolates (P<0·05).
Analysis of crypt depth and villus and epithelial cell height in the small intestine of gerbils on day 7 p.i., with laboratory and field strains of assemblage A, B and E. (Each data point represents the group means±s.e.m. of 4 gerbils.) *Significantly different from the UC, P<0·05. $Significantly different from the other strains (except from the AI laboratory strain), P<0·05.

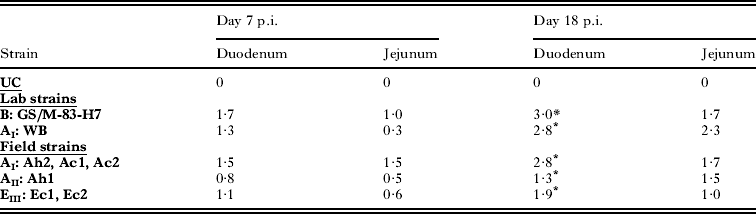
Infiltration of inflammatory cells and mast cells (Table 1)
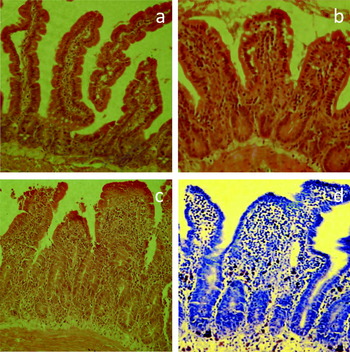
Only a marginal infiltration of inflammatory cells was observed in the epithelium and it was therefore decided to not specifically monitor the intraepithelial lymphocytes. In contrast, a slight to moderate infiltration of inflammatory cells developed in the lamina propria by day 7 p.i. and tended to increase by day 18 p.i. The lamina propria infiltration was generally more severe in the duodenum than in the jejunum. The inflammatory cell population consisted predominantly of plasma cells, lymphocytes, macrophages and mast cells. Comparing the changes among the assemblage subtypes, a significant difference (P=0·006) in the lamina propria infiltration of inflammatory cells was only found in the duodenum at day 18 p.i. Light microscopic analysis revealed a strong inflammatory cell infiltration in both villi and crypts after infection with the GS/M-83-H7, AI laboratory and field isolates (Fig. 3a–c). In contrast, only a slight to moderate inflammation was observed with the AII or EIII field isolates. Comparable, toluidine blue staining of duodenum day 18 sections showed a marginal number of mast cells adjacent to the crypts in the UC, AII or EIII infected gerbils and a markedly high infiltration of mast cells in the lamina propria of both crypts and villi after infection with the GS/M-83-H7 and AI (laboratory and field) isolates (Fig. 3d).
(a) Haematoxylin-eosin stained section of the uninfected control (UC) 18 days p.i. (b, c) Haematoxylin-eosin stained section of the WB laboratory strain of assemblage subtype AI showing a moderate (score 2) (b) to severe (score 3) (c) infiltration of inflammatory cells in both villi and crypts 18 days p.i. (d) Toluidine blue stained duodenal section of the WB laboratory strain of assemblage subtype AI showing a marked infiltration of mast cells in both villi and crypts 18 days p.i. (All figures were taken at ×200 magnification.)

Weighted means of the inflammation scores# obtained in gerbils infected with laboratory and field strains of assemblages A, B and E
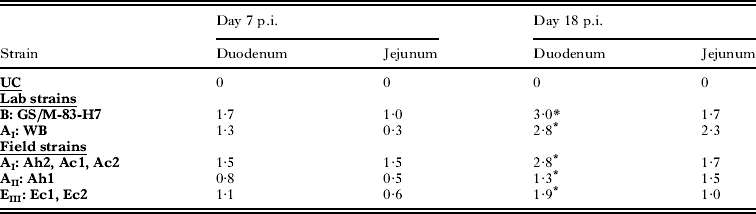
# Score 0=comparable to uninfected control (UC), Score 1=a slightly increased number of inflammatory cells in the villi; Score 2=moderately increased number of inflammatory cells in both villi and crypt; Score 3=severe inflammation with higher numbers of inflammatory cells compared to score 2.
* Significant difference between the assemblage subtypes B/AI and the assemblage subtypes AII/EIII (P=0·006).
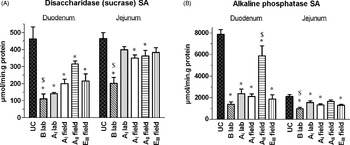
Brush-border enzyme activity (Fig. 4)
Since the disaccharidases (sucrase, maltase and lactase) showed similar SA profiles, only the sucrase SA is presented in Fig. 4. All assemblage subtypes significantly decreased the duodenal disaccharidases (32% to 84%) and alkaline phosphatase SA (26% to 82%). In the jejunum, only the assemblage B (GS/M-83-H7) laboratory and the AI field strain significantly reduced SA of all disaccharidases (11% to 61%) while the alkaline phosphatase SA was decreased (22% to 54%) for all assemblages except subtype AII. The B laboratory strain showed the highest reduction in all 4 brush-border enzyme SA. In contrast, subtype AII caused the lowest reduction in all 4 brush-border enzyme SA in the duodenum and in alkaline phosphatase SA in the jejunum.
Brush-border enzyme activity in the small intestine of gerbils on day 7 p.i., with laboratory and field strains of assemblage A, B and E. (a) Disaccharidase (sucrase) and (b) alkaline phosphatase SA. (Each data point represents the group means±s.e.m. of 4 gerbils.) *Significantly different from the UC, P<0·05. $Significantly different from the other strains (except from the AI laboratory strain for duodenum sucrase and AI, EIII field strains for jejunal alkaline phosphatase), P<0·05.

DISCUSSION
Although a large genetic and clinical variability has been identified among G. duodenalis isolates (Roxstrom-Lindquist et al. Reference Roxstrom-Lindquist, Palm, Reiner, Ringqvist and Svard2006), it is still unclear whether the various genotypes are associated with different disease outcome or intrinsic virulence. This study specifically aimed to explore the significance of the differences between assemblage subtypes AI, AII, B and EIII on intestinal growth and virulence characteristics in the gerbil model.
Our study indicates that the assemblage subtype can indeed be associated with particular intestinal growth characteristics since all displayed significantly different growth dynamics, with the exception of AII and EIII field isolates. The assemblage subtypes AI (laboratory and field isolates) and B were more infectious and produced higher trophozoite loads for a longer period of time compared to the subtypes AII and EIII. The AI laboratory strain demonstrated the highest trophozoite burden, significantly different from all other isolates including their assemblage-matching AI field strains. This may be linked to the long-term in vitro cultivation and successive passages that may have altered its growth characteristics. For example, the colonization capacity of the P0-1 laboratory strain (assemblage AI) was also found to be higher and more regular compared to an assemblage-matching field isolate (Sotiriadou and Karanis, Reference Sotiriadou and Karanis2004). Independent of the isolate, the acute phase of infection with high trophozoite burdens occurred between day 4 and day 11 p.i. with appreciable reduction by days 18–29 p.i., an infection pattern which is similar to that previously described for the WB and GS/M-83-H7 strain (Aggarwal and Nash, Reference Aggarwal and Nash1987; Belosevic et al. Reference Belosevic, Faubert and MacLean1989).
Morphological analysis of the small intestine on days 7 and 18 p.i., respectively representing the acute and recovery phase of infection, revealed crypt hyperplasia, villus atrophy and reduced epithelial cell height. Unlike the increased crypt depth, a decrease in villus and epithelial cell height was not consistently observed and not uniformly distributed over the small intestine, a phenomenon also observed in Giardia-infected patients (Farthing, Reference Farthing1997). Our results suggest a correlation of mucosal damage with the assemblage subtype, with considerable alterations after infection with assemblage subtype AI and B laboratory strain, moderate damage after AI field strains and only a low extent of damage after assemblage subtype AII and EIII infections (Table S1, online version only). Likewise, assemblage-linked reductions of brush-border enzyme activities were greatest in assemblage B-infected animals, followed by assemblage subtype AI (laboratory and field isolates), EIII and AII. The morphological and functional changes of the WB strain were within the same range as those found by other researchers (Belosevic et al. Reference Belosevic, Faubert and MacLean1989; Leitch et al. Reference Leitch, Udezulu, He and Visvesvara1993). However, the morphological damage in GS/M-83-H7 infected gerbils was not observed in BALB/c mice (Byrd et al. Reference Byrd, Conrad and Nash1994).
The activities of intestinal brush-border enzymes (e.g. alkaline phosphatase and disaccharidases) are markers of epithelial digestive function (Mahmood et al. Reference Mahmood, Kaur, Mittal and Mahmood2005) and were measured to assess the relevance of the observed villus and crypt modifications. Severe reductions in brush-border enzyme activities were found, even in the absence of obvious villus or epithelial cell damage. These findings are consistent with previous reports (Buret et al. Reference Buret, Gall and Olson1990; Cevallos et al. Reference Cevallos, Carnaby, James and Farthing1995) and suggest that brush-border enzyme deficiencies in giardiasis are correlated with a diffuse loss of epithelial brush-border microvillus surface area rather than with alteration in villus structure. Also consistent with previous reports (Buret et al. Reference Buret, Gall and Olson1991; Astiazaran-Garcia et al. Reference Astiazaran-Garcia, Espinosa-Cantellano, Castanon, Chavez-Munguia and Martinez-Palomo2000), the clinical manifestations of intestinal pathology remained fairly minimal: the net weight gain of infected gerbils was decreased compared to the uninfected controls but did not differ between the isolates, and softening of faecal pellets was noted for some assemblages. In our study, assemblage B-infected gerbils presented the highest faecal score and diarrhoea has indeed been described in gerbils infected with human or animal strains of G. duodenalis (Buret et al. Reference Buret, Gall and Olson1991; Majewska and Gustowska, Reference Majewska and Gustowska1996). Unfortunately, information on the genotype was not available making it impossible to align our findings. It also became clear that the severity of the clinical features (body weight, soft faeces) may not be related to the extent of mucosal abnormalities since assemblage AI induces a high degree of mucosal and functional damage without causing obvious signs of diarrhoea.
Immediately related to the fact that G. duodenalis preferentially colonizes the duodenum (Buret et al. Reference Buret, Gall and Olson1991), all isolates induced a significant larger reduction (10–28%) in the activity of the 4 brush-border enzymes in the duodenum compared to the jejunum. The mucosal abnormalities and brush-border enzyme malfunctions were markedly present during the acute phase of infection (day 7 p.i.) with clear signs of recovery by day 18 p.i. A direct correlation between the period of highest parasite loads and morphological/functional damage can therefore be suggested, which has already been hypothesized in previous literature reports (Belosevic et al. Reference Belosevic, Faubert and MacLean1989; Araujo et al. Reference Araujo, Mundim, Gomes, Amorim, Viana, Queiroz, Rossi and Cury2008). Consistent with this, the mucosal architecture in mice infected with the human BRIS/83/HEPU/106 isolate was quickly restored, whereas the avian BRIS/95/HEPU/2041 strain induced a long-term infection with villous atrophy still evident at 26 days p.i. (Williamson et al. Reference Williamson, O'Donoghue, Upcroft and Upcroft2000). The pathological effects observed during the acute phase of infection suggest a direct involvement of the parasite (or parasite products) on the mucosal lining. In addition, host immune responses (e.g. inflammation) do contribute to mucosal injury, as demonstrated by the absence of morphological injury in immunodeficient mice compared to immunocompetent controls carrying the same trophozoite burdens (Belosevic et al. Reference Belosevic, Faubert and MacLean1989; Mohammed and Faubert, Reference Mohammed and Faubert1995; Scott et al. Reference Scott, Logan, Klammer, Teoh and Buret2000).
Although Giardia infections in man are generally associated with little or no infiltration of inflammatory cells (Oberhuber et al. Reference Oberhuber, Kastner and Stolte1997; Roxstrom-Lindquist et al. Reference Roxstrom-Lindquist, Palm, Reiner, Ringqvist and Svard2006), a remarkable inflammation was observed in the lamina propria of all assemblage subtypes in this study. The experimental infections were established with sterile trophozoite cultures and one can therefore be sure that the observed inflammation must be linked to G. duodenalis. This is further supported by observations of mucosal inflammation in naturally infected humans and cattle (Ruest et al. Reference Ruest, Couture, Faubert and Girard1997; Hanevik et al. Reference Hanevik, Hausken, Morken, Strand, Morch, Coll, Helgeland and Langeland2007; Mokrzycka et al. Reference Mokrzycka, Kolasa, Kosierkiewicz and Wiszniewska2010), goats experimentally infected with isolates from pigs (Koudela and Vitovec, Reference Koudela and Vitovec1998) or gerbils infected with isolates from humans or rodents (Majewska and Gustowska, Reference Majewska and Gustowska1996). The inflammatory cell population of predominantly mononuclear cells is consistent with other reports (Oberhuber et al. Reference Oberhuber, Kastner and Stolte1997; Koudela and Vitovec, Reference Koudela and Vitovec1998; Ruest et al. Reference Ruest, Couture, Faubert and Girard1997; Hanevik, K. et al. Reference Hanevik, Hausken, Morken, Strand, Morch, Coll, Helgeland and Langeland2007; Mokrzycka et al. Reference Mokrzycka, Kolasa, Kosierkiewicz and Wiszniewska2010). The degree of infiltration varied depending on the isolate, the time-point in the infection and the intestinal region. The highest infiltration of inflammatory cells was found in the duodenum with assemblage B and AI (laboratory and field) being most severe while assemblage AII or EIII only showed slight to moderate inflammation. Quite remarkably, all infections demonstrated high inflammation scores at day 18 p.i., when the parasite load had already declined. Similarly, the lamina propria infiltration in gerbils infected with a rodent isolate (CP-117) was higher on day 21 p.i. than on day 7 p.i. (Majewska and Gustowska, Reference Majewska and Gustowska1996) and lymphocyte counts in Giardia-infected patients returned to normal some time after treatment and eradication of the parasite (Wright and Tomkins, Reference Wright and Tomkins1977). Consistent with these observations, a negative correlation between intestinal mast cell numbers and trophozoite burdens has been reported (Leitch et al. Reference Leitch, Udezulu, He and Visvesvara1993; Majewska and Gustowska, Reference Majewska and Gustowska1996) and suggests an association between parasite clearance and intestinal inflammation/mastocytosis. The mast cell infiltration observed in our study for the assemblage subtypes AI and B is in line with other reports describing gerbil infections with WB isolate cysts or non-genotyped trophozoites of humans (HP-10, HP-63) and animals (GGPRP-114, CP-117) (Leitch et al. Reference Leitch, Udezulu, He and Visvesvara1993; Majewska and Gustowska, Reference Majewska and Gustowska1996) and confirms the participation of mast cells in the immune response against Giardia, previously demonstrated in infected mice (Erlich et al. Reference Erlich, Anders, Roberts-Thomson, Schrader and Mitchell1983; Venkatesan et al. Reference Venkatesan, Finch and Wakelin1997; Li et al. Reference Li, Zhou, Petrin and Singer2004). Additionally, this work describes for the first time that mast cell infiltration can be associated with the infiltration of inflammatory cells as demonstrated by the severe infiltration of inflammatory cells and mast cells in the duodenum 18 days p.i. with assemblage subtypes B and AI.
In summary, this work confirms that the gerbil is an excellent model for investigating the pathogenesis of G. duodenalis infections and formulates previously undescribed links between the parasite genotype and growth or virulence. Within the gerbil model, the assemblage subtypes AI and B are suggested to be more infectious, produce higher trophozoite loads for a longer period and elicit relatively greater pathogenicity, characterized by higher intestinal inflammation and more extensive damage to mucosal architecture and function. The assemblage subtypes AII and EIII appear less virulent, although it must be recognized that not all factors contributing to virulence have been addressed in this study. The relatively small number of isolates may be regarded as a limitation in this work, hence additional assemblage AI, AII, B and EIII isolates are pivotal to fully corroborate our findings. As such, this work should be regarded as a first investigation providing initial orientation about the association between genotype and virulence, and should stimulate further research to identify genotype-specific molecular markers of virulence. The lack of genetic information in most published reports on pathogenicity has been a major shortcoming, but should become a standard requirement in future studies on Giardia in view of the present results.
ACKNOWLEDGEMENTS
We gratefully thank W. Deckers, P.B. Feijens, K. Huybrechts, G. Vrolix and M. Klimek for their technical assistance.
FINANCIAL SUPPORT
The post-doctoral researcher Paul Cos and the Ph.D. student Ely Bénéré are both supported by the Fund for Scientific Research (FWO-Flanders, Belgium). This project was also supported by a grant of the Research Council of the University of Antwerp (KP BOF UA to T.V.A.).