Introduction
Gallium oxide (Ga2O3) is potentially applicable in a broad range of optoelectronic applications, including UV solar blind detectors, field effect transistors, and power electronics.[ Reference Higashiwaki, Sasaki, Kuramata, Masui and Yamakoshi 1 – Reference Gogova, Schmidbauer and Kwasniewski 3 ] Doped β-Ga2O3 has the potential to out preform Si, GaN, and SiC in power electronics due to its large band gap of approximately 4.9 eV, and high-predicted breakdown strength of 8 MV/cm.[ Reference Higashiwaki, Sasaki, Kuramata, Masui and Yamakoshi 1 ] The recent availiblity of Ga2O3 single crystals could make cost competitiveness with Si a reality.[ Reference Zhang, Xia, Deng, Xu, Shi, Wu and Xu 2 ] However, it is first necessary to establish methods for the high-quality, low-temperature, and cost-effective processing of Ga2O3 films with controllable dopant activation before these materials can see large-scale application.
Ga2O3 films have been produced by a variety of growth techniques, including metal organic vapor phase epitaxy, molecular beam epitaxy, and physical vapor deposition.[ Reference Higashiwaki, Sasaki, Kuramata, Masui and Yamakoshi 1 , Reference Gogova, Schmidbauer and Kwasniewski 3 , Reference Orita, Hiramatsu, Ohta, Hirano and Hosono 4 ] The processing window for high-quality β-Ga2O3 films varies greatly between and often within a processing methodology. This is, in part, due to the high sensitivity of Ga2O3 to temperature and chemical potential of oxygen during processing, which can under relativtely mild conditions lead to Ga suboxides such as GaO and Ga2O.[ Reference Bartic, Baban, Suzuki, Ogita and Isai 5 – Reference Zinkevich and Fritz 7 ] This dependency is so strong that Ga2O3 is also being considered as a material for oxygen gas sensors.[ Reference Bartic, Baban, Suzuki, Ogita and Isai 5 ] A recent work in amorphous Ga2O3 films shows no significant change in structure with deposition temperature, but a considerable change in oxygen non-stiochiometry.[ Reference Heinemann, Berry, Teeter, Unold and Ginley 6 ] Furthermore, the pure oxides of GaO and Ga2O are thermodynamically unstable in the solid state making it difficult to track the temperature-dependent phase formation in this material system. Zinkevich and Fritz evaluated the phase diagram as a function of oxygen partial pressure and found that β-Ga2O3 is nearly stoichiometric at temperatures <1350 °C and oxygen partial pressures >0.0075 Torr.[ Reference Zinkevich and Fritz 7 ] As this is beyond the processing window for the most reported film growth, some oxidative instability therefore might be expected.
The consistent growth of high-quality Ga2O3 is further complicated by issues with structural polymorphism and dopant activation. There are eight distinct polymorphs of Ga2O3 in the ICSD. Beta-Ga2O3 phase, a monoclinic C2/m structure, is the lowest energy structure at room temperature and pressure. Although β-Ga2O3 is the ground state, the α-phase is roughly isostructural with sapphire and has previously been observed to form at the Ga2O3:Al2O3 interface leading to changes in Ga2O3 film microstructure.[ Reference Schewski, Wagner, Baldini, Gogova, Galazka, Schulz, Remmele, Markurt, von Wenckstern, Grundmann, Bierwagen, Vogt and Albrecht 8 ] Within β-Ga2O3, tin dopant incorporation could occur at either the tetrahedral or octahedral gallium site and the dominant defect is expected to be gallium vacancies. Recent theory seems to support this in that the phase instability for various defects is very close to the processing temperatures.[ Reference Zacherele, Schmidt and Martin 9 ] All of these issues lend credence to why in many reports the crystal quality and defect structure are highly variable.
In order to better understand the relationship between growth conditions, substrates induced epitaxy, and resulting film quality, pulsed laser deposition (PLD) was used on homoepitaxial and heteroepitaxial single-crystal substrates in both combinatorial and single composition growths. A range of processing temperatures and pO2 are employed during growth to determine the sensitivity of the phase formation, and optoelectrical properties to temperature and chemical potential of oxygen. The structure of Ga2O3 films deposited on 0001 cut sapphire and −201 Ga2O3 single crystals is determined by x-ray diffraction (XRD) and transmission electron microscope (TEM) to be consistent with the β-Ga2O3 phase from 350 to 550 °C and a pO2 of 5 × 10⁻⁶–1 × 10⁻³ Torr. Variations in the epitaxial orientation, dopant incorporation, and optoelectornic properties were shown to vary greatly over this processing window.
Methods
Thin films were deposited by PLD onto 0001 cut sapphire and −201 Ga2O3 single crystals from a 2 wt% Sn-doped Ga2O3 target (Materion, 99.995%). Prior to deposition the substrates were ultrasonicated in deionized water, acetone, isopropyl alcohol, and then cleaned by oxygen plasma ashing for 5 min. The PLD system employed a 248 nm KrF laser with an energy density of approximately 2.2 J/cm2 and pulse frequencies of 1, 10, or 30 Hz. The target substrate distance was 4 cm, unless otherwise specified. During single-point depositions the films were kept at a constant temperature between 200 and 600 ± 5 °C and a constant pO2 from 10−3 to 10−7 Torr. For combinatorial films the temperature was varied continuously over the same approximate temperature range, while all other conditions were held constant.
The crystalline structure of the films was characterized using XRD (Bruker: θ–2θ and Rigaku Dmax: pole figures). The chemical composition of the films was determined from Rutherford Back Scattering (RBS) using a 2 MeV He+ beam in a nearly 180° backscattering configuration. The RBS measurements were analyzed using the RUMP software. The opotoelectornic properties were characterized using UV–vis transmission and a combinatorial four-point measurement systems with Keithley 2401 source meters.
Site-specific specimens were prepared from the sapphire substrate samples in cross-section using standard focused ion beam (FEI Co. Helios 600i) preparation techniques and in situ manipulation. Specimens were subsequently analyzed using an FEI Co. Talos 200FX operating at 200 keV. Images were collected in the scanning transmission electron microscopy (STEM) mode using bright-field, dark-field, and high-angle annular dark-field (HAADF) detectors at a 60 mm camera length. Energy-dispersive x-ray spectroscopy (EDS) was performed in the STEM mode using a 1 nm diameter spot and nominally 200 kcps. Areas of 1000 × 1000 pixels were collected and individual pixels were quantified using standardless ZAF correction factors.
Results
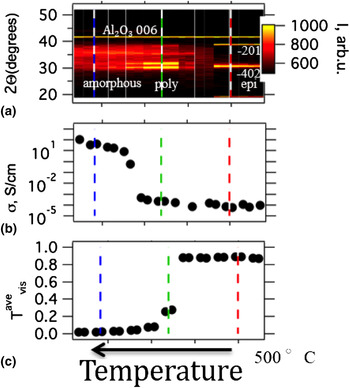
The first phase of this study was determining the temperature range over which phase pure β-Ga2O3 could be grown. Initial experiments were conducted on 0001-oriented single-crystal sapphire in order to determine the processing conditions for crystallization before moving to growth on homoepitaxial substrates. Combinatorial PLD was used to rapidly identify the temperature range of interest. Initial combinatorial processing results indicate that the phase formation of Ga2O3 thin films is extremely sensitive to small changes in temperature. Figure 1 shows the XRD, optical transmission, and conductivity data for a film deposited from a 2 wt% Sn-doped Ga2O3 target onto a 0001 sapphire wafer. A constant partial pressure of oxygen of 5 × 10⁻⁶ Torr and a target substrate distance of approximately 10 cm was maintained during depositions with an applied temperature gradient, maximizing at 500 °C on the far right and decreasing across the sample to the left to temperatures <250 °C. The gradient in substrate temperature across the sapphire wafer creates a near continuous structural change, with the cooler portion of the sample remaining amorphous, then transitioning into polycrystalline β-Ga2O3 with increasing temperature, and finally becoming solely −201-oriented β-Ga2O3 as the temperature reaches 500 °C. The color scale in Fig. 1(a) indicates intensity, while the vertical dashed lines are included as a guide to indicate the same phase region across multiple graphs. Figure 1(b) shows the change in conductivity as a function of temperature gradient across the sample. The temperature gradient leads to a change in conductivity over six orders of magnitude correlating with the onset of crystallinity. This is consistent with previous observations that the preponderance of Sn is inactive in amorphous Ga2O3.[ Reference Siah, Brandt, Lim, Schelhas, Jaramillo, Heinemann, Chua, Wright, Perkins, Segre, Gordon, Toney and Buonassisi 10 ] Figure 1(c) shows the changes in average transmission across the visible portion of the spectrum as a function of applied temperature gradient. The increasing temperature and associated phase change are concominate with a sharp increase in the transparency. The film goes from transparent in the visible range to full opaque within a very narrow temperature regime, which is slightly offset from the transition in conductivity. Similar decrease in transparency were observed with decreasing pO2, shown in online Fig. S1. Overall this shows that the phase formation and corresponding properties of Ga2O3 are extremely sensitive to the processing temperature and pressure.
(a), XRD, (b), conductivity, and (c), transmission for Sn-doped Ga2O3 films on 0001 sapphire as a function of combinatorial tempertautre processing.

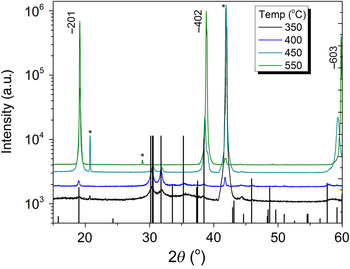
Next, based on the high-throughput screening, single depositions were made at a constant temperature and pressure in order to identify more precisely the impact of processing temperature. Figure 2 shows the XRD as a function of temperature for a set of films deposited at a constant temperature between 350 and 550 °C at a partial pressure of oxygen of 5 × 10⁻⁶ Torr. Below 250 °C, the films did not appear to be crystalline by the XRD. Previous reports did not find a crystalline phase below 450 °C.[ Reference Matsuzaki, Hiramatsu, Nomura, Yanagi, Kamiya, Hirano and Hosono 11 ] Films processed at 350 °C crystallize into the β-Ga2O3 phase. The black lines are referenced to the ICDD PDF 00–041–1103 with the −201 peaks labeled and substrate peaks indicated by the * symbol. Schewski et al. reported the formation of the α-phase Ga2O3 when depositing on the 0001 sapphire substrates, but this phase was not observed by the XRD in this work.[ Reference Schewski, Wagner, Baldini, Gogova, Galazka, Schulz, Remmele, Markurt, von Wenckstern, Grundmann, Bierwagen, Vogt and Albrecht 8 ] Previous reports of Sn-doped Ga2O3 thin films have also seen another secondary orthorhombic phase which was not observed in this study.[ Reference Matsuzaki, Hiramatsu, Nomura, Yanagi, Kamiya, Hirano and Hosono 11 ] With increasing temperatures from 400 to 550 °C, the out-of-plane orientation along the −201 increases. The onset of exclusive −201 orientation begins at 450 °C and saturates at 550 °C. Online Supplemental Fig. S2 shows the XRD patterns for Sn-doped and -undoped Ga2O3 films. These films were both processed at 450 °C and 5 × 10⁻⁶ Torr and are nominally the same thickness. Simlar to the undoped films, there were no second phases observed in the xrd patterns of the doped films. Generally, the temperatures for phase formation are much lower than those used in molecular beam epitaxy growth, suggesting that these PLD-processing parameters provide advantageous routes cost-effective low-temperature processing and the ability to integrate with complex electronic systems. Films were also processed over the same temperature range at a pO2 of 1 × 10⁻³ Torr, although these films were less crystalline and more insulating than the films grown at lower pO2. Work is underway to further understand the impact of deposition pressure and pO2 on the phase formation, and the optical and electrical properties of PLD-deposited Ga2O3 thin films.
XRD as a function of temperature for Ga2O3 films deposited onto (0001) sapphire.

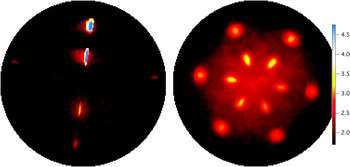
In order to investigate the three-dimensional (3D) changes in the structural orientation as a function of temperature and substrate, pole figures were taken in homoepitaxial and heteroepitaxial films along the [002], [111], [112], [113], and [−201]. Figures 3(a) and 3(b) show a comparison of the pole figures taken along the [002] of a film deposited on a −201-oriented Sn-doped Ga2O3 single-crystal and 0001 cut sapphire (Al2O3), respectively. These films were processed at 450 °C and 5 × 10⁻⁶ Torr. Variations between the maximum intensity are associate with a slight misorientation of the surface normal during the scans. Pole figures were taken first of bare substrates and care was taken to avoid film peaks, which overlapped with the substrate peaks. Predictions of the 3D XRD response, the chi (χ) and phi (ϕ) positions, for a fully epitaxial, non-doped single crystal were determined using the following lattice parameters, a = 12.23, b = 3.04, and c = 5.80 Å with α = 90°, β = 103.7°, and γ = 90° and the −201 orientation as the surface normal.[ Reference Zhang, Xia, Deng, Xu, Shi, Wu and Xu 2 ] For the heteroepitaxial film, the calculated Chi-position for the [002] peaks was 49.92° which is in good agreement with the observed peak at 49.0 ± 0.5°. A secondary set of peaks occurs in the [002] pole figure for the −202 set of peaks. These peaks were predicted at a χ of 22.5° and observed at 22.3 ± 0.5°, again in good agreement. The average full-width at half-maximum (FWHM) distribution of crystallite orientation along χ for the 002 and −202 peaks is 3° and 9°, and the average FWHM distribution in ϕ is 6° and 8°, respectively. For the homoepitaxial films, the same [002] and [−202] peaks occurred only with much greater intensity. The average measured χ position the thin films and single-crystal substrate for the [002] and [−202] was 49.75° and 22.5°, respectively. The distribution in crystallite orientation along χ for the [002] and [−202] peaks in the homoepitaxial crystals and films were approximately 4° and 4°, and the average FWHM distribution in ϕ is 3° and 2°, respectively. Homoepitaxial films exhibited 002 peaks separated by 180° in ϕ, consistent with the expected monoclinic structure. The heteroepitaxial films on sapphire exhibited six 002 peaks along ϕ separated by 60°. Online Fig. S3 shows this in a ϕ scan taken at the maximum in χ for the 002 over 360° in ϕ. This is indicates the presence of three distinct crystallographic domains, nucleating from the sapphire substrate at intervals of 60°. Multiple crystallographic domains are detected in all pole figure data sets, including the [113] shown in online Fig. S4. The presence of multiple crystallographic domains in films on sapphire means that even for highly oriented, high-quality films there will still be areas of lower density with properties, which deviate from the bulk response.
(a) An XRD pole figure of a 2% Sn: Ga2O3 films on Ga2O3 single-crystal substrates along the [002]. (b) An XRD pole figure of a 2% Sn:Ga2O3 on (0001) sapphire single crystal also along the [002].

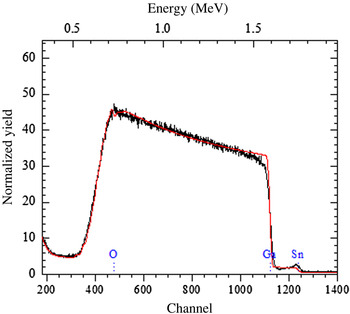
The next important factor to determine is how the temperature and structural changes influence to doping and stoichiometry of the films. Rutherford backscattering was used to determine the chemical composition of the films, particularly the concentration of the tin dopant. The thickness of the films used to model the RBS data was verified using TEM. The average Sn concentration in the films decreases with increasing temperature, starting from a 2 wt.% Sn doped in the target, to 1.8% for films deposited at or below 450 °C to 1.3% Sn doping for films processed at 550 °C. This could indicate a dopant saturation beyond this limit, which is confirmed further by TEM. For a films processed at 400 and 450 °C, there was a slight increase in Sn concentration towards the surface of the samples. Figure 4 shows the RBS measurements and fit for a film processed at 450 °C on (0001) sapphire also shows an increase in Sn concentration at the front surface. From the RBS spectra, this is interpreted as a real increase in relative Sn chemical concentration and not a channeling effect because there is no evidence of channeling in the scattering from Ga which would be easily observed if channeling was occurring in these Ga2O3 based materials. The increase in Sn concentration towards the surface of the samples could indicate that the residual Sn not included in the bulk of the sample is excluded to the surface of the sample during growth or a high mobility of Sn during growth. Slightly higher near surface concentrations of dopant were observed only for samples processed at 400 and 450 °C on sapphire, but not for samples processed at higher or lower temperatures.
RBS measurements and fit for Ga2O3 films on 0001 Al2O3 processed at 400 °C. Dashed lines indicate the on-set of the chemical signal from Sn, Ga, or O.

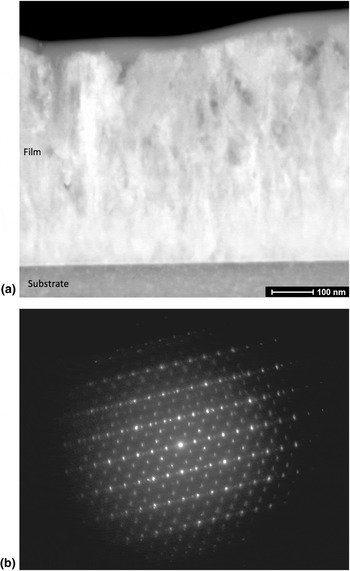
Transmission electron microscopy was used to further investigate the location of the tin within lattice and determine the source of the Sn concentration gradients seen in the RBS measurements. Figure 5 shows representative microstructure for Ga2O3 films deposited on a 0001 sapphire at 450 °C. Specifically, Fig. 5(a) is a STEM dark-field micrograph of the film cross-section from the substrate to the top surface. There are only small changes in the dark-field intensity, indicating that the film crystallography is consistent normal and parallel to the substrate interface. This is further substantiated in Fig. 5(b) where a selected area electron diffraction pattern collected using the entire film thickness exhibits single-crystal structure. Indexing the diffraction spots indicates a strong correlation to β-Ga2O3, consistent with the XRD results with strong 002 texture normal to the film surface.
(a) STEM dark-field image of the film cross-section from the substrate to the top surface. Only small changes in contrast are observed throughout the film thickness, indicating a uniform crystallography with small regions on non-conformity. (b) Selected area electron diffraction pattern collected from the film cross-section. Diffraction spots match well to the d-spacings and intensitites of β-Ga2O3 and are representative of a single crystallographic orientation being sampled from a region similar in area to Fig. 5(a).

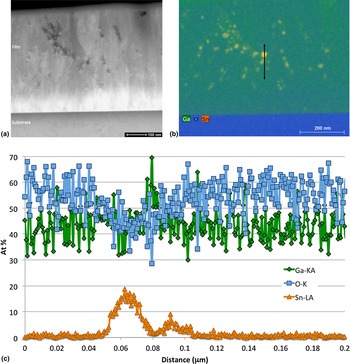
Z-contrast STEM microcraphs were acquired using a HAADF detector, and a representative image is shown in Fig. 6(a). Several regions of changing composition are observed in this image, consistent with both higher and lower atomic numbers. STEM–EDS spectral imaging [Fig. 6(b)] illustrates that these changes in the atomic number are associated with Sn segregation from the bulk β-Ga2O3. Following the semi-quantitative analysis of the spectral image, a line profile was extracted through one of the Sn-rich regions [Fig. 6(c)]. As can be seen, both Ga and O decrease at similar rates through the Sn-rich region, indicating a low O concentration. Quantification in this region is difficult due to the Sn-rich region being smaller than the thickness of the specimen, thus a residual Ga and O signal will be persistent. Away from the Sn-rich region, i.e., the bulk β-Ga2O3, Sn concentrations are found to be near the detection limit of the EDS system, or about 1 at%. It should be noted that Al is present in similar quantities, presumably in solid solution following diffusion from the substrate.
(a) STEM–HAADF micrograph illustrating regions of changing elemental composition throughout the thickness of the film. (b) STEM–EDS spectral image illustrating regions of bulk Ga2O3 and isolated regions rich in Sn. (c) Line profile showing elemental composition as a function of position from the region shown in Fig. 6(b). Regions rich in Sn have significantly less oxygen associated with them than the Ga2O3.

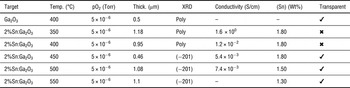
A summary of the processing conditions, thickness, XRD results, conductivity, transparency in the visible, and average tin-doping concentrations for Ga2O3 thin films on sapphire is provided in Table I. Overall, these results are consistent with the sharp variations in structure and properties seen by combinatorial PLD. Single-point depositions at 450 °C the films were highly crystalline, highly oriented, transparent, and slightly conductive. The conductivity in these samples is likely greater than the conductivity measured by four-point on the bare surface of the sample, where it has previously been shown that large band bending at the surface of Ga2O3 films hinders the formation of ohmic contacts.[ Reference Lovejoy, Chen, Zheng, Villora, Shimamura, Yoshikawa, Yamashita, Ueda, Kobayashi, Dunham, Ohuchi and Olmstead 12 ] Work is ongoing to determine optimal metallization for ohmic contacts and the impact of pO2 and total pressure on the optoelectronic response.
Doping concentrations, conductivity and processing parameters of the Ga2O3 films deposited on (0001) Sapphire.

Supplementary material
The supplementary material for this article can be found at https://doi.org/10.1557/mrc.2016.50.
Acknowledgments
This work was funded by the Center for the Next Generation of Materials by Design, an Energy Frontier Research Center funded by the U.S. Department of Energy, Office of Science, Basic Energy Sciences under Contract No. DE-AC36-08GO28308 to NREL.