Introduction
Carl Sagan once said, ‘The nature of life on Earth and the search for life elsewhere are two sides of the same question – the search for who we are’.
In fact, investigations into the existence of life in other parts of the cosmos find strong parallels with studies of the origin and evolution of life on our planet. In this way, astrobiology and paleobiology share some problems and interests: (1) the establishment of biogenicity criteria; (2) the recognition of viable contexts for life; (3) efficient ways of accessing information and interpreting data; and (4) the development of techniques that allow access to data (Brasier and Wacey, Reference Brasier and Wacey2012; Fairchild et al., Reference Fairchild, Sanchez, Pacheco and de Moraes Leme2012; Pacheco et al., Reference Pacheco, Becker-Kerber, Barroso, Galante, Silva, Rodrigues, Horvath and Avellar2016). Since then, NASA (National Aeronautics and Space Administration) came to view the fossil record as important evidence of extraterrestrial life, to be investigated on planets such as Mars (Grotzinger, Reference Grotzinger2014).
Recent discoveries integrated with increasingly sophisticated forms of research and hypothesis testing (Dodd et al., Reference Dodd, Papineau, Grenne, Slack, Rittner, Pirajno, O'Neil and Little2017; Orosei et al., Reference Orosei, Lauro, Pettinelli, Cicchetti, Coradini, Cosciotti, Di Paolo, Flamini, Mattei, Pajola, Soldovieri, Cartacci, Cassenti, Frigeri, Giuppi, Martufi, Masdea, Mitri, Nenna, Noschese, Restano and Seu2018) have updated and revised our concepts and understanding of the boundaries of the terrestrial biosphere, as well as habitability on Mars. This updating of knowledge can even be extrapolated to other parts of the cosmos.
The development and improvement of techniques for accessing paleobiological, geobiological and paleoenvironmental information go side by side with new conceptual approaches in paleobiology, yielding greater methodological improvements and robustness to the search for evidence of life in other parts of the cosmos (e.g. Schopf et al., Reference Schopf, Farmer, Foster, Kudryavtsev, Gallardo and Espinoza2012). This methodological revolution in the study of the fossil record is known as paleometry (Riquelme et al., Reference Riquelme, Ruvalcaba-Sil and Alvarado-Ortega2009; Delgado et al., Reference Delgado, Buck, Osés, Ghilardi, Rangel and Pacheco2014).
In this context, Brazil is a great laboratory. It is rich in sedimentary basins ranging from exceptionally well-preserved fossils to structures of uncertain biological nature. Fossils are preserved in a wide variety of facies, lithologies and times (Fig. 1). This scenario is important to studies that aim to test, understand and correlate geobiological, fossil diagenetic and paleoenvironmental aspects, as well as biogenicity criteria, which may aid in the reconstitution of processes and conditions related to the establishment of life on rocky planets.
(a) Localization of the geological units addressed here and their respective general stratigraphic columns. (1) Corumbá Group, Tamengo Formation, Mato Grosso do Sul state (based on Parry et al., Reference Parry, Boggiani, Condon, Garwood, Leme, McIlroy, Brasier, Trindade, Campanha, Pacheco, Diniz and Liu2017). (2) Chapada Group, Unit 2, Mato Grosso do Sul state (based on Becker-Kerber et al., Reference Becker-Kerber, Osés, Curado, Rizzutto, Rudnitzki, Romero, Onary-Alves, Benini, Galante, Rodrigues, Buck, Rangel, Ghilardi and Pacheco2017a). (3) Itajaí Basin, Santa Catarina state (based on Guadagnin et al., Reference Guadagnin, Chemale, Dussin, Jelinek, dos Santos, Borba, Justino, Bertottia and Alessandretti2010). (4) Santana Formation, Crato Member, Ceará state (based on Osés et al., Reference Osés, Petri, Voltani, Prado, Galante, Rizzutto, Rudnitzki, Silva, Rodrigues, Rangel, Sucerquia and Pacheco2017). Vector data from the geosgb CPRM database.

This article aims to promote discussions, reflections and perspectives on paleometry as a useful tool for accessing information in the fossil record and in experimental taphonomic contexts, as well as their direct and indirect contributions to the development of paleobiology and astrobiology. Some case studies together with new data from the Brazilian fossil record will be presented here, integrating distinct temporal and paleoenvironmental contexts.
Paleometry: accessing and revealing new information from rocks
In recent decades, the use of a number of quantitative and/or qualitative and non-destructive (or less invasive) analytical techniques has proved to be important for the study of very ancient and rare fossils. This combined and interdisciplinary effort among different areas of knowledge (e.g. physics, chemistry, mathematics and paleontology) is called paleometry (Riquelme et al., Reference Riquelme, Ruvalcaba-Sil and Alvarado-Ortega2009; Delgado et al., Reference Delgado, Buck, Osés, Ghilardi, Rangel and Pacheco2014).
This methodological approach ranges from the use of macroscale procedures, such as collecting and mapping fossil samples, by means of a total station, for example (Bissaro et al., Reference Bissaro-Júnior, Ghilardi, Bueno, Manzoli, Adorni, Muniz, Guilherme, Filho, Negri and Hsiou2018), to the 3D imaging and modelling of macrovertebrates (Maldanis et al., Reference Maldanis, Carvalho, Almeida, Freitas, de Andrade, Nunes, Rochitte, Poppi, Freitas, Rodrigues, Siljeström, Lima, Galante, Carvalho, Perez, de Carvalho, Bettini, Fernandez and Xavier-Neto2016). On the micro- and ultrastructural scales, the combined use of various techniques, such as spectroscopies, microtomography and confocal microscopy, have allowed the refinement of biogenicity criteria and a detailed characterization of microfossils (e.g. Schopf et al., Reference Schopf, Kudryavtsev, Agresti, Czaja and Wdowiak2005; Chen et al., Reference Chen, Bottjer, Davidson, Li, Gao, Cameron, Hadfield, Xian, Tafforeau, Jia, Sugiyama and Tang2009; Bidola et al., Reference Bidola, Stockmar, Achterhold, Pfeiffer, Pacheco, Soriano, Beckmann and Herzen2015a, Reference Bidola, Zanette, Achterhold, Holzner and Pfeiffer2015b). Those techniques also increased the understanding of patterns of preservation of organisms at different stages of diagenesis (e.g. Trueman, Reference Trueman2013), as well as other aspects that are of paramount importance for the recognition of potential biases in the fossil record.
It is worth mentioning that paleometry presents an important concern with constant improvements, developments, comparative studies and proposals of increasingly effective and efficient methods for obtaining higher-quality data.
In this way, paleontology moves to a new level of knowledge and sophistication. As a science, it no longer demands only basic and descriptive interpretations but rather a well-founded relationship with modern methodological assumptions that allows the deepening and integration of research results among several areas (e.g. geochemistry, sedimentology and astrobiology) in a more systemic scenario of approaches.
In the last decade, the use of paleometric techniques began to expand in Brazil by means of the analyses of fossils from the Precambrian (e.g. Pacheco et al., Reference Pacheco, Galante, Rodrigues, Leme, Bidola, Hagadorn, Stockmar, Herzen, Rudnitzki, Pfeiffer and Marques2015; Bidola et al., Reference Bidola, Stockmar, Achterhold, Pfeiffer, Pacheco, Soriano, Beckmann and Herzen2015a, Reference Bidola, Zanette, Achterhold, Holzner and Pfeiffer2015b; Becker-Kerber et al., Reference Becker-Kerber, Pacheco, Rudnitzki, Galante, Rodrigues and de Moraes Leme2017b), Cretaceous (Lima et al., Reference Lima, Saraiva, Lanfredi, Nobre, Freire and Sasaki2007; Freire et al., Reference Freire, Abagaro, Sousa Filho, Silva, Saraiva, Brito and Viana2013; Maldanis et al., Reference Maldanis, Carvalho, Almeida, Freitas, de Andrade, Nunes, Rochitte, Poppi, Freitas, Rodrigues, Siljeström, Lima, Galante, Carvalho, Perez, de Carvalho, Bettini, Fernandez and Xavier-Neto2016; Osés et al., Reference Osés, Petri, Becker-Kerber, Romero, de Almeida Rizzutto, Rodrigues, Galante, Silva, Curado, Rangel, Ribeiro and Pacheco2016, Reference Osés, Petri, Voltani, Prado, Galante, Rizzutto, Rudnitzki, Silva, Rodrigues, Rangel, Sucerquia and Pacheco2017) and, more recently, Devonian (Becker-Kerber et al., Reference Becker-Kerber, Osés, Curado, Rizzutto, Rudnitzki, Romero, Onary-Alves, Benini, Galante, Rodrigues, Buck, Rangel, Ghilardi and Pacheco2017a) and Cenozoic (Bissaro et al., Reference Bissaro-Júnior, Ghilardi, Bueno, Manzoli, Adorni, Muniz, Guilherme, Filho, Negri and Hsiou2018).
Here on Earth, or on Mars, rocks are rocks, and they can preserve fossils. In addition to research from other countries, studies on Brazilian fossils have contributed to a new scenario of 21st century paleontology, not only by the use of new techniques of analysis but also through interdisciplinary approaches and applications, including astrobiology.
Biosignatures
Biosignatures are able to reveal evidence of life in deep time on Earth or elsewhere in the Solar System and exoplanets (Conrad and Nealson, Reference Conrad and Nealson2001).
The definition of a biosignature is dependent on the concept of life, which is an open discussion (Benner, Reference Benner2010), but it can be pragmatically understood as the search for what life, as we know on Earth, needs and/or leaves behind. The issue is that some of those signals can also be a result of abiotic processes (Westall et al., Reference Westall, Foucher, Bost, Bertrand, Loizeau, Vago, Kminek, Gaboyer, Campbell, Bréhéret, Gautret and Cockell2015), so scientists need to carefully follow and revise the biogenicity criteria.
Mars is an iconic example of a promising but challenging place for the investigation of biosignatures. In the 1970s, the Viking missions presented a positive result for metabolism on the surface of the planet (Levin and Straat, Reference Levin and Straat1976), which was later contested. In the 1990s, McKay et al. (Reference McKay, Gibson, Thomas-Keprta, Vali, Romanek, Clemett, Chillier, Maechling and Zare1996) described microscopic structures on the ALH84001 meteorite as being of biological origin. However, recent contributions reinforced an inorganic nature for these structures (Golden et al., Reference Golden, Ming, Morris, Brearley, Lauer, Treiman, Zolensky, Schwandt, Lofgren and Mckay2015). Noffke (Reference Noffke2015) suggested possible signs of microbially induced sedimentary structures (MISS) on Mars, but further evidence of their biological origin is still necessary.
Biosignatures can be classified in order of decreasing complexity as follows: technological, morphological, molecular, mineral, elemental and isotopic. We can also organize these classes of biosignatures on a scale (Fig. 2). When you move right on the diagram (from isotopic to technological), the biosignature becomes easier to detect but less likely to be present (e.g. a SETI coded radio signal). In the opposite direction, biosignatures are more prone to be present but harder to detect (e.g. an isotopic fractionation due to enzymatic activity) (Javaux and Dehant, Reference Javaux and Dehant2010).
Different scales for biosignatures. Moving to the right, the potential biosignatures become easier to detect, but less likely to be present (adapted from Javaux and Dehant, Reference Javaux and Dehant2010).

However, investigating biosignatures on other planets is not an easy task. It is here that the study of the Earth's geological record can be of paramount significance, since the search for biosignatures in ancient environments can provide a profitable way of applying the biogenicity criteria. This allows the proposal of stronger parameters for the detection and characterization of biosignatures elsewhere.
Anatase as a biosignature? Insights from microbial structures from the Itajaí Basin (SC, Brazil)
The Itajaí Basin is an Ediacaran unity interpreted as a foreland basin, characterized by alluvial, deltaic and marine deposits, delimited by regional unconformities and with important contributions of conglomerates and turbidites, as well as volcaniclastic deposits (Rostirolla, Reference Rostirolla1991; Paim and Fonseca, Reference Paim, Fonseca, Mantesso-Neto, Bartorelli, Carneiro and Brito-Neves2004; Basei et al., Reference Basei, Drukas, Nutman, Wemmer, Dunyi, Santos, Passarelli, Campos, Siga and Osako2011).
The microbial structures studied here came from the fine-grained siliciclastic Itajaí rocks, usually regarded as the ‘C Facies Association’ of Rostirolla et al. (Reference Rostirolla, Ahrendt, Soares and Carmignani1999). A preliminary micro-Raman point analysis has revealed a major presence of characteristic bands of anatase (a polymorph of titanium dioxide) in the fossil compared with the rock matrix (Fig. 3).
Raman spectra of microbial mats and host rock from the Itajaí Basin. Note the higher intensity of anatase bands in the microbial region compared to rock matrix.

The three most commonly studied TiO2 polymorphs are anatase, rutile and brookite. Interestingly, anatase has recently been related to fossilized microbial organic matter, suggesting a possible biological origin or an unusual type of fossilization (Glamoclija et al., Reference Glamoclija, Steele, Fries, Schieber, Voytek and Cockell2009). Other studies have shown the association of cyanobacteria (Bower et al., Reference Bower, Hummer, Steele and Kyono2015) and anaerobic bacteria (Adrian et al., Reference Adrian, Manz, Szewzyk and Görisch1998; Bedard et al., Reference Bedard, Bailey, Reiss and Jerzak2006) with titanium, implying a likely biogenic interference.
The association of this mineral with microbial structures from the Itajaí Basin indicates a possible influence of biological activity on the precipitation of anatase. Further investigations are necessary to elucidate the relation of anatase to biological activity and the possible titanium sources as well as to refute other unusual abiotic processes that could account for the anatase accumulation during diagenesis. If corroborated, these results may show great potential for defining anatase as an important biosignature.
Finally, advanced techniques will be essential in future studies focusing on differentiating biogenic anatase from inorganic forms, using parameters such as the crystal morphology, trace elements and isotopic fractionation.
Evaluating biogenicity in the fossil record
Throughout the Earth's history, life assumed a diverse array of morphologies and dimensions that greatly varied through time. The same is true for the profound modifications produced by life in the environment (e.g. an increase in oxygen levels, substrate mixing).
Much controversy emerges each time that researchers claim to have found ‘the oldest evidence of life’. It leads to an increase in studies from other scientists that scrutinize those claims (e.g. Brasier et al., Reference Brasier, Green, Jephcoat, Kleppe, Van Kranendonk, Lindsay, Steele and Grassineau2002; Brasier et al., Reference Brasier, Antcliffe, Saunders and Wacey2015). In many occasions, this is accomplished by the use of a diverse array of analytical techniques (Wacey et al., Reference Wacey, Saunders, Kong and Brasier2015). Since the beginning, concerns about the nature of putative fossils have shaped and been a fundamental part of Precambrian paleontology (e.g. Cloud, Reference Cloud1973; Glaessner, Reference Glaessner1980; Buick, Reference Buick1990; Brasier et al., Reference Brasier, Green, Jephcoat, Kleppe, Van Kranendonk, Lindsay, Steele and Grassineau2002; Wacey et al., Reference Wacey, Saunders, Kong and Brasier2015). Although different biogenicity criteria can be proposed for different categories of structures (e.g. stromatolites, MISS, microfossils), some aspects can be shared among all (see Wacey, Reference Wacey2010; Brasier et al., Reference Brasier, Antcliffe, Saunders and Wacey2015), such as (i) consistency between structures and the geological unit of provenance; (ii) the presence of structures in thin sections exhibiting their inclusion in the sedimentary matrix; (iii) the syndepositional aspect of the putative fossils; (iv) a comparable morphology and size to biological structures; (v) a wide spectrum of taphonomic variation; and (vi) geochemical signals of bioactivity.
More specifically, paleometric techniques can be of key importance to evaluating strong signs of biogenicity by means of providing access to detailed morphology, kerogen signs, isotopic fractionations and biomarkers (e.g. δ13C, Corg, terpenes). Among the techniques that aid in the identification of these signatures are scanning electron microscopy (SEM), energy-dispersive X-ray spectroscopy (EDS), transmission electron microscopy, synchrotron X-ray microtomography, secondary ion mass spectrometry and Raman spectroscopy (RS) (Schopf et al., Reference Schopf, Kudryavtsev, Agresti, Czaja and Wdowiak2005; Wacey et al., Reference Wacey2009). As expected, because these are powerful analytical methods, many of these techniques are also used in astrobiology and astronomy, especially for the identification of life on other planets and chemical signatures of extraterrestrial matter (Toporski et al., Reference Toporski, Steele, Westall, Thomas-Keprta and McKay2002).
In the present work, we adopted the most accepted, widely used and far-embracing criteria for biogenicity until now. These criteria were applied to some dubious millimetric ovoid-like structures from the Ediacaran shales of the Tamengo Formation (MS, Brazil). The application of the biogenicity test on these old structures can also have implications in astrobiology, as their determination can give insights into the evolution and preservation of early life and the identification of ancient life forms and/or structures related to its activity on rocks.
Enigmatic ovoid structures from shales of the Tamengo Formation – microfossils or pseudofossils?
The Tamengo Formation (Corumbá Group, Brazil) is a late Ediacaran carbonate-siliciclastic unity. The top of this succession was recently dated at ~542 Ma (Parry et al., Reference Parry, Boggiani, Condon, Garwood, Leme, McIlroy, Brasier, Trindade, Campanha, Pacheco, Diniz and Liu2017), corroborating earlier correlations with coeval carbonate successions, such as the Nama Group. Similar to the latter, the Tamengo Formation also holds the record of some of the oldest biomineralized animals, mainly the remains of the conic-tubular Cloudina. Another Tamengo metazoan with a possibly mineralized skeleton is Corumbella (Pacheco et al., Reference Pacheco, Galante, Rodrigues, Leme, Bidola, Hagadorn, Stockmar, Herzen, Rudnitzki, Pfeiffer and Marques2015).
Precambrian rocks often yield many dubious forms that made paleontologists and geologists ‘scratch their heads’ to solve the problem. The Tamengo Formation is not an exception. Recently, ovoid structures were discovered in the shales of this unity (Bidola et al., Reference Bidola, Stockmar, Achterhold, Pfeiffer, Pacheco, Soriano, Beckmann and Herzen2015a, Reference Bidola, Zanette, Achterhold, Holzner and Pfeiffer2015b), occurring in the same levels as the metazoan Corumbella. These spheroidal to ovoidal forms are slightly irregular, with maximum widths varying between 0.08 and 0.9 mm (N = 199, mean = 0.22 mm, median = 0.21 mm) and minimum widths varying between 0.05 and 0.8 (N = 199; mean = 0.166 mm, median = 0.152 mm).
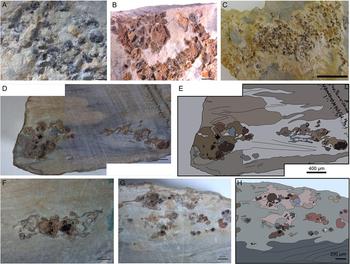
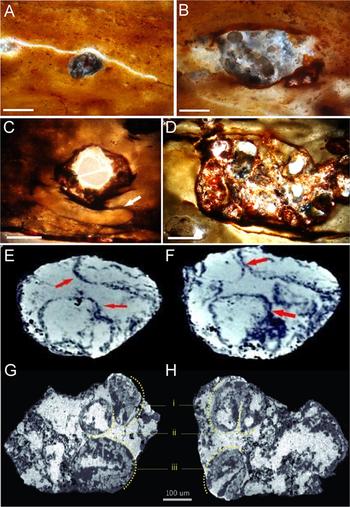
The ovoids usually occur in aggregates, with a horizontal to subhorizontal distribution in vertical sections (Fig. 4). In thin sections, deformations in the lamination beneath one ovoid were observed (Fig. 5). Micro-CT and petrographic analyses revealed internal subdivisions, also with ovoidal shapes and submillimeter size (Fig. 5). However, no structure resembling cellular or tissue organization was observed.
Hand samples with ovoidal structures from the Tamengo Formation. (a–c) Distribution of the ovoids in bedding plane view. (d, f, g) Polished sections showing the sub-horizontal distribution of aggregates in vertical sections. (e, h) Schematic drawing of regions in (d) and (g), respectively. Scales: 0.2 mm (a, d–h); 1 mm (b); 1 cm (c).

Internal morphology of the ovoids. (a, b) Thin sections with ovoids filled with microcrystalline quartz. (c) Thin section with ovoid showing possible gas escape structures (arrow) and dark crenulated laminations. (d) Ovoid with complex and heterogeneous internal constitution. (e–h) μ-CT reconstructions of internal subdivisions (arrows and numbers i–iii). Scales: 250 µm (a); 125 µm (b); 1 mm (c); 500 µm (d).

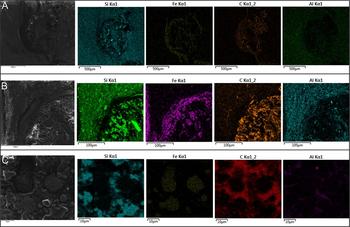
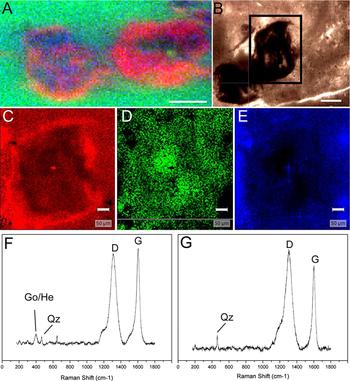
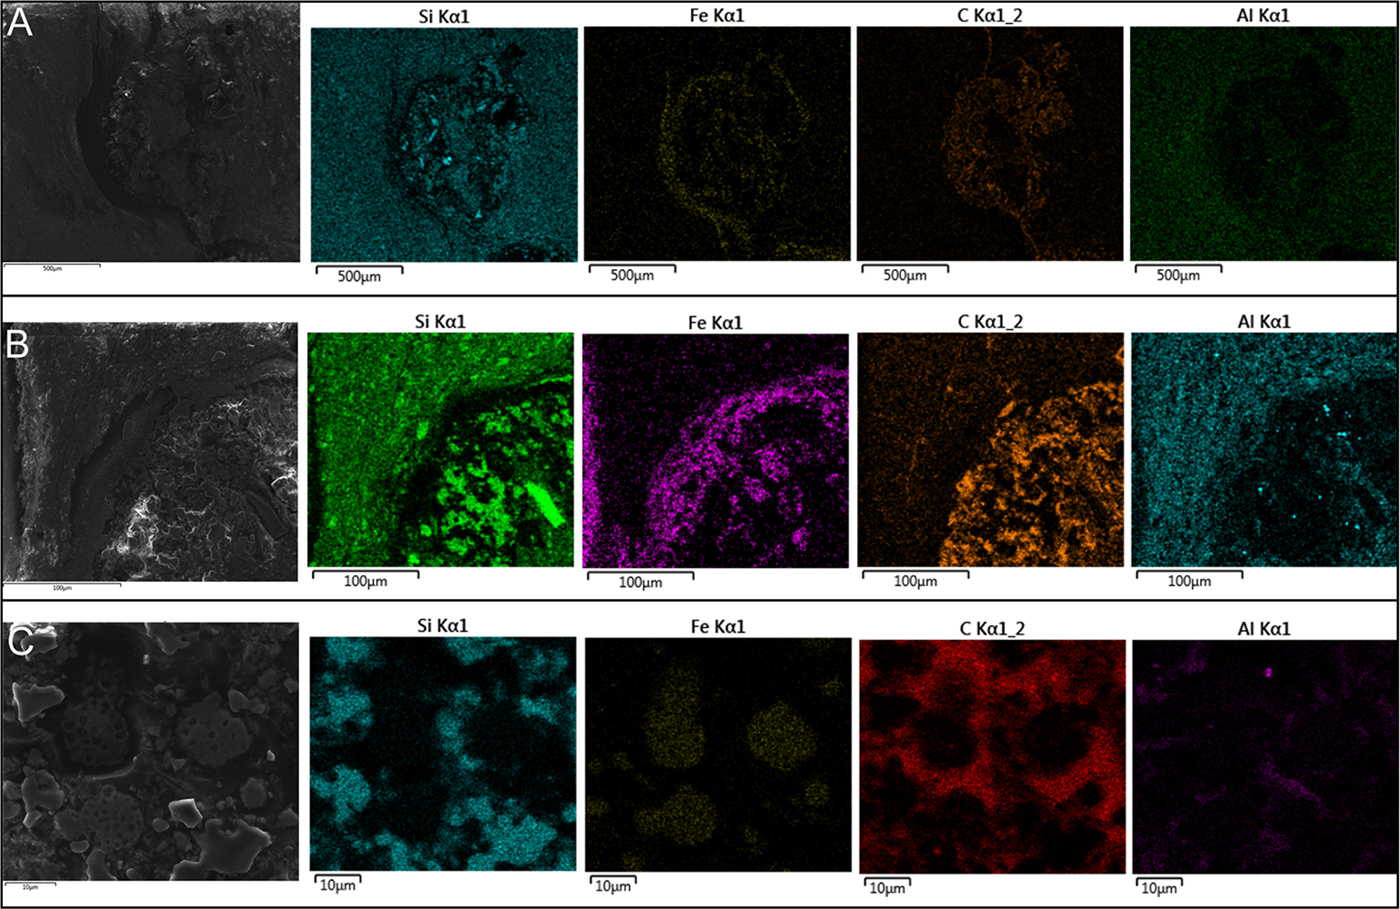
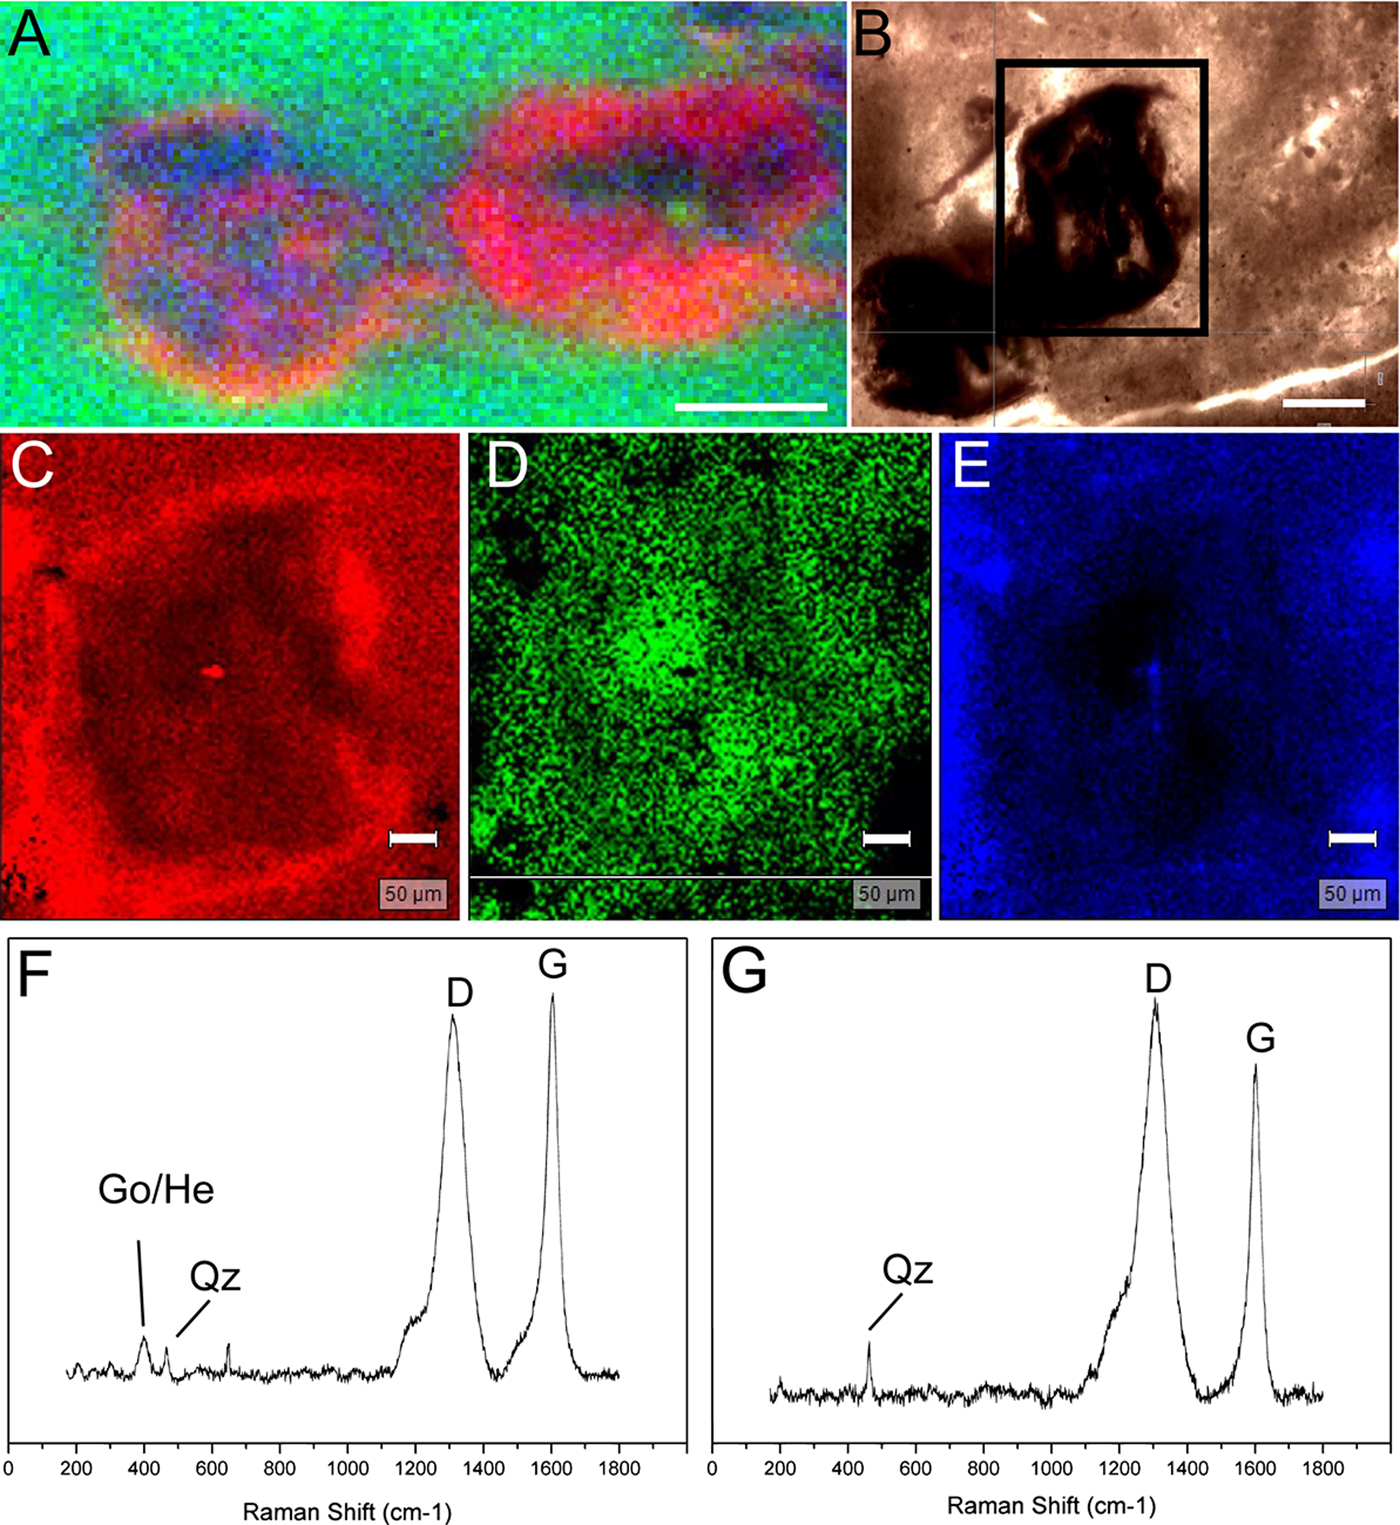
EDS data showed higher intensities of carbon in the ovoids (Fig. 6), while silicon and aluminum occurred mainly in determined portions with euhedral forms, corresponding to diagenetic crystals observed under light microscopy (Figs. 5 and 6). EDS and synchrotron radiation X-ray fluorescence (SR-XRF) mapping also showed greater intensities of iron in the borders of the ovoids (Figs. 6 and 7(a)). These signals correspond to the presence of pseudoframboids of pyrite, which are enriched in iron, while portions of these crystals are enriched in Si and C. Raman point and mapping results corroborated the EDS data, showing bands of kerogen and iron oxides (goethite or hematite) in the borders of the ovoids (Fig. 7(f)). These bands are also occasionally present in most internal portions of the structures, together with peaks indicative of quartz (Fig. 7(g)).
EDS mapping of the ovoidal structures. (a) Complete ovoid, with electron image and respective maps. (b) Edge of ovoid, with electron image and elemental maps. Note the association of Si with euhedric crystal. (c) Pseudoframboids in electron image, and its respective maps. Scales in the figure.
SR-XRF and Raman analysis of the ovoidal structures. (a) SR-XRF map showing the distribution of Fe (red), K (green) and Si (blue). (b) Specimen examined for Raman mapping (rectangle area). (c) Map of band in ~400 cm−1, representing iron oxides. (d) Map based on PCA results for D band of kerogen. (e) Map of quartz (~465 cm−1). (f) Point analysis of the edge region of an ovoid. (g) Point analysis of the internal portion of the ovoid. Obseve D and G bands of kerogen. Scales: 500 µm (a); 200 µm (b); 50 µm (c–e).
When applying the biogenicity criteria in the study of the ovoid structures, it is possible to observe that most criteria were contemplated. First, the Tamengo Formation is dated as late Ediacaran (ca. 542 M.a.; see Parry et al., Reference Parry, Boggiani, Condon, Garwood, Leme, McIlroy, Brasier, Trindade, Campanha, Pacheco, Diniz and Liu2017). In this period, a diverse range of multicellular organisms that could construct ovoidal submillimeter morphologies were already present, at least in some stage of their life cycles (Xiao and Laflamme, Reference Xiao and Laflamme2009). Second, the inclusion of the ovoids in the sedimentary matrix can be evidenced by the thin sections analysed through optic microscopy (Fig. 5), refuting the possibility of contamination, which is fairly usual in fossils processed by acid maceration (Traverse, Reference Traverse2007).
This aspect also links to the third criterion, which deals with the syndepositional aspect of the ovoids. Their subhorizontal disposition in some portions (Fig. 4) indicates that the spherule and the deposition of the fine-grained sediment could be almost coeval. This interpretation is also supported by the presence of bed deformations beneath some of the corpuscles (Fig. 5), suggesting that the spherules were, at least, concomitant to an unconsolidated substrate.
Regarding the size and morphology (fourth criterion), they can be compared directly with a wide range of organisms, as these spherules are millimetric and relatively ellipsoidal in shape (Figs. 4 and 5). Nevertheless, the lack of a clear pattern of cellular or tissue organization goes against a body fossil interpretation (e.g. embryos). Moreover, the spherule size distribution seems problematic by the absence of a normal distribution, which may be derived from the positive asymmetry (i.e. prevalence of smaller specimens). This issue may be the reflection of taphonomic processes that have taken place or simply by the methodological approach herein adopted. In the latter case, because the structures are tridimensional and vary with the bedding plane, it is possible that the rock splitting or thin sectioning influenced the real dimensions of the particles measured.
About the taphonomic variations (fifth criterion), the spherules exhibited a heterogeneous core with subdivisions (Fig. 5), with the presence of diagenetic crystals (Fig. 6) and opaque edges composed of iron oxides (Figs. 5–7). Although rare, particles without one or more of these traits can be found (Fig. 5(a) and (b)). This complexity can reject an abiogenic hypothesis that suggests a simple origin in the form of homogeneous mineral precipitation. Nevertheless, abiogenic complex structures have been already reported, such as the case of the Archean Apex Chert (Brasier et al., Reference Brasier, Antcliffe, Saunders and Wacey2015).
Lastly, Raman and EDS analyses indicate that the spherules are composed mainly of kerogen (Fig. 7(d), (f) and (g)) and carbon-rich compounds (Fig. 6), which are distributed throughout the structure. These results suggest an organic matter origin and contemplate the last criterion of biogenicity.
The presence of iron and pseudomorphs of pyrite framboids may indicate an anaerobic decay, which occurred via the metabolism sulphate-reducing bacteria (SRB). This activity results in high concentrations of hydrogen sulphides (H2S) in the organic surroundings (at the microenvironmental level) (Canfield and Raiswell, Reference Canfield and Raiswell1991). These molecules then react with the environmental iron ions (Fe2+), resulting in the formation of framboidal morphologies of pyrite. Posterior geological processes, such as weathering or leaching, can oxidize these minerals, turning them into iron oxides or oxyhydroxides. Perhaps this is the case of the Tamengo Formation shales, in which the weathering may have oxidized these framboids into iron oxides that form the edges and interior of the ovoids (Figs. 5–7). Notably, these diagenetic steps can also be found in other geologic units from different ages (see Becker-Kerber et al., Reference Becker-Kerber, Osés, Curado, Rizzutto, Rudnitzki, Romero, Onary-Alves, Benini, Galante, Rodrigues, Buck, Rangel, Ghilardi and Pacheco2017a).
In summary, the ovoidal structures satisfy almost all of the biogenicity criteria. However, this does not yet explain the origin of these structures. A possible answer may be based on the deformations observed beneath some ovoids (Fig. 5(c)) and the apparent interconnection of the aggregates in the vertical section (Fig. 4). Regarding the deformations of the laminations, these resemble those formed by gas/fluid escape structures, which can occur in unconsolidated sediments with the influence of microbial mats (e.g. McIlroy et al., Reference McIlroy, Crimes and Pauley2005; Menon et al., Reference Menon, McIlroy, Liu and Brasier2016). Interestingly, associated with the ovoids, we observed the presence of crenulated dark laminations (Fig. 5(c)), which can reflect the remains of ancient microbial mats. Other structures that are also related to the interaction of microbial constructions and substrates, such as fenestrae and gas bubbles, are slightly similar to the ovoidal forms reported here (e.g. Schieber et al., Reference Schieber, Bose, Eriksson, Banerjee, Sarkar, Altermann and Catuneanu2007; Noffke, Reference Noffke2010). Moreover, gas bubbles originated in microbial mats can be enriched in organic matter (Noffke, Reference Noffke2010).
In addition to a biogenic origin for the ovoidal material, it is likely that they also reflect the presence and influence of microbial mats in the shales of the Tamengo Formation.
Understanding biomineralization through time
The intrinsic relation between life and minerals can profoundly change a planet. Life uses and changes minerals, and minerals mold rocky planets.
Since their origin, biomineralizers have caused deep impacts in the biotic and abiotic realms on Earth (Lowenstam and Weiner, Reference Lowenstam and Weiner1989; Knoll, Reference Knoll2003). They participated in the establishment of carbonate platforms, induced important biogeochemical cycles, influenced sedimentation styles, interfered in the formation of different types of rocks and played an important role in ecological interactions and in the predator/prey coevolution (Vermeij, Reference Vermeij1989, Reference Vermeij2002; Cappellen, Reference Cappellen2003; Knoll, Reference Knoll2003; Warren et al., Reference Warren, Simões, Fairchild, Riccomini, Gaucher, Anelli, Freitas, Boggiani and Quaglio2013; Penny et al., Reference Penny, Wood, Curtis, Bowyer, Tostevin and Hoffman2014).
It is possible that environmental triggers also influenced biomineralization (Vermeij, Reference Vermeij1989; Knoll, Reference Knoll2003; Wood et al., Reference Wood, Ivantsov and Zhuravlev2017a). As a consequence of this interplay, biomineralization changed a world that, for almost 4 billion years, was dominated by organomineralization or inorganic precipitation to a world dominated by active biomineralization.
Biomineralization evolved at different times in distinct groups. The first evidence of biomineralization in animals appeared in the last evolutionary moment of the Ediacaran Period (ca. 551–541 Ma), a little earlier than the great metazoan radiation in the Cambrian (the so-called ‘Cambrian explosion’). It was one of the most paradigmatic events on Earth: larger creatures producing large amounts of biominerals, again resulting in other large-scale changes in the ocean geochemistry and biogeochemical cycles.
This first phase of animal biomineralization includes enigmatic organisms, such as Cloudina (Germs, Reference Germs1972; Grant, Reference Grant1990; Hofmann and Mountjoy, Reference Hofmann and Mountjoy2001; Hua et al., Reference Hua, Chen, Yuan, Zhang and Xiao2005; Zhuravlev et al., Reference Zhuravlev, Liñán, Vintaned, Debrenne and Fedorovet2012), Namacalathus (Grotzinger et al., Reference Grotzinger, Watters and Knoll2000; Zhuravlev et al., Reference Zhuravlev, Wood and Penny2015), Namapoikia (Wood et al., Reference Wood, Grotzinger and Dickson2002; Wood and Penny, Reference Wood and Penny2018), Sinotubulites (Chen et al., Reference Chen, Bengtson, Zhou, Hua and Yue2008; Cai et al., Reference Cai, Xiao, Hua and Yuan2015), Suvorovella (Wood et al., Reference Wood, Zhuravlev, Sukhov, Zhu and Zhao2017b) and possibly Corumbella (Pacheco et al., Reference Pacheco, Galante, Rodrigues, Leme, Bidola, Hagadorn, Stockmar, Herzen, Rudnitzki, Pfeiffer and Marques2015).
Although the biomineralization is well supported by petrographic and taphonomic data, the original mineralogy of these organisms is still disputed (see Porter, Reference Porter2010; Wood and Zhuravlev, Reference Wood and Zhuravlev2012; Pacheco et al., Reference Pacheco, Galante, Rodrigues, Leme, Bidola, Hagadorn, Stockmar, Herzen, Rudnitzki, Pfeiffer and Marques2015; Zhuravlev et al., Reference Zhuravlev, Wood and Penny2015; Becker-Kerber et al., Reference Becker-Kerber, Pacheco, Rudnitzki, Galante, Rodrigues and de Moraes Leme2017b; Pruss et al., Reference Pruss, Blättler, Macdonald and Higgins2018). Some criteria can be used for determining the original mineralogy, but few are strongly suggestive (Porter, Reference Porter2010). The most common criteria include the type and quality of preserved microstructures and their associated early diagenetic cements (e.g. Porter, Reference Porter2010; Zhuravlev et al., Reference Zhuravlev, Wood and Penny2015).
Nevertheless, paleometric techniques have been increasingly applied to create a better picture of the original mineralogy. For example, Chen et al. (Reference Chen, Bengtson, Zhou, Hua and Yue2008) detected greater intensities of Sr in the shells of Sinotubulites compared with the rock matrix, which suggests an original composition of aragonite. Similarly, Pruss et al. (Reference Pruss, Blättler, Macdonald and Higgins2018) showed that Cloudina and Namacalathus had skeletons of aragonite, based on calcium-stable isotopy.
Early biomineralizers – the view from the Tamengo Formation
Cloudina (Fig. 8(b)) is claimed to be one of the most common biomineralized metazoans from the late Ediacaran, but there is no consensus about its biological affinities. This animal produced its conic-tubular shells by the addition of funnel segments from a basal cone (Grant, Reference Grant1990; Hua et al., Reference Hua, Pratt and Zhang2003, Reference Hua, Chen, Yuan, Zhang and Xiao2005). It has been suggested that its skeleton was composed primarily of high-Mg calcite (Grant, Reference Grant1990; Zhuravlev and Wood, Reference Zhuravlev and Wood2008; Zhuravlev et al., Reference Zhuravlev, Liñán, Vintaned, Debrenne and Fedorovet2012), but it has recently been proposed that it was actually aragonitic (Pruss et al., Reference Pruss, Blättler, Macdonald and Higgins2018).
Corumbella GP/1E 4205 (a) and Cloudina GP/1E 6218 (b) from the Tamengo Formation.

On the other hand, Corumbella werneri is interpreted as belonging to Scyphozoa (Cnidaria) (Pacheco et al., Reference Pacheco, Galante, Rodrigues, Leme, Bidola, Hagadorn, Stockmar, Herzen, Rudnitzki, Pfeiffer and Marques2015). The skeleton of this metazoan is interpreted as an elongated polyhedral tube, with faces and lateral edges, rings interleafed in a midline, and a pyramidal geometry with a quadrangular cross-section (Babcock et al., Reference Babcock, Grunow, Sadowski and Leslie2005; Pacheco et al., Reference Pacheco, Galante, Rodrigues, Leme, Bidola, Hagadorn, Stockmar, Herzen, Rudnitzki, Pfeiffer and Marques2015).
Paleometric techniques (SR-XRF) applied on Cloudina from the Tamengo Formation revealed no differential Sr concentrations between the fossil and the matrix, suggesting a possible calcitic composition (Becker-Kerber et al., Reference Becker-Kerber, Pacheco, Rudnitzki, Galante, Rodrigues and de Moraes Leme2017b). However, given the uncertain diagenetic history of Sr, this still needs further verification. Recently, Pruss et al. (Reference Pruss, Blättler, Macdonald and Higgins2018) presented a new method for investigating the original mineralogy using δ44/40Ca isotope values, reinterpreting Cloudina skeletons as being composed primarily of aragonite. However, given the low resolution of the drilling area (203 µm) and the thinner shell wall of Cloudina (<50 µm), this method also needs further improvement.
Additional paleometric studies, using RS and SEM/EDS on Cloudina from the Tamengo Formation, also improved the investigation of other skeletogenesis and paleoecological aspects. For instance, Raman mapping has revealed greater intensities of kerogen in the shell of Cloudina, and Raman and EDS investigations revealed minerals associated with the tubes that could have been precipitated by microbial activity (Becker-Kerber et al., Reference Becker-Kerber, Pacheco, Rudnitzki, Galante, Rodrigues and de Moraes Leme2017b).
Concerning Corumbella (Fig. 8), whose skeleton has commonly been considered organic, new EDS data have demonstrated major intensities of calcium in the carapace compared with the surrounding rock matrix (Delgado et al., Reference Delgado, Buck, Osés, Ghilardi, Rangel and Pacheco2014; Pacheco et al., Reference Pacheco, Galante, Rodrigues, Leme, Bidola, Hagadorn, Stockmar, Herzen, Rudnitzki, Pfeiffer and Marques2015). However, it is still not fully understood what carbonate polymorph could have constituted its carapace, or even if the calcium is undoubtedly originally from the skeleton and not formed during the fossilization. Nevertheless, these results already show the importance of applying paleometric analysis to understanding these early and enigmatic skeletonized metazoans.
The informative value of the fossilization process
Geobiology is one of the key areas that aims to understand life/environment interactions. Sometimes we are able to access geobiological issues in the fossil record by means of fossil diagenesis, which comprises the physical and chemical processes to which organisms are subject after their final burial. During diagenesis, the environmental and biological characteristics interact, resulting in different types of fossilization (e.g. pyritization or silicification). Paleometric techniques have contributed very efficiently to access new data that lead us to interpretations and often comprehension and generalizations about the environmental and geobiological conditions in which the fossil diagenetic processes occurred.
Organisms may be preserved and subject to different sedimentary environments, but life may change sediments as well. The transformation of some types of clay minerals (e.g. the smectite-to-illite reaction) could take 2 weeks in the presence of the bacterium Shewanella oneidensis (Kim et al., Reference Kim, Dong, Seabaugh, Newell and Eberl2004). It is likely that illitization and other authigenic processes among clay minerals may mediate some events of exceptional fossilization. Moreover, it is even possible that the transformation of clay minerals during fossilization and decay may produce specific biosignatures. The role of microorganisms and decay in the fossilization process is not completely understood, but there are claims for detailed protocols in experimental taphonomy (cf. Briggs and McMahon, Reference Briggs and McMahon2016; Purnell et al., Reference Purnell, Donoghue, Gabbott, McNamara, Murdock and Sansom2018).
We know that Mars possess the same clay minerals as Earth. In addition, there is evidence of water there (Oresei et al., Reference Orosei, Lauro, Pettinelli, Cicchetti, Coradini, Cosciotti, Di Paolo, Flamini, Mattei, Pajola, Soldovieri, Cartacci, Cassenti, Frigeri, Giuppi, Martufi, Masdea, Mitri, Nenna, Noschese, Restano and Seu2018). Clay minerals and water represent an outstanding scenario to search for evidence of life and its epiphenomena.
In this part of the manuscript, we will explore how the data obtained by the means of the aplication of paleometric techniques on fossil samples from Brazil found support in the results of experimental approaches in taphonomy. The integrated approach and shared problems concerning the new ways of accessing and interpreting information make paleontology and astrobiology even closer. It may help to test hypotheses and provide some generalizations about fossil diagenesis and geobiology on Earth and other rocky planets and moons.
The exceptionally well-preserved fossils from the Crato Member (Early Cretaceous)
The Brazilian Crato Member (Santana Formation, Araripe Basin) comprises a succession of siliciclastic and carbonate rocks (Neumann, Reference Neumann1999), the latter well known as a plattenkalk that bears exquisitely preserved fossils. The limestone mud was deposited in a paleolake at the current location of the northeast of Brazil (particularly the Ceará state). This unity records a variety of plants, fish, pterosaurs, dinosaurs, turtles, insects and arachnids, among other groups (Martill et al., Reference Martill, Bechly and Loveridge2007). The exceptional preservation of soft tissue is a characteristic of the Santana Formation, which is a worldwide-known Konservat-Lagerstätten.
Here, we review the work of Osés et al. (Reference Osés, Petri, Becker-Kerber, Romero, de Almeida Rizzutto, Rodrigues, Galante, Silva, Curado, Rangel, Ribeiro and Pacheco2016) and Osés et al. (Reference Osés, Petri, Voltani, Prado, Galante, Rizzutto, Rudnitzki, Silva, Rodrigues, Rangel, Sucerquia and Pacheco2017), who tested hypotheses regarding the exceptional preservation in this outstanding fossil deposit. These authors focused on investigating patterns and processes of the pyritization of the soft tissues of insects and fish.
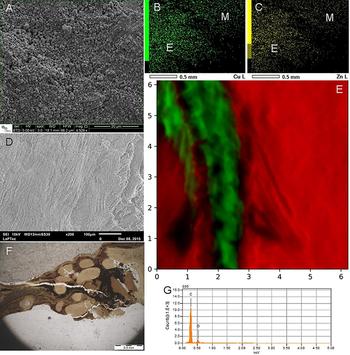
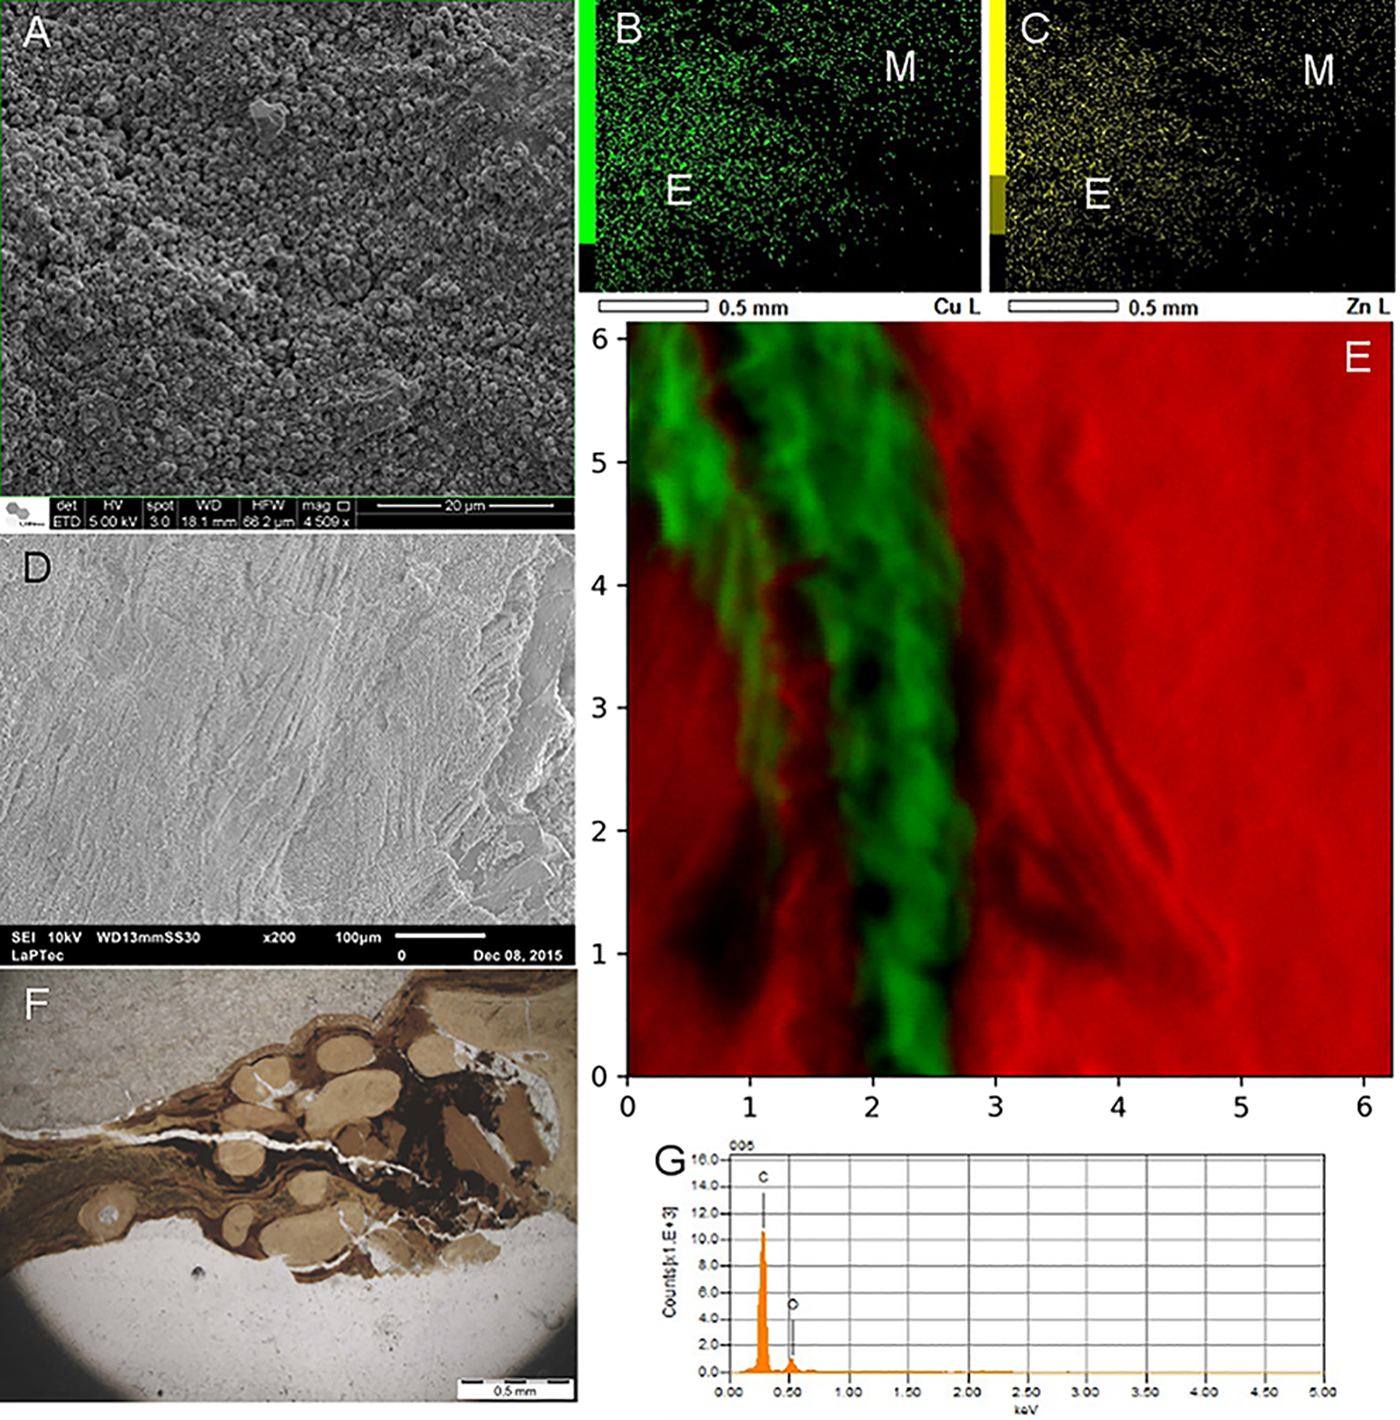
Energy-dispersive X-ray fluorescence (EDXRF), synchrotron radiation XRF with a microbeam (SR-μXRF) and EDS (Fig. 9) were applied to investigate the spatial distribution of chemical elements, comparing the rock matrix and fossils, as well as distinct parts of the fossils. The elemental characterization was complemented by micro-RS to identify the minerals that preserved the fossils – and preserved organic matter. Soft-tissue microinvestigations and the morphological characterization of minerals were performed by SEM (Fig. 9). Additionally, for the insects, the authors used both synchrotron-based soft X-ray spectroscopy (SR-SXS) for the quantitative detection of phosphorus and particle-induced X-ray emission (PIXE) for the elemental mapping of a whole sample (additional details regarding parameters and techniques can be found in Osés et al. (Reference Osés, Petri, Becker-Kerber, Romero, de Almeida Rizzutto, Rodrigues, Galante, Silva, Curado, Rangel, Ribeiro and Pacheco2016, Reference Osés, Petri, Voltani, Prado, Galante, Rizzutto, Rudnitzki, Silva, Rodrigues, Rangel, Sucerquia and Pacheco2017).
(a) Pseudomorphs after framboidal pyrite at fossil insect (GP/1E 7105) from the Crato Member. (b, c) EDS maps of Cu and Zn, respectively (E-exoskeleton; M-matrix), of an insect (GP/1E 8440). (d) SEM image depicting muscle fibres of a fossil fish (GP/2E 7786F) from the Crato Member. This specimen was preserved at the BL facies and has been pyritized. (e) Micro SR-XRF map of Ca (red-matrix) and Fe (green-fossil) of a sample of fossil fish (GP/2E 7786F) from the BL facies. Scale in mm. (f) Petrographic thin section (GP/L 17) of a fish (GP/2E 9666) from the GL facies. Note the skin (preserved scales) surrounding bones interconnected by kerogenized soft tissue (dark and banded areas). (g) EDS point spectrum of a kerogenized tissue area of a fossil fish (GP/2E 9666) from the GL facies.
Hypothesis 1: pyritization of insects by sulphate-reducing bacteria
The fossil insects are found to be three-dimensionally preserved, with even fine details and labile tissues still remarkably preserved. Osés et al. (Reference Osés, Petri, Becker-Kerber, Romero, de Almeida Rizzutto, Rodrigues, Galante, Silva, Curado, Rangel, Ribeiro and Pacheco2016) hypothesized that those insects from the Crato Member were pyritized by the activity of bacteria.
SEM analyses indicated that pseudomorphs (of goethite and hematite) of framboidal pyrite were the dominant microfabric (Fig. 9), which has replicated both cuticle and internal soft tissues. Additionally, SEM detected a structural entanglement of pseudoframboids and the remains of extracellular polymeric substances of bacteria. Such pseudomorphs displayed a size variation mirroring the original decay rate of distinct structures, as well as decay sequence of such structures (i.e. cuticle versus internal soft tissues). EDS, EDXRF, PIXE and micro-Raman further supported that such pseudoframboids, indeed, composed of goethite and hematite. Elemental data also revealed higher intensities of Fe, Zn and Cu in the fossils in comparison with the surrounding rock matrix (Fig. 9), which was interpreted as having been achieved by incorporation into chitin during its decay by heterotrophic bacteria. Thus, Osés et al. (Reference Osés, Petri, Becker-Kerber, Romero, de Almeida Rizzutto, Rodrigues, Galante, Silva, Curado, Rangel, Ribeiro and Pacheco2016) proposed that biofilms of SRBSRB had a central role in insect decay and mineralization (pyritization) in the Crato Member.
This interpretation is strongly supported by consecrated experimental approaches. It was already shown that biofilms can generate and control geochemical gradients and ion diffusion, resulting in organomineralization (Dupraz et al., Reference Dupraz, Reid, Braissant, Decho, Norman and Visscher2009). In another experiment, with shrimp remains, Sagemann et al. (Reference Sagemann, Bale, Briggs and Parkes1999) observed that geochemical gradients can be rapidly triggered by oxygen and pH decreases. In this condition, anaerobic bacterial decay leads to iron sulphide formation and soft-tissue preservation. Moreover, the observation of fresh pyrite framboids formed within microbialites revealed that biofilms indeed create a structural framework for framboid growth (Maclean et al., Reference MacLean, Tyliszczak, Gilbert, Zhou, Pray, Onstott and Southam2008).
Hypothesis 2: the same fish species display distinct types of preservation, which has been controlled by facies variation
Other interesting fossil is Dastible crandalli, a small fish preserved in beige and grey limestones (respectively, BL and GL) from the Crato Member. In a recent study (Osés et al., Reference Osés, Petri, Voltani, Prado, Galante, Rizzutto, Rudnitzki, Silva, Rodrigues, Rangel, Sucerquia and Pacheco2017), the authors tested the hypothesis that different microfacies, mirroring distinct depositional conditions, may have resulted in distinct modes of preservation for Dastilbe specimens.
The integration of data obtained by SEM, EDS, EDXRF, SR-μXRF and micro-RS analysis (Fig. 9) showed that two types of preservation do occur, i.e. pyritization and kerogenization. In fact, comparable with the diagenetic history of the fossil insects, fish have also undergone oxidation, so pyrite framboids have been pseudomorphized to hematite/goethite. The latter preserved 3D muscles, putative cell nuclei, tendons and eyes in the BL (Fig. 9). On the other hand, kerogenization favoured the preservation of the skin, connective tissues and generally compressed/distorted muscle fibres in the GL (Fig. 9). The fidelity of preservation is greater for the pyritized fish. Furthermore, the authors interpreted that the two facies were deposited at different rates, placing the carcasses in distinct biogeochemical zones. Based on this evidence, Osés et al. (Reference Osés, Petri, Voltani, Prado, Galante, Rizzutto, Rudnitzki, Silva, Rodrigues, Rangel, Sucerquia and Pacheco2017) proposed that the carcasses deposited in the BL remained for a long time at the zone of pyrite precipitation, while the fish buried in the GL underwent methanogenesis (and kerogen formation) in the methanic zone. A similar process was previously suggested in the investigation of a late Ediacaran lagerstätte (by Schiffbauer et al., Reference Schiffbauer, Xiao, Cai, Wallace, Hua, Hunter, Huifang, Peng and Kaufman2014). More broadly, Schiffbauer et al. (Reference Schiffbauer, Xiao, Cai, Wallace, Hua, Hunter, Huifang, Peng and Kaufman2014) and Osés et al. (Reference Osés, Petri, Voltani, Prado, Galante, Rizzutto, Rudnitzki, Silva, Rodrigues, Rangel, Sucerquia and Pacheco2017) showed that one can try to predict the type of preservation (a gradient in a continuum or pyritization and kerogenization) and the fidelity of preservation of a given fossil when it occurs at different facies.
New data from experiments
To better understand some aspects about the influence of the supply and the type of sediment on the processes of fossilization of fish carcasses, we present here some new data from two taphonomic experiments. In both experiments, we studied Anchoviella lepidentostele. This fish has an adequate size (small) comparable to that of other common fossil fishes from Brazil (such as Dastilbe). Furthermore, they can be obtained in sufficient quantities for experimental purposes.
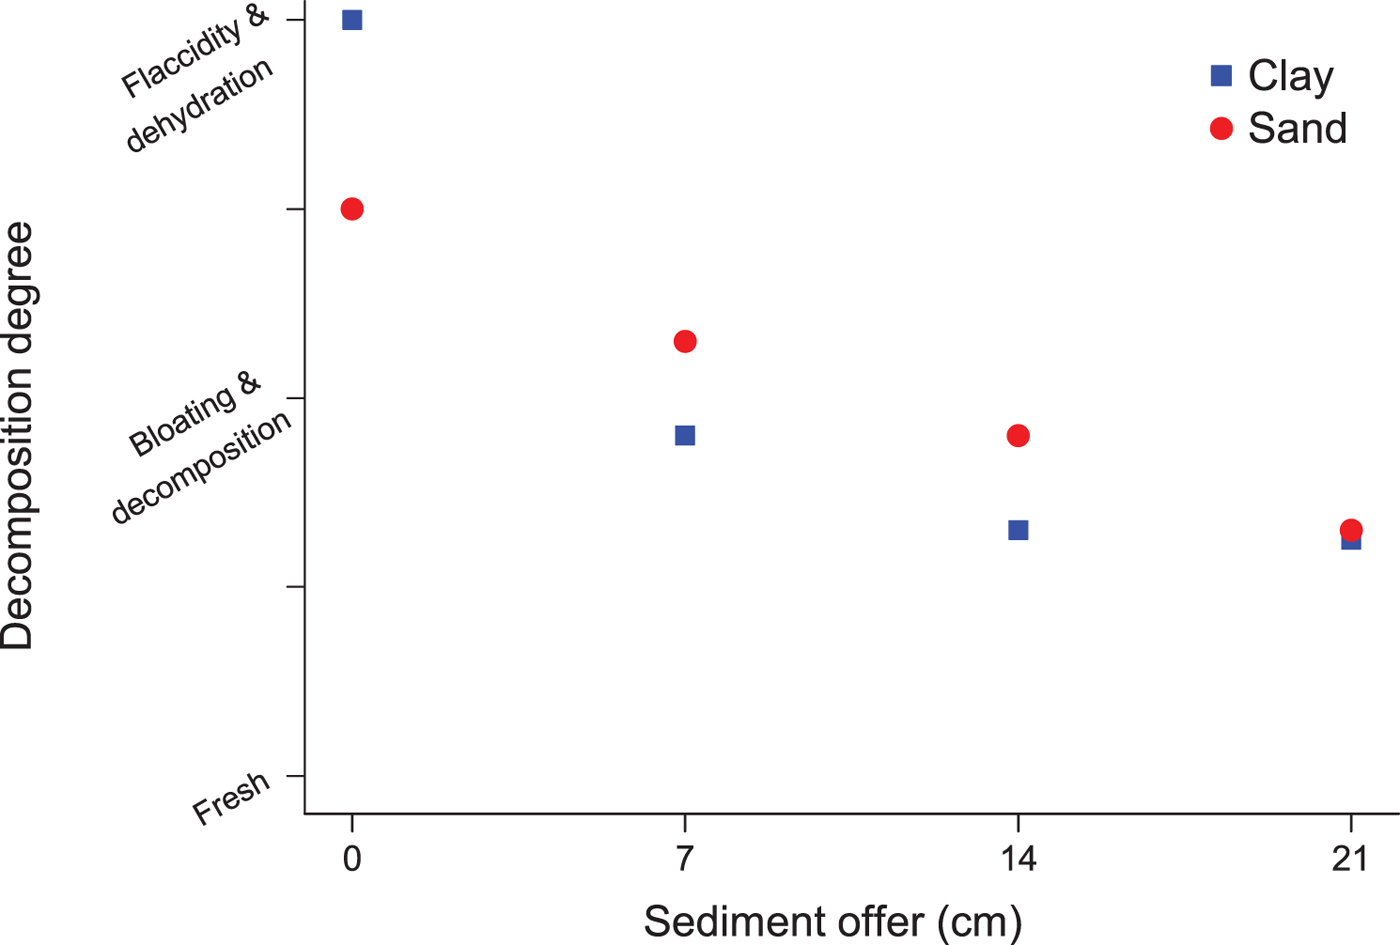
The first experiment (Supplementary information) aimed only to test the influence of the differential supply of sediment mass (sand and clay) on the preservation of Anchoviella specimens. All carcasses covered with a higher supply of sediment were better preserved. However, the preservation was shown to be more effective in clay, especially until depths of up to 14 cm (Fig. 10). From a 21 cm depth, the preservation became similar in sand and clay (Fig. 11).
Differences in the preservation of the eyes/crystalline lens (arrows) and operculum between distinct sediments and supplies. (a) 14 cm of sand. (b) 7 cm of clay. Better preservation occurred in clay even with less vertical supply of sediment. Scale bar: 1 cm.

Different stages of decomposition according to sediment type and quantity.
In the second experiment (Supplementary information), we tested the actions of different types of sediments (soil, sand and clay) in the preservation/decomposition of Anchoviella specimens. Among all the sediments, the clay promoted better preservation and integrity of soft parts and morphological structures. Despite that, we observed signs of flattening and disarticulation in some fishes from the clay experiments. We hypothesize a relation between carcass flattening and clay expansion by the absorption of water.
Recent works have demonstrated the great potential of carcass preservation by clay minerals. For example, the acid hydrolysis of clays generated during decomposition can increase the concentration of important ions in the microenvironment around the carcass, such as Al (Naimark et al., Reference Naimark, Kalinina, Shokurov, Boeva, Markov and Zaytseva2016). This could allow a better preservation degree through the sealing properties of aluminum, which acts on catalysing proteins and retards degradation (see Naimark et al., Reference Naimark, Kalinina, Shokurov, Boeva, Markov and Zaytseva2016).
Our results also find support in a model proposed by Raiswell et al. (Reference Raiswell, Bottrell, Al-Biatty and Tan1993). According to the authors, in anoxic contexts (which were nearly induced in our experiments), hydrogen sulphide could be intensely produced by the activity of SRB. These would react with available iron (and eventually could result in the precipitation of pyrite).
Hence, we hypothesize that more anaerobic conditions of acidification could slow down the decomposition processes in our experiment, together with the sealing properties of clay elements (but see Naimark et al., Reference Naimark, Kalinina, Shokurov, Boeva, Markov and Zaytseva2016 for additional explanations).
Another part of this experiment was dedicated to investigating the effects of early diagenesis on the fish bones. Thus, Raman spectra were obtained from the mandible and maxilla of the same fishes buried in sand, clay and soil.
It is known that bones have two main constituents: the mineral matrix, made by biopolar crystals of hydroxyapatite, and the organic part, composed largely of type I collagen (Weiner, Reference Weiner2008; Morris and Mandair, Reference Morris and Mandair2011). The spectra obtained in our study present bands characteristic of fresh bones (Fig. 12), but with variations in their relative intensity, depending on the type of sediment used. All spectra contain four bands corresponding to  ${\rm PO}_4^{3-} $ vibrations within the apatite range (ν1, ν2, ν3, ν4). The vibration at 960 cm−1, the most intense, is attributed to
 ${\rm PO}_4^{3-} $ symmetrical elongation (ν1).
Raman spectrum of fish bones rescued from different substrates. (a) Samples from 2 to 6 weeks. (b) 10–12 weeks.

It is noteworthy that the amide III, CH2 and amide I bands are better defined in bones rescued from clay (Fig. 12). Bones from carcasses buried in soil showed bands that were more poorly defined and less intense (Fig. 12), which may indicate protein loss (Mandair and Morris, Reference Morris and Mandair2011, Reference Mandair and Morris2015). Based on these results, it is possible to infer that the organic matter of the bones was still present and had some degree of preservation at the end of the experiment. It is well known that during diagenesis, bone collagen and lipids may be the first to decompose (Saager et al., Reference Saager, Balu, Crosignani, Sharif, Durkin, Kelly and Tromberg2015). These changes result in mature organic material, which relates to the loss of heteroatoms (N, S and O) and aliphatic carbon (hydrogen-rich). Our results point to the preservation of bands characteristic of aliphatic carbons, which are related to immature organic matter and collagen preservation (Saager et al., Reference Saager, Balu, Crosignani, Sharif, Durkin, Kelly and Tromberg2015).
Our spectral results in the C-H region (Fig. 13) presented overlapping bands (four identified bands) in different experimental conditions. The results of the region from 2800 to 3100 cm−1 presented four bands: ca. 2850 cm−1 (CH3), 2880 cm−1 (CH3), 2930 cm−1 (CH3) and 2980 cm−1 (CH). These bands are indicative of lipids and proteins.
Raman spectra of substrate samples from the fish experiment. (a) Spectrum from samples from 2 to 6 weeks. (b) 10–12 weeks. From top to bottom: spectra from soil (upper), clay (middle) and sand (bottom) indicating peaks at higher wavelengths, which may derive from the organic matter.

We also measured the full width at half maximum (FWHM) of  ${\rm PO}_4^{3-} $ to access the degree of crystallinity of the fish bones. The determination of the spectral variations of symmetric phosphate stretching (ν1), such as peak position and width, may indicate changes in the biogenic apatite composition and crystallinity (Nielsen-Marsh and Hedges, Reference Nielsen-Marsh and Hedges2000; Tütken et al., Reference Tütken, Vennemann and Pfretzschner2011; Trueman, Reference Trueman2013; Beasley et al., Reference Beasley, Bartelink, Taylor and Miller2014). Our results (Fig. 14) show no statistically significant variation in the FWHM increase, but it is possible to observe a relative increase in the crystallinity over time (Fig. 14). This can be the beginning of the early diagenetic alteration of the bones (retention of information – cf. Purnell et al., Reference Purnell, Donoghue, Gabbott, McNamara, Murdock and Sansom2018) during the fossilization process.
Measurements of FWHM of Raman PO₄3− bands from fish bones.

Final considerations and future perspectives
Fossils are preserved portraits of life over time. For centuries, paleontologists have sought to identify and describe organisms from such remote times by ordering them in the geological record. It is now known that, rather than flashes of moments of life on Earth, fossils are eloquent evidence of evolution. Now, with advances in sophisticated technologies and new concepts, it has become increasingly possible to obtain other information from the fossil record.
Fossils are not independent entities from rocks. We do not know if life on Earth originated in our planet. However, since the Earth's beginning, life and the planet coevolved. Hence, understanding how organisms were fossilized enables scientists to unlock data on previous environmental conditions, as well as adaptations and evolutionary tendencies. Furthermore, investigating the mineralization of carcasses – from microfossils (e.g. Xiao et al., Reference Xiao, Yuan, Steiner and Knoll2002) to animal soft tissues (e.g. Osés et al., Reference Osés, Petri, Becker-Kerber, Romero, de Almeida Rizzutto, Rodrigues, Galante, Silva, Curado, Rangel, Ribeiro and Pacheco2016, Reference Osés, Petri, Voltani, Prado, Galante, Rizzutto, Rudnitzki, Silva, Rodrigues, Rangel, Sucerquia and Pacheco2017) – yields a profound knowledge on the geobiological mechanisms and processes of interaction between microorganisms and rotten organisms. Therefore, for instance, understanding the resulting biases of decay/diagenesis on the microfossil morphology and geochemistry (e.g. elemental and biomarker variation during decay) can be of extreme help to one interested in applying those aspects to propose criteria for biosignatures and biogenicity.
In this context, systems paleobiology is another area that provides great insight into life/planet coevolution by means of studies that bring together experimental approaches and the informational value of the fossil record (Knoll, Reference Knoll2013). Thus, the role of emergency and environmental feedback and the revolution of ecosystem engineers in the great transformations of the biosphere, as well as the close relationship between possibilities and opportunities, has revealed unprecedented novelties in evolutionary change. All these phenomena (and epiphenomena) have been recognized as a result of life/environment interactions (Knoll, Reference Knoll2013; Sperling et al., Reference Sperling, Halverson, Knoll, Macdonald and Johnston2013; Judson, Reference Judson2017). This systemic approach can refine knowledge about the most remote origin(s) of life and the breadth of conditions and processes in which its metabolic, evolutionary and ecological evidence can be recognized and identified.
When we wonder if astrobiology should benefit from paleobiological frameworks (built from the investigation of fossils on Earth), we bumped into ‘so what?’ questions. Some of the answers follow:
(1) This new information will bring great improvements to the concepts of habitability;
(2) Then, we will have more clues, support and technology to model and extrapolate conditions for the establishment of life in other parts of the cosmos.
We understand that the diversity of life on Earth is a natural result of evolutionary processes. This does not mean that life is an inevitable phenomenon in other parts of the cosmos. The conceptual and methodological development of other areas of knowledge, such as paleobiology, will inevitably help to strengthen the structure of astrobiology as an emerging science. Understanding and reflecting on the limits and processes of our own biosphere (present and past) is to contribute to understanding the origin(s) of life in the cosmos.
Supplementary material
The supplementary material for this article can be found at https://doi.org/10.1017/S1473550418000538.
Author ORCIDs
Douglas Galante, 0000-0002-3265-2527
Acknowledgements
We are grateful for the financial support provided by CAPES/Brazil, for granting the master's degree grant from the social demand program, as well as the PhD grant. We also thank the Postgraduate Program in Biotechnology and Environmental Monitoring (Programa de Pós-graduação em Biotecnologia e Monitoramento Ambiental – PPGBMA) of UFSCar Sorocaba. We additionally thank Programa de Pós-Graduação em Ecologia e Recursos Naturais (UFSCar) and Programa de Pós-graduação em Geoquímica e Geotectônica, USP. The authors also acknowledge the Research Unit in Astrobiology at IAG-USP (NAP-Astrobio, PRP-USP) for providing research facilities to conduct the Raman spectroscopic analysis. The authors would like to thank LNLS/LNNano/CNPEM for technical support and for providing infrastructure, in particular for allowing the use of the XRF beamline (20150110 and 20171031) and the Scanning Microscope FEI Quanta 650 FEG under the Quanta-proposals (SEM-23684 and SEM-21836). We are also grateful to the Institute of Physics of USP and Laboratório de Plasmas Tecnológicos of UNESP-Sorocaba for allowing and making feasible the use of equipment and infrastructure. We also thank the laboratory technicians of the Department of Biology-UFSCar Sorocaba, Heidi Utsunomiya and Silas Príncipe, for their assistance and readiness during the experimental stages. We are especially thankful to Professor Dr Fabio Yamaji of the Programa de Pós-graduação em Ciência dos Materiais, UFSCar Sorocaba for making feasible the use of SEM/EDS. The authors also thank Professor Dr George T. Mattox (UFSCar-Sorocaba) and Professor Dr Arkley Marques Bandeira (UFMA) for providing helpful suggestions on previous versions of the manuscript. Furthermore, the authors are grateful to Gilmar Kerber for all his help in the field and to Manuel Pacheco Junior for his help in transporting samples. Finally, the authors are grateful for the financial support from the São Paulo Research Foundation (FAPESP–process numbers 2009/02312-4; 2016/01827-4; 2016/06114-6; 2016/17219-3 and 2017/21584-1) and CNPq for PIBIC grants. Part of the microCT images were provided by experiments performed on the ID19 beamline at the European Synchrotron Radiation Facility (ESRF), Grenoble, France. We are grateful to a local contact at the ESRF for providing assistance in using the beamline ID19. Parts of this research were carried out at the light source Doris III at DESY, a member of the Helmholtz Association (HGF). We would like to thank Dr Marco Stockmar for help with the microCT processing. We also acknowledge the technical help of Esthella F. Silva, Laís C. Rodrigues, Mariana S. Coelho and Vivian T. Caneto during our analysis.