Introduction
For the past quarter-century, there has been considerable debate concerning whether depression is a dimensional or categorical construct. Proponents of a dimensional perspective suggest that ‘clinical’ depression represents elevation on continua of depressive symptom severity (e.g. Flett et al. Reference Flett, Vredenburg and Krames1997). Proponents of a categorical perspective maintain that clinical depression is discontinuous from normal functioning and subsyndromal conditions (e.g. Coyne, Reference Coyne1994). This debate has been fueled in part by the importance of the latent structure of depression for research and assessment. Although the prevailing psychiatric diagnostic system (DSM-IV; APA, 1994) has taken a categorical perspective, the preponderance of empirical research has supported a dimensional model. In addition to research demonstrating the continuity of depressive symptoms and correlates among individuals varying in their diagnostic classification or degree of depressive severity (reviewed in Flett et al. Reference Flett, Vredenburg and Krames1997), taxometric methods (Waller & Meehl, Reference Waller and Meehl1998) have been employed to directly test whether depression is categorical or dimensional.
A number of taxometric studies have suggested that there are no discontinuities in the latent structure of depression (e.g. Ruscio & Ruscio, Reference Ruscio and Ruscio2000, Reference Ruscio, Zimmerman, McGlinchey, Chelminski and Young2002; Franklin et al. Reference Franklin, Strong and Greene2002; Hankin et al. Reference Hankin, Fraley, Lahey and Waldman2005; Prisciandaro & Roberts, Reference Prisciandaro and Roberts2005; Slade & Andrews, Reference Slade and Andrews2005). For example, Prisciandaro & Roberts (Reference Prisciandaro and Roberts2005) conducted a taxometric analysis of unipolar depression using structured diagnostic interview data (Composite International Diagnostic Interview, CIDI; Robins et al. Reference Robins, Wing, Wittchen, Helzer, Babor, Burke, Farmer, Jablenski, Pickens, Regier, Sartorius and Towle1988) in a large community sample (National Comorbidity Survey, NCS; Kessler, Reference Kessler2002a) and found that depression is best characterized by a dimensional structure. Alternatively, several taxometric studies have found evidence for categorical structures of depression (e.g. Solomon et al. Reference Solomon, Ruscio, Seeley and Lewinsohn2006; Ruscio et al. Reference Ruscio, Zimmerman, McGlinchey, Chelminski and Young2007), depression-related constructs (e.g. ‘Involuntary Defeat Syndrome’; Beach & Amir, Reference Beach and Amir2006) and subtypes of depression (e.g. Haslam & Beck, Reference Haslam and Beck1994; Ambrosini et al. Reference Ambrosini, Bennett, Cleland and Haslam2002). Given these mixed findings, research is needed to corroborate previous taxometric findings using traditional methods of construct validation to ensure that results were not artifactual (e.g. determined by distributional properties of the data; Watson, Reference Watson2003).
One approach to evaluating the validity of past taxometric studies would be to compare the relative abilities of dimensional and categorical models of depression to predict theoretically related constructs. If depression is a dimensional construct, then dimensional models should demonstrate superior predictive validity relative to categorical models because of the loss of statistical power associated with dichotomizing a truly continuous variable (Cohen et al. Reference Cohen, Cohen, West and Aiken2002). However, if depression is a categorical construct, then categorical models should demonstrate superior ability to predict related constructs because the additional variability provided by the latter would reflect measurement error that reduces statistical power (Ruscio et al. Reference Ruscio, Haslam and Ruscio2006). Aggen et al. (Reference Aggen, Neale and Kendler2005) used a similar approach to evaluate the relative predictive abilities of a liability scale of depressive symptoms and diagnoses of depression. They found that diagnoses did not significantly predict neuroticism and future depressive episodes once the dimensional model was statistically accounted for, and that the dimensional model provided more precise estimates of parameters in twin models.
The present study was designed to examine the construct validity of the dimensional results in the Prisciandaro & Roberts (Reference Prisciandaro and Roberts2005) taxometric study by evaluating the relative predictive abilities of categorical and dimensional models of depression in the NCS. In part I of the present study, categorical and dimensional models of depression were empirically derived from the NCS data. In part II, the empirically derived models (along with a pair of rationally selected categorical and dimensional models) were compared in terms of their abilities to predict variance in clinically relevant constructs.
Part I – Method
Sample and measure
The NCS (Kessler et al. Reference Kessler, McGonagle, Zhao, Nelson, Hughes, Eshleman, Wittchen and Kendler1994) obtained a stratified probability sample of the United States population (n=8098) and administered a structured diagnostic interview, the CIDI (Robins et al. Reference Robins, Wing, Wittchen, Helzer, Babor, Burke, Farmer, Jablenski, Pickens, Regier, Sartorius and Towle1988), which included an assessment of participants' depressive symptoms according to DSM-III-R criteria (APA, 1987). Inter-rater reliability of depressive symptoms in the CIDI has been found to be satisfactory (κ's ranged from 0.69 to >0.90; Wacker et al. Reference Wacker, Battegay, Muellejans, Schloesser, Stefanis, Rabavilas and Soldatos1990; Wittchen, Reference Wittchen1991). Test–retest and inter-rater reliabilities of diagnoses of depressive disorders were also good (κ=0.71 and 0.95, respectively; Wittchen, Reference Kessler, McGonagle, Zhao, Nelson, Hughes, Eshleman, Wittchen and Kendler1994). Concordance between CIDI and Structured Clinical Interview for DSM-III-R (Spitzer et al. Reference Spitzer, Williams, Gibbon and First1992) diagnoses of major depressive episodes (MDEs) were acceptable (κ=0.53; Kessler et al. Reference Kessler, Wittchen, Abelson, McGonagle, Schwarz, Kendler, Knäuper and Zhao1998).
Indicators of unipolar depression were drawn from the section of the CIDI that asked participants to report symptoms of depression from a 2-week period of their lives when they experienced some degree of symptomatology. A subsample of the NCS was used for the present study because only participants who reported the lifetime experience of three or more co-occurring depressive symptoms (including either sad mood or anhedonia) were administered this section of the CIDI. The binary depressive symptom items from the CIDI were aggregated into the nine DSM diagnostic symptoms of an MDE [depressed mood, diminished interest or pleasure (‘anhedonia’), appetite or weight loss or gain (‘weight disturbance’), insomnia or hypersomnia (‘sleep disturbance’), psychomotor agitation or retardation (‘psychomotor disturbance’), fatigue or loss of energy (‘fatigue’), feelings of worthlessness or guilt (‘worthlessness/guilt’), impaired concentration or indecisiveness (‘concentration/indecisiveness’), recurrent thoughts of death or suicide, suicide plan, or attempt (‘suicidality’); APA, 1987] according to the NCS diagnostic algorithm (Zhao et al. Reference Zhao, Kessler and Wittchen1994). This algorithm required that affirmatively coded symptoms were not ‘due entirely to medications, drugs, alcohol, physical illness or injury’. The final sample (n=2803) contained more females than males (59.1% v. 40.1%), was predominantly White (79.8%; 8.8% Black, 8.5% Hispanic and 2.9% other), ranged in age from 15 to 58 years, with a mean age of 33.9 years (s.d.=10.2 years), and had a 51.7% diagnostic base rate of MDEs.
Analytic strategy
Latent structure analyses were conducted to empirically derive categorical (via latent class analysis) and dimensional (via factor analysis) models from the data. All analyses incorporated appropriate NCS sample weights (Kessler et al. Reference Kessler, McGonagle, Zhao, Nelson, Hughes, Eshleman, Wittchen and Kendler1994). The selected sample was randomly divided into two subsamples (n 1=1402, n 2=1401). Missing data were negligible (<2%) and were list-wise deleted. Structural analyses were conducted using Mplus version 5.1 (Muthén & Muthén, Reference Muthén and Muthén2007).
Factor analyses
Exploratory factor analysis (EFA) models were estimated in the first subsample from the tetrachoric correlation matrix of the nine dichotomous depressive symptom items using robust weighted least-squares estimation (WLSMV; Muthén, Reference Muthén2004). Parallel analysis (Horn, Reference Horn1965) was conducted using 1000 sets of random data (O'Connor, Reference O'Connor2000). Factor models were rotated using a promax (oblique) rotation method (Preacher & MacCallum, Reference Preacher and MacCallum2003). The obtained EFA model was used to construct a confirmatory factor analysis (CFA) model in the second subsample using WLSMV estimation. Each symptom item was loaded on the factor on which it had the highest loading in the EFA; cross-loadings were included if secondary loadings in the EFA exceeded 0.32 (Comrey & Lee, Reference Comrey and Lee1992), and factors were free to co-vary. CFA analyses incorporated information regarding the stratification and clustering of the NCS data (Muthén, Reference Muthén2004). Model fit was evaluated according to established standards [comparative fit index (CFI) >0.95, Tucker–Lewis index (TLI) >0.95, root mean square error of approximation (RMSEA) <0.05; Hu & Bentler, Reference Hu and Bentler1999]. An approximate χ2 difference test (known as DIFFTEST; Muthén, Reference Muthén2004) was conducted to evaluate whether the final CFA model provided better fit to the data than a more parsimonious one-factor model.
Latent class analyses
Latent class analysis (LCA) models were estimated in the first subsample from the nine depressive symptom items using maximum likelihood estimation (Muthén, Reference Muthén2004). LCA analyses incorporated information regarding the stratification and clustering of the data (Muthén, Reference Muthén2004). LCA models with varying numbers of latent classes were estimated, and the model with the lowest Bayesian information criteria (BIC) was selected as the best-fitting model (Nylund et al. Reference Nylund, Asparouhov and Muthén2007). The magnitudes of differences in BIC between models were interpreted using descriptive guidelines (Raftery, Reference Raftery, Bollen and Long1993) that can be applied to non-nested models as rough rules of thumb (AE Raftery, personal communication, 7 December 2006). A 0- to 4.6-point difference provides ‘weak’ evidence in favor of the model with the smaller BIC; a 4.6- to 9.2-point difference provides ‘strong’ evidence; and a difference of greater than 9.2 provides ‘conclusive’ evidence. This procedure was repeated in the second subsample to evaluate the robustness of the best-fitting LCA model.
Part I – Results and Discussion
Factor analyses
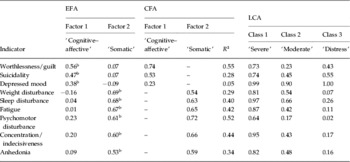
Parallel analysis suggested that up to two factors should be extracted from the data [research data's eigenvalues=3.426, 1.316, 1.070; random data's mean (95th percentile) eigenvalues=1.123 (1.158), 1.083 (1.109), 1.052 (1.074)]Footnote 1Footnote †. Thus, a two-factor model was estimated. Loadings are presented in Table 1. The first factor was marked by ‘cognitive–affective’ items (e.g. depressed mood, worthlessness/guilt). The second factor was marked by ‘somatic’ items (e.g. weight disturbance, fatigue) and anhedonia. Factors were correlated (r 2=0.40) and the fit of the model was good (RMSEA=0.03). The two-factor CFA model constructed from these findings provided acceptable fit to the second subsample data (χ2=39.71, df=14, p<0.001, CFI=0.94, TLI=0.94, RMSEA=0.02). All factor loadings were statistically significant (mean loading=0.59, mean R 2=0.37) (See Table 1). Factors were correlated (r 2=0.52). Finally, the two-factor model provided a superior fit to the data than a unidimensional model (Δχ2=29.21, df=1, p<0.001)Footnote 2.
EFA and CFA factor loadings and R2 values, and LCA item response probabilities for the nine DSM criteria of a major depressive episodeFootnote a

EFA, Exploratory factor analysis; CFA, confirmatory factor analysis; LCA, latent class analysis; Severe, severe depression; Moderate, moderate depression; Distress, cognitive–affective distress.
a EFA and LCA results are from subsample 1 of the data (n=1402). CFA results are from subsample 2 (n=1401).
b EFA factor loadings >0.32.
Latent class analyses
Comparison of BIC values from two- (BIC=14 645.38), three- (BIC=14 585.25) and four- (BIC=14 625.53) class LCA models provided ‘conclusive’ evidence for the three-class model's superior relative fit in the first subsample of data. Item response probabilities are presented in Table 1. Class 1 (n=362, ‘severe depression’) consisted of individuals with uniformly high response probabilities across all symptoms (mean probability=0.84) and class 2 (n=719, ‘moderate depression’) consisted of individuals with moderate response probabilities (mean probability=0.48). Of individuals assigned to the ‘severe depression’ class, 98% were diagnosed with an MDE, in contrast to 44% of those assigned to ‘moderate depression’. Class 3 (n=321, ‘cognitive–affective distress’) consisted of individuals with higher response probabilities for the ‘cognitive–affective’ symptoms of depression than class 2 (mean probability=0.63 v. 0.53) but with uniformly low response probabilities for the ‘somatic’ symptoms (mean probability=0.13). Less than 1% of individuals assigned to the ‘cognitive–affective distress’ class were diagnosed with an MDE. Because item response probabilities appeared roughly ordered across classes, a three-class discrete metrical model (Markon & Krueger, Reference Markon and Krueger2006) was estimated, with classes ordered in terms of depressive severity (Croon, Reference Croon, Hagenaars and McCutcheon2002). Despite the apparent ordering of response probabilities, the nominal three-class LCA model (BIC=14 585.25) demonstrated ‘conclusive’ evidence for superior fit to the three-class discrete metrical model (BIC=14 605.00). In the second subsample, the three-class (BIC=14 811.81) LCA model again demonstrated conclusive evidence for superior fit to the two- (BIC=14 913.01) and four- (BIC=14 837.14) class models. Furthermore, the three-class LCA model (BIC=14 811.81) again demonstrated ‘conclusive’ evidence for superior fit to the three-class discrete metrical model (BIC=14 890.76).
Part II – Introduction
Part II of the present study investigated the relative abilities of dimensional and categorical models of depression to predict variance in clinically relevant constructs. Two sets of model comparisons were made across outcomes: (1) Between the empirically derived models from part I; and (2) between rationally selected models. For a dimensional model, we created a single additive scale with each depressive symptom contributing 1 point. For a categorical model, we chose the pre-eminent diagnostic model of depression: DSM major depressive disorder (MDD).
Two types of outcomesFootnote 3 were selected: psychiatric diagnoses and impairment. Psychiatric diagnoses were selected because approximately 75% of individuals with lifetime MDD meet diagnostic criteria for at least one other psychiatric disorder (Kessler et al. Reference Kessler, Berglund, Demler, Jin, Koretz, Merikangas, Rush, Walters and Wang2003) and because the NCS was expressly designed to accurately estimate the prevalence of psychiatric diagnoses. Impairment outcomes were selected because MDD is a pervasively impairing disorder associated with divorce (Wade & Cairney, Reference Wade and Cairney2000), college dropout (Kessler et al. Reference Kessler, Foster, Saunders and Stang1995), health problems (Sullivan et al. Reference Sullivan, LaCroix, Russo and Walker2001) and suicide (e.g. Isomestä et al. Reference Isometsä, Henriksson, Hillevi, Kuoppasalmi and Lönnqvist1994).
The main criterion used to evaluate the models' relative predictive abilities was whether the categorical model significantly predicted unique variance in a given outcome when the dimensional predictor was simultaneously considered (and vice versa).
Part II – Method
Sample and measure
Analyses involving outcomes from the first stage of the NCS used the selected sample described in part I. Analyses involving second-stage NCS variables used a further reduced subsample (maximum n=2609) (Kessler et al. Reference Kessler, Davis and Kendler1997). An additional NCS sample weight was used to adjust for participants' unequal probability of being selected into the second stage.
The empirically derived dimensional model from part I was represented as two continuous variables in part II by computing factor scores from the final two-factor CFA model. The three-class LCA model in part I was represented as two binary contrast variables in part II by computing participants' category membership from the final LCA model, and by subsequently dummy-coding category membership with the ‘severe depression’ class as the reference. ‘Severe depression’ was chosen as the reference class because it was the most well known of the classes, as 98% met criteria for MDE. The rationally selected dimensional model was a single additive scale with each depressive symptom contributing 1 point. The rationally selected categorical model of depression was lifetime DSM-III-R diagnoses of MDEs derived from the NCS diagnostic algorithm based on the same 2-week symptom data used for the dimensional models.
Outcome variables
Psychiatric diagnoses were assigned on a lifetime basis and were coded ‘0’=absent, ‘1’=present. DSM-III-R hierarchy rules were observed. To reduce diagnostic outcomes, Krueger's (Reference Krueger1999) dimensional model of common mental illnesses was estimated using CFA, and the resulting two factors (internalizing and externalizing disorders) were used as outcomes in the present study. Agoraphobia, generalized anxiety disorder, panic disorder, simple phobia and social phobia were loaded on the ‘internalizing’ factor; alcohol dependence, antisocial personality disorder and drug dependence were loaded on the ‘externalizing factor’. Factors were free to co-vary.
Role impairment-related variables included: ‘interference with activities’ [‘How much did your period(s) of feeling (sad and/or uninterested) ever interfere with your life or activities?’ (‘1’, not at all to ‘4’, a lot)]; and ‘social and work impairment’ [‘Was any period of feeling (sad and/or uninterested) so bad that it kept you from working or from seeing friends or relatives?’ (‘0’=no, ‘1’=yes)]. Treatment-seeking variables included: ‘mental health professional’ [‘Did you ever … see (a psychiatrist, psychologist, social worker, or counselor) for problems with your emotions or nerves or your use of alcohol or drugs?’ (‘0’=no, ‘1’=yes)]; ‘psychiatric hospitalization’ [lifetime overnight admission to a hospital or admission to a hospital emergency department for help with ‘emotions or nerves’ or ‘use of alcohol or drugs’ (‘0’=no, ‘1’=yes)]; and ‘psychiatric medications’ [‘In the past 12 months, did you take any of the following …: sedatives, anti-depressants, tranquilizers, stimulants, painkillers, or anti-psychotics; under the supervision of a doctor, for your emotions or nerves or your use of alcohol or drugs?’ (‘0’=no, ‘1’=yes)]. Two latent factors were estimated from these variables using CFA: (1) ‘role impairment’ and (2) ‘treatment-seeking’. The resulting factors were used as outcomes.
Analytic strategy
Factor analyses
As described above, Krueger's (Reference Krueger1999) two-factor model was estimated for diagnostic outcomes using CFA, whereas separate unidimensional models were estimated for ‘role impairment’ and ‘treatment-seeking’ outcomes. CFA analyses incorporated the NCS sample weight as well as information regarding the stratification and clustering of the data (Muthén, Reference Muthén2004). Model fit was evaluated according to established standards (CFI>0.95, TLI>0.95, RMSEA<0.05; Hu & Bentler, Reference Hu and Bentler1999). Outcomes were derived from the above CFA models by computing factor scores from each model for all participants.
Regression analyses
Regression models were estimated using the %sregsub macro (SAS Institute, Inc., 2002) in SAS version 9.1.3 (SAS Institute Inc., Cary, NC, USA), which allows for the analysis of a subpopulation of complex survey data and includes information regarding the weighting, stratification and clustering of the data. Separate set-wise regression models were conducted for each of the four outcome variables (role impairment, treatment-seeking, internalizing and externalizing). Step 1 included either a set of dimensional variables or a set of categorical variables, whereas step 2 added the set of variables not represented in step 1 (e.g. the categorical variables would be added at step 2 if the dimensional variables had been included at step 1). The improvement in model fit at step 2 (represented by ΔR 2 and assessed with an F test) represents the degree to which one model of depression (e.g. categorical) provided unique predictive validity beyond that of the alternate model (e.g. dimensional). Additionally, it was of interest to determine which depression variables provided unique contributions to the prediction of outcome variables as reflected in the β values at step 2. Separate Bonferroni corrections were applied to significance tests of ΔR 2 and β's to control experiment-wise α inflation. With a desired α of 0.05 for each type of test, Bonferroni corrections suggested an α of 0.002 (0.05/32) for ΔR 2 tests and an α of 0.001 (0.05/48) for tests of β values. However, all results are reported at an α of 0.001 for simplicity given that all ΔR 2 tests that were significant at α=0.002 were also significant at α=0.001. Missing data were negligible (<2%) and were list-wise deleted.
Part II – Results and Discussion
Factor analyses
Krueger's (Reference Krueger1999) model of mental illnesses provided good fit to the data (χ2=25.92, df=9, p<0.01, CFI=0.96, TLI=0.96, RMSEA=0.02). All factor loadings were statistically significant (mean loading=0.69, mean R 2=0.49). The role impairment CFA model was just identified and therefore had perfect fit to the data. Factor loadings were statistically significant (mean loading=0.75, mean R 2=0.57). Finally, the treatment-seeking CFA model also provided perfect fit to the data. Factor loadings were statistically significant (mean loading=0.72, mean R 2=0.52).
Regression analyses
Empirically derived models
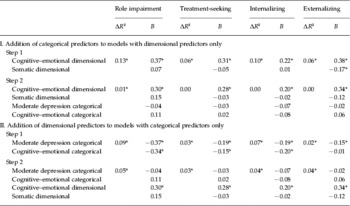
Results regarding the empirically derived models' abilities to predict psychiatric diagnoses are presented in Table 2. As can be seen in the top half of this table, the inclusion of the latent class contrasts at step 2 was not statistically significant in the case of treatment-seeking, internalizing or externalizing. In other words, the categorical variables did not lead to a statistically significant increase in R 2 compared with a model that only included dimensional predictors. Furthermore, none of the latent class contrasts provided statistically significant unique contributions to the prediction of any of the outcome variables after accounting for the dimensional variables. On the other hand, the inclusion of the latent class contrasts at step 2 made a statistically significant contribution to the prediction of role impairment. However, this contribution was very small in magnitude (R 2 change=0.01) and neither of the latent class contrasts made a statistically significant unique contribution after controlling for the dimensional predictors.
Multiple regression analyses with empirically derived dimensional or categorical models of depression alone predicting four outcomes, followed by analyses with both models of depression simultaneously predicting outcomesFootnote a

Internalizing, Internalizing disorders; Externalizing, externalizing disorders; ΔR 2, change in proportion of variance accounted for; B, unstandardized regression coefficient.
a Categorical predictors were dummy coded such that the ‘severe depression’ class was the reference group (‘0’) for each contrast.
* p<0.001.
As can be seen in the bottom half of Table 2, the inclusion of the latent dimensional variables at step 2 led to a statistically significant increase in R 2 in the case of all four outcome variables. Furthermore, the dimensional cognitive–affective symptoms variable made unique contributions to the prediction of all four outcome variables after controlling for the contributions of the latent class contrasts.
Rationally selected models
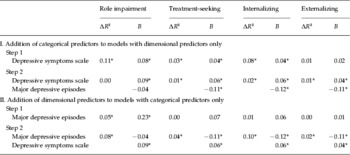
Results regarding rationally selected models' abilities to predict psychiatric diagnoses are presented in Table 3. As can be seen in the top half of this table, the inclusion of MDE at step 2 was statistically significant in the case of treatment-seeking, internalizing and externalizing. In other words, MDE made a statistically significant contribution to the prediction of these outcomes controlling for the dimensional symptom count. However, the negative β values indicate that MDEs were associated with less treatment-seeking, internalizing symptomatology and externalizing symptomatology adjusting for severity of depressive symptoms. These effects appear to be the result of statistical suppression as discussed below. In contrast, the inclusion of MDE at step 2 was not statistically significant in the case of role impairment.
Multiple regression analyses with rationally selected dimensional or categorical models of depression alone predicting four outcomes, followed by analyses with both models of depression simultaneously predicting outcomes

Internalizing, Internalizing disorders; Externalizing, externalizing disorders; ΔR 2, change in proportion of variance accounted for; B, unstandardized regression coefficient.
* p<0.001.
As can be seen in the bottom half of Table 3, the inclusion of the dimensional symptom count at step 2 was statistically significant with each of the four outcome variables. Higher depressive symptomatology was associated with greater role impairment, treatment-seeking, internalizing symptomatology and externalizing symptomatology adjusting for the presence or absence of MDE.
In summary, the latent dimensional models of depression consistently demonstrated superior predictive validity relative to the latent categorical models.
Overall discussion
The results from the present study uniquely inform the continuity debate in the depression literature by testing the construct validity of a previous taxometric analysis (Prisciandaro & Roberts, Reference Prisciandaro and Roberts2005). Supplementary tests of construct validity can potentially clarify mixed findings in the taxometric literature, but have not previously been reported in the depression literature. The present study provides evidence that dimensional models of depression have greater predictive validity than the DSM's categorical model, as well as empirically derived latent class models, and suggests it is unlikely that the results from the Prisciandaro & Roberts (Reference Prisciandaro and Roberts2005) study were artifactual. These results were consistent with those of another recent study that found that diagnoses of depression have little predictive validity after controlling for symptom severity in a sample of female twins (Aggen et al. Reference Aggen, Neale and Kendler2005). It remains for future research to evaluate the construct validity of taxonic solutions that have been reported in the literature. For example, does the ‘Involuntary Defeat Syndrome’ (IDS) taxon (Beach & Amir, Reference Beach and Amir2006) provide superior predictive ability compared with a dimensional representation of IDS symptoms? If not, it would be difficult to maintain that this construct has a latent categorical structure.
Although the DSM categorical variable predicted unique variance in several outcome variables after controlling for symptom severity, these effects appear to be due to statistical suppression. Specifically, MDEs predicted higher scores on internalizing symptoms, externalizing symptoms and treatment-seeking when tested in the absence of the dimensional depressive symptomatology scale. In contrast, MDEs predicted lower scores on each of these variables when severity of symptoms was included in the model. In other words, after adjusting for number of symptoms, having a diagnosis of MDD was associated with less symptomatology and lower frequency of treatment seeking. Such sign reversals reflect statistical suppression (Cohen et al. Reference Cohen, Cohen, West and Aiken2002). One explanation for suppression in these data involves the hierarchy rules imposed by the DSM; it may be that all that remains of an MDE diagnosis after controlling for symptom severity are the DSM's exclusionary criteria. Specifically, individuals high in depressive symptoms with certain other more serious disorders (e.g. psychotic and bipolar disorders) would not have met criteria for MDE because these disorders were part of the exclusionary criteria for MDE. In contrast, individuals who met criteria for MDE by definition would not have had these other more impairing disorders.
Because of the structure of the CIDI, a major limitation of the present study was its reliance on a sample with elevated depressive symptoms, which prevents clear generalization of the obtained results to the broader population. For example, the factor analytic results from the present study may not reflect the dimensional structure of depression in the unselected population, making the relevance of the predictive ability of the obtained factor model to the community questionable. Nonetheless, the obtained model is highly congruous with the results of Shafer's (Reference Shafer2006) meta-analysis of four widely used measures of depressive symptomsFootnote 4. Specifically, the factors in the present study's two-factor model (i.e. ‘cognitive–affective’ and ‘somatic’ symptoms) closely resemble the two common factors that Shafer found across populations and across measures of depression: ‘general depression’ (e.g. guilt) and ‘somatic symptoms’ (e.g. insomnia). Additionally, analyses of the predictive ability of a more conservative unidimensional model of depression in the present study suggested that this dimensional model still provided superior predictive validity relative to the DSM model of depression. In addition to the above concern, LCA would not have been able to detect depressive taxa with extremely high base rates in the general population because we removed all of the potential complement members from the sample.
Related to the issues above, the present sample had a restricted range of depressive symptoms resulting from the removal of individuals with few depressive symptoms. However, the impact of this range restriction on our findings is predictable and arguably suggests that the superior predictive ability of the dimensional models would have been even greater in an unrestricted sample. Specifically, range restriction would have attenuated relationships between dimensional models and outcomes. In contrast, this restriction would have increased our ability to find support for categorical models because it raised the base rate of MDE to close to 50%, which should optimize its predictive ability (Cohen et al. Reference Cohen, Cohen, West and Aiken2002). Along the same vein, our final sample over-represented individuals with high levels of symptoms who nonetheless did not meet criteria for MDE. However, if the DSM's categorical model is valid, this oversampling should have had little impact on the ability of MDEs to predict theoretically relevant constructs; the DSM reflects a discrete categorical model that purposefully discards within-class dimensional variation on the grounds that individuals are relatively homogeneous within-class. This is especially true for the non-disordered class (which is the only class where range restriction occurred in the present study) because the DSM's symptom severity specifier only applies to individuals who met diagnostic criteria.
If future research supports the present study's findings, additional research should further examine the dimensional structure of depressive symptoms using factor analytic techniques in large representative samples. Alongside these efforts, assessment devices should be developed to discern individuals' proper placement on the latent dimensions of depressive symptomatology, as existing dimensional measures may not adequately reflect the latent structure of depression. A dimensional framework requires rethinking the allocation of treatment resources. One possibility involves setting a cut-point on the latent symptom dimensions based on functional impairment (Kessler, Reference Kessler2002b). If the relationship between depression and impairment is linear, cost–benefit analyses could determine the advantages and disadvantages of treating different levels of depressive severity. If the relationship between depressive severity and impairment is non-linear, then the inflection point of this relationship could be used as a practical diagnostic cut-point.
In summary, the present study demonstrated that dimensional models of depression provided superior predictive validity relative to categorical models. These results provide construct validity evidence for the dimensional findings from Prisciandaro & Roberts' (Reference Prisciandaro and Roberts2005) taxometric study and thus inspire confidence in dimensional conceptualizations of depression. It remains for future research to evaluate the construct validity of taxonic solutions that have been reported in the literature.
Acknowledgements
The NCS is funded by the National Institute of Mental Health (grants R01 MH/DA46376 and R01 MH49098), the National Institute of Drug Abuse (through a supplement to R01 MH/DA46376) and the W. T. Grant Foundation (grant 90135190). We thank Craig Colder, Len Simms and John Ruscio for their helpful comments on an earlier draft of the paper. We are also grateful to Craig Colder, Bengt Muthén and Linda Muthén for their statistical advice.
Declaration of Interest
None.