Introduction
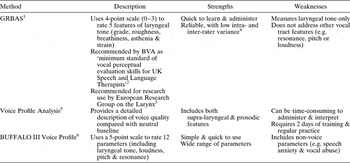
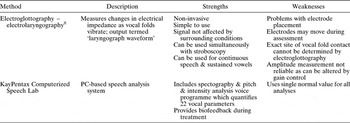
There are many different methods of assessing voice quality, both subjective and objective. These methods, with their attendant advantages and disadvantages, are shown in Tables I and II. Despite the range of available methods, there is still a need for a voice measurement tool useful for both clinical and research work. Such a tool would ideally be: objective; simple to use; provide a single parameter measuring overall voice quality; and have a standardised method transferable across different clinics and settings. Such a tool could be used in the clinical setting, mainly as an intra-subject, longitudinal measure of treatment response, but also as a diagnostic aid. In research, it could be used to compare different treatments.
Commonly used subjective voice assessment methods

Adapted with permission.Reference Carding, Carlson, Epstein, Mathieson and Shewell7 BVA = British Voice Association
Commonly used objective voice assessment methods

Adapted with permission.Reference Mathieson9 PC = personal computer
Phonation is predominantly driven by vocal fold vibration. Vocal fold anatomy is susceptible to impairment by physical damage arising from malignant processes and associated therapy, which will directly influence function. Vocal fold vibration is accompanied by impedance variations across the thyroid cartilage area. Impedance is an analogous measure of resistance to an alternating effect, i.e. the resistance to vibration of the medium in sound transmission. Trans-larynx impedance changes can be detected during phonation using laryngography. A laryngograph measures the efficiency of glottal closure by graphically recording the contact time of the vocal folds. It shows the opening and closing rates of the vocal folds, with successive measurements forming a time series with a distinct waveform, known as an electroglottogram. The electroglottogram waveform is an inverse reflection of the vocal fold mucosal wave and is free of vocal tract resonance. Kazi et al. demonstrated that electroglottic measurements can be used to measure voice outcomes after radiotherapy for larynx cancer, and found an improvement in several measures over 12 months.Reference Kazi, Venkitaraman, Johnson, Prasad, Clarke and Rhys-Evans10
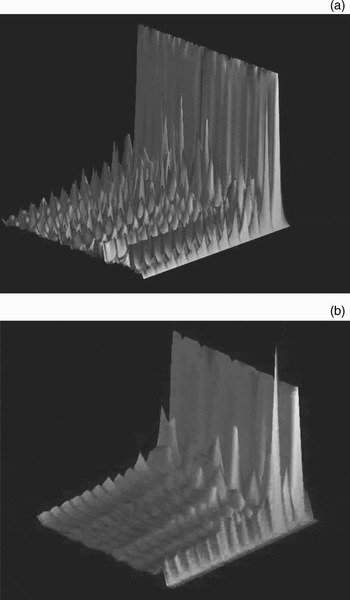
The use of statistics to measure and analyse voice often relies on simple ‘variability statistics’, e.g. median and mean. For linear systems (e.g. periodic signals), variability statistics are sufficient. Conventional variability statistical analyses do not lend themselves conveniently to shifting vocal patterns of fundamental frequency and harmonics, and more complicated signals will require an adaptive method of quantification. Manickam et al. and Moore et al. demonstrated the use of approximate entropy to good effect when analysing voice in their earlier studies.Reference Manickam, Moore, Willard and Slevin11, Reference Moore, Manickam, Willard, Jones, Slevin and Shalet12 Approximate entropy is an example of ‘regulatory statistics’. These have an advantage over variability statistics as they can explicitly account for the irregularity seen in sequential segments of data, in contrast to statistics determined from the entire data set without regard to ordering. Approximate entropy can reliably discriminate between the regularity and irregularity of a signal, i.e. its complexity.Reference Pincus13 The local pattern seen in the data is used to quantify the signal complexity. Approximate entropy is a measure of the degree of irregularity of a data sequence, where the order in which sample values appear is important. This distinguishes the measure from conventional variability statistics. Specifically, approximate entropy takes into account how often patterns of a given length (e.g. in short runs of consecutive samples) appear in the sequence. A highly irregular sequence will tend to have every possible pattern appearing equally, and be characterised by high approximate entropy, i.e. a more complex signal, resulting in a richer voice with more harmonics. A highly regular sequence will be dominated by a few patterns and tend to have low approximate entropy, i.e. a less complicated signal. A flat sequence, dominated by one pattern, will have zero approximate entropy. The spectral analysis of vocal fold vibration, based on impedance variations measured across the larynx, can be used to derive a single parameter measurement using approximate entropy. The spectral pattern of the vowel /i/ electroglottogram time series is analysed using approximate entropy after dynamic fundamental-harmonic frequency normalisation. The approximate entropy value provides a single estimate of the spectral pattern complexity. During vowel phonation, the electroglottogram will detect the patient's laryngeal muscle adduction rate and strength of vocal fold vibration. The degree of vocal richness corresponds to the number of prominent harmonics and the ‘skewness’ of spectogram: the higher the number of prominent harmonics, the higher the approximate entropy (Figures 1 and 2).Reference Moore, Manickam, Willard, Jones, Slevin and Shalet12 (Further information on the calculation of approximate entropy is given by Manickam et al.,Reference Manickam, Moore, Willard and Slevin11 Moore et al. Reference Moore, Manickam, Willard, Jones, Slevin and Shalet12 and Appendix 1.)
Perspective views of electroglottogram spectrograms. (a) Normal male: note sharp ‘bright’ harmonics in foreground; fundamental frequency (Fo) ridge to right is normalised. (b) Different normal male: note flat ‘dull’ harmonics in foreground; Fo ridge to right is normalised. x axis = harmonic scale, first Fo to right; y axis = power relative to normalised Fo; z axis = time.

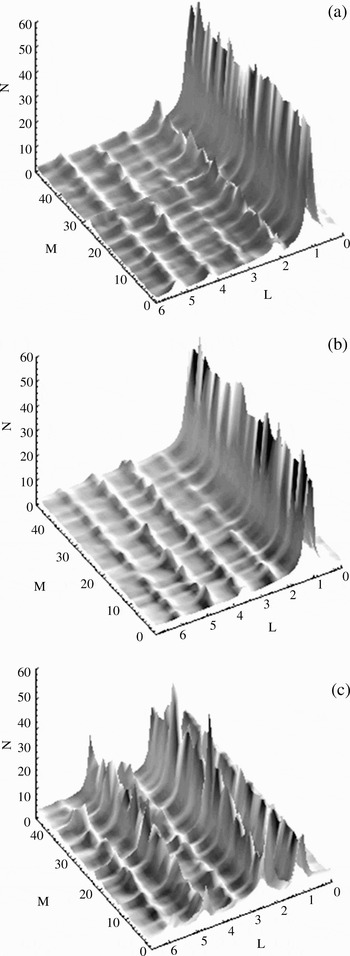
Perspective views of electroglottogram spectrograms for a glottic carcinoma patient receiving radiotherapy. Note that large harmonics are consistent with ‘bright’ voicing. (a) Pre-treatment: fundamental frequency (Fo) is large and fine but harmonics are depressed; (b) six months post-treatment: Fo is large and fine but harmonics are improving; (c) 12 months post-treatment: Fo is large and fine, with strongly recovered harmonics. x axis = harmonic scale, first Fo to right; y axis = power relative to normalised Fo; z axis = time

Each year in the UK, around 2000 people are diagnosed with laryngeal cancer.14 Laryngeal cancer most commonly presents with hoarseness of the voice due to disruption of glottic function. Early glottic cancer-specific (tumour stage one or two) has an excellent prognosis, with five-year cancer specific survival rates of 85–95 per cent.Reference Spector, Sessions, Chao, Haughey, Hanson and Simpson15, Reference Steiner16 The conservative treatment modalities used in early stage glottic cancer, namely radiotherapy and endoscopic laser surgery, are equivalent in terms of local control.Reference Barthel and Esclamado17, Reference Gallo, de Vincentiis, Manciocco, Simonelli, Fiorella and Shah18 However, reports comparing the quality of voice after both treatments vary in their findings; some report a better voice following radiotherapy,Reference Epstein, Lee, Kashima and Johns19, Reference Rydell, Schalen, Fex and Elner20 while others report no difference.Reference McGuirt, Blalock, Koufman, Feehs, Hilliard and Greven21–Reference Benninger, Gillen, Thieme, Jacobson and Dragovich24 Irradiation may leave the targeted tissues intact, but it still affects the tissue mechanisms and may perturb vocal fold functionality for months after treatment,Reference Spector, Sessions, Chao, Haughey, Hanson and Simpson15 directly affecting voice quality.Reference Spector, Sessions, Chao, Haughey, Hanson and Simpson15, Reference Hoyt, Lettinga, Leopold and Fisher25
We aimed to evaluate electroglottogram approximate entropy using healthy controls and a group of patients with laryngeal pathology (i.e. early stage glottic cancer) treated with radiotherapy. Specifically, the aims of this study were: (1) to use electroglottogram approximate entropy to measure voice in normal subjects and in patients with glottic pathology, to ascertain whether this parameter could distinguish between normal and pathological voices; (2) to ascertain whether electroglottogram approximate entropy could measure individual subjects’ voice change over time; and (3) to determine any correlation between electroglottogram approximate entropy and the grade–roughness–breathiness–asthenia–strain scale.
Materials and methods
Patients and controls
The study was approved by the local ethics committee.
One hundred and eighty-six patients were recruited to the study, 162 men and 24 women. The inclusion criteria comprised histologically confirmed invasive glottic squamous cell carcinoma with a tumour (T) node (N) stage of T1 N0 or T2 N0. Patients were excluded if they had received radiotherapy to the head and neck region for a previous malignancy.
All patients received radiotherapy at the Christie Hospital in Manchester. The dosage was 5250 cGy in 16 daily fractions over three weeks. Patient details were recorded, including age, sex, stage and smoking status.
In addition, 141 volunteers were recruited to act as a reference population. Volunteers were included if they regarded themselves as having ‘normal’ voice quality, and excluded if they had known voice or laryngeal pathology.
Measurements and equipment
Electroglottogram approximate entropy
Each patient was connected to an electrolaryngograph controlled by a personal computer. All recordings were obtained in a quiet room with the participant in a comfortable seated position. A pair of surface electrodes was attached to either side of the subject's thyroid cartilage. The participant was asked to phonate the vowel /i/ for 4 seconds. Three attempts were allowed, and the longest phonation duration was used. The resulting impedance signal was digitised into binary files, which were transmitted to a computer network for storage. The recorded signal was processed, conditioned and transformed as described above, to obtain approximate entropy values.
Grade–roughness–breathiness–asthenia–strain scale
Participants read the phonetically balanced ‘rainbow’ passage and were then graded by an experienced speech and language therapist using the grade–roughness–breathiness–asthenia–strain perceptual analysis scale.
Voice recording protocol
The glottic cancer patients underwent both electroglottogram approximate entropy and grade–roughness–breathiness–asthenia–strain scale recordings during each of three attendances: one to two weeks before starting radiotherapy; three to six months after completion of radiotherapy; and one year after completion of radiotherapy. None of these patients received speech therapy during the follow-up period. All volunteer subjects were assessed once for electroglottogram approximate entropy and once for the grade–roughness–breathiness–asthenia–strain scale.
Statistical methods
All data were analysed using the Statistical Package for the Social Sciences version 14 software program. When comparing patient sex and tumour stage with approximate entropy and grade–roughness–breathiness–asthenia–strain scale, the Mann–Whitney U test was applied. The first objective was to measure voice in both normal subjects and patients with glottic pathology, to ascertain whether electroglottogram approximate entropy could distinguish between normal and pathological voices. To ascertain whether electroglottogram approximate entropy could measure individual subjects’ voice change over time, the Mann–Whitney U test was used. Spearman's non-parametric correlation was used when comparing pairs of variables with continuous or ordinal scales. To assess for correlation between electroglottogram approximate entropy and grade–roughness–breathiness–asthenia–strain scale, Friedman's two-way non-parametric analysis was used, comparing these two parameters pre-treatment and three to six months and one year post-treatment. If this was statistically significant, the Wilcoxon matched pairs signed rank test was used to determine where the differences lay. This was applied using the Bonferonni correction to reduce the significance level for each of the paired tests.
Results and analysis
Patient variables
One hundred and forty-one volunteers were recruited and underwent electroglottogram approximate entropy measurement and grade–roughness–breathiness–asthenia–strain scale assessment.
One hundred and eighty-six glottic carcinoma patients were recruited, 162 men and 24 women. All patients underwent electroglottogram approximate entropy assessment and pre-treatment grade–roughness–breathiness–asthenia–strain scale assessment. One hundred and thirty-two patients completed both assessments before and three to six months after treatment. Seventy-nine patients completed both assessments before, three to six months after and one year after treatment. Fifty-eight per cent of patients had T1 disease and 42 per cent had T2. The patients’ mean age was 69 years (range 37–92 years). Forty-one per cent of patients were current smokers at diagnosis, 53 per cent were ex-smokers and 6 per cent had never smoked.
Pre-treatment electroglottogram approximate entropy analysis
The volunteers and patients underwent objective analysis of the electroglottogram approximate entropy of sustained vowel phonation. Volunteers had a median electroglottogram approximate entropy of 0.302 (range 0.058–0.421). Patients had a median electroglottogram approximate entropy of 0.227 (range 0.001–0.397); this was significantly worse than the volunteers’ median result (p < 0.0005).
Voice change over time
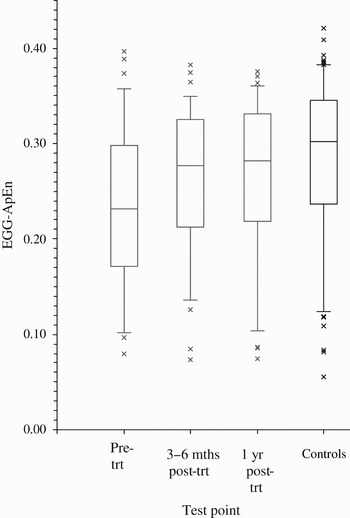
Figure 3 shows electroglottogram approximate entropy measures for patients before, three to six months after and one year after treatment, and also for controls.
Electroglottogram approximate entropy (EGG-ApEn) for patients over time (black) and for normal volunteers (grey). Pre-trt = before treatment; Post-trt = post-treatment

Friedman's test was used to compare results for all three time points, and confirmed a statistically significant improvement in electroglottogram approximate entropy at three to six months post-treatment (p < 0.003), with sustained improvement at one year post-treatment. At one year post-treatment, electroglottogram approximate entropy values in patients approached those of healthy controls (p = 0.097).
An example of the change in electroglottogram spectrogram is shown in Figure 2.
Grade–roughness–breathiness–asthenia–strain scale
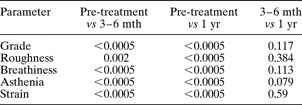
All participants were graded by an experienced speech and language therapist using the grade–roughness–breathiness–asthenia–strain scale. Friedman's test was used to compare scale results over time, and demonstrated a statistically significant improvement between two of the three time points assessed, i.e. between pre-treatment and three to six months post-treatment, and between pre-treatment and one year post-treatment. However, there was no significant difference in scale results between three to six months post-treatment and one year post-treatment (Table III).
Change in grade–roughness–breathiness–asthenia–strain scale over time, comparing before, 3–6 mth after and 1 yr after treatment

Data represent p values (Wilcoxon signed rank test). Mth = months; yr = year
Figure 4 demonstrates changes in patients’ G score is grade in grade-roughness-breathiness-asthenia-strain scale over time, showing progression towards a G score of zero or one over the one-year study period.
Change in patients’ G score over time. Pre-trt = pre-treatment; 3–6 mths = 3–6 months after treatment; 1 yr = 1 year after treatment; G = overall grade

Correlation between electroglottogram approximate entropy and grade–roughness–breathiness–asthenia–strain scale
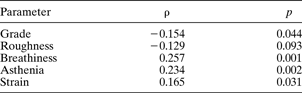
There were statistically significant correlations between electroglottogram approximate entropy results and the overall grade and three of the four constituent parameters of the grade–roughness–breathiness–asthenia–strain scale (i.e. breathiness, asthenia and strain). There was no statistically significant correlation between electroglottogram approximate entropy and roughness (Table IV).
Correlation between electroglottogram approximate entropy and grade–roughness–breathiness–asthenia–strain scale
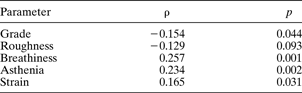
ρ = Spearman's correlation coefficient
Correlation between electroglottogram approximate entropy and patient variables
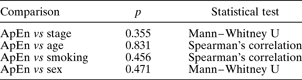
There was no significant correlation between patients’ pre-treatment electroglottogram approximate entropy values and their tumour stage, age, smoking status or sex (Table V).
Correlation between electroglottogram approximate entropy and patient variables
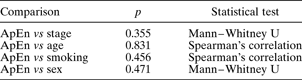
ApEn = electroglottogram approximate entropy
Discussion
Electroglottogram approximate entropy is a novel, single-parameter measure of voice quality. In this study, we found that the median electroglottogram approximate entropy of a healthy control group was significantly greater than that of patients with early glottic cancer (pre-treatment). However, there was considerable overlap between the electroglottogram approximate entropy results of individual controls and patients, suggesting that this parameter is unlikely to have a diagnostic role.
We also found that electroglottogram approximate entropy values could assess voice change over time. Over a one-year period following radiotherapy, we found that patients’ electroglottogram approximate entropy values improved (Figure 3). This improvement was mirrored by an improvement in their grade–roughness–breathiness–asthenia–strain scale. We also found a significant correlation between electroglottogram approximate entropy values and grade–roughness–breathiness–asthenia–strain scale results. Table IV demonstrates the statistically significant relationship between electroglottogram approximate entropy and overall grade and three of the four parameters of the grade–roughness–breathiness–asthenia–strain scale.
There is currently no single, standard measurement that can be used to accurately measure voice function. The lack of a standardised tool compromises evaluation of treatments and their outcome. While self-assessment of voice is possibly the most important evaluation, the influence of patients’ expectations and psychological state often leads to inconsistent findings.Reference Stewart, Chen and Stach26 Current characterisation of voice disorders in the clinical setting is often based on several different approaches, with an emphasis on perceptual analysis. However, this approach has a number of limitations (see Table I). There are various different scoring systems that can be used for perceptual analysis; examples include the grade–roughness–breathiness–asthenia–strain scale, the VPA (voice profile analysis) and the Buffalo II questionnaire. However, even within these three common scoring systems there is a lack of standardisation.Reference Carding, Carlson, Epstein, Mathieson and Shewell7
The Royal College of Speech and Language Therapists’ definition of a dysphonic voice is very broad, i.e. ‘a voice which is characterised by an abnormality of pitch, volume, resonance, quality or which is inappropriate for the age or gender of the speaker’. There is no similar definition for a ‘normal’ voice, and as a result there is no clear indication of when a ‘normal’ voice becomes ‘abnormal’. Thus, the experience of the assessing clinician or speech and language therapist becomes fundamental to the process of analysis.
In order to effectively measure voice quality as an outcome of treatment, an objective, quantitative measure of voice outcome is needed. Ideally, this measure should be easy to perform, simple to understand and reproducible.
Electroglottography is a simple, non-invasive and reproducible technique. The measurement of trans-larynx impedance allows monitoring of voice change. Electroglottography can also be performed simultaneously with stroboscopy. However, there are potential difficulties with electroglottography: the placement of the electrodes must be correct, and the waveform can indicate only the effects of bilateral vocal fold contact, not unilateral. Despite these drawbacks, electroglottography remains a useful tool and can be used to measure a number of voice parameters, including fundamental frequency, jitter, shimmer, normalised noise energy, closed quotient and closure index. However, interpretation of these parameters is often complex.
In the current study, the novel use of approximate entropy and regulatory statistics produced a single parameter indicating voice quality. This parameter, electroglottogram approximate entropy, is an overall measure of the spectral pattern of vocal fold vibration, based on impedance measurements across the larynx obtained via electroglottography. We found that electroglottogram approximate entropy values correlated with grade–roughness–breathiness–asthenia–strain scale results.
However, it should be emphasised that all the subjects in this study had glottic morphological pathology. The controls were used to establish normal electroglottigram approximate entropy. Whether electroglottogram approximate entropy can be used to measure voice quality in a wider range of voice pathologies (e.g. in neurological dysphonias or hyperfunctional or muscle tension dysphonia) remains to be seen. Future studies could undertake such evaluation, and also determine the repeatability and reproducibility of electroglottogram approximate entropy measurements.
A major attraction of a single parameter of voice quality is its use in longitudinal patient measurement, allowing for objective assessment after therapy, surgery or radiotherapy (as in this study). Having a single value allows easy monitoring of voice before and after treatment, giving an indicator of functional outcome. This can then be fed back to the patient. However, such single value monitoring can be both a strength and a weakness. The use of a single, objective measure allows the value to be easily reproducible. Such a single value could be easily incorporated into a clinical trial, or used as part of routine post-treatment assessment. Electroglottography is a simple technique which could easily be incorporated into routine voice monitoring after radiotherapy. However, it should be borne in mind that voice is a multidimensional entity. Whilst the use of an objective, single figure parameter is attractive, there is still a role for other information obtained from perceptual analysis, patient-based questionnaires, and acoustic and other electroglottographic analyses.
The treatment goal for an early laryngeal cancer (i.e. T1 to T2, N0) is cure with optimal voice quality. There is currently much debate about the relative merits of radiotherapy and endoscopic surgery in the management of early glottic cancer. As there is no evidence for the superiority of either one of these approaches with regards to local disease control,Reference Krengli, Policarpo, Manfredda, Aluffi, Gambaro and Panella27, Reference Goor, Peeters, Mahieu, Langendijk, Leemans and Verdonck-de Leeuw28 measures of voice quality are vital in determining which treatment modality is preferable.
Krengli et al. studied voice after radiotherapy and laser resection for glottic carcinoma, using vocal parameters (jitter, shimmer and noise–harmonic ratio), narrow spectrum voice analysis and stroboscopy.Reference Krengli, Policarpo, Manfredda, Aluffi, Gambaro and Panella27 Severe dysphonia was more significant in the surgical group. Fundamental frequency and vocal parameters showed more favourable results in the radiation group. Goor et al. assessed voice quality following radiotherapy or laser surgery for glottic carcinoma, using the voice handicap index.Reference Goor, Peeters, Mahieu, Langendijk, Leemans and Verdonck-de Leeuw28 Although they found no significant difference between the two groups, they acknowledged that treatment choice was not random, as it was made on the basis of depth of tumour infiltration judged by laryngostroboscopy. Wedman et al. assessed objective and subjective voice quality in a small group of 24 patients treated with either laser surgery or radiotherapy.Reference Wedman, Heimdal, Elstad and Olofsson23 These authors found no significant differences between the two treatment modalities, for any parameter.
These studies demonstrate the many tools available to assess voice quality, both objective and subjective. However, they also highlight the fact that, although there are many ways to assess voice, there is no standard, objective tool that is routinely used, making comparisons between studies difficult. A single, objective vocal assessment parameter would be an ideal adjunct for assessing voice, both in the clinical and research setting.
• There are many different methods of objective and subjective voice assessment
• Early stage glottic cancers have high cure rates
• These cancers can be treated with either radiotherapy or endoscopic surgery
• Electroglottogram approximate entropy supplies a single parameter voice measurement with which to assess response to treatment
Many studies have shown improvements in voice quality following irradiation of laryngeal cancer, as have we. However, there is still a lack of understanding of the influence of radiotherapy on voice quality. It is known that radiotherapy alters the vibratory and oscillatory characteristics of the vocal folds; furthermore, with tumour volume reduction and the direct soft tissue effects of radiotherapy, the biomechanics of the larynx will inevitably be affected. Kazi et al. recently published a study measuring voice outcome after radiotherapy.Reference Kazi, Venkitaraman, Johnson, Prasad, Clarke and Rhys-Evans10 They measured fundamental frequency, jitter, shimmer and normalised noise energy from the electroglottogram waveform, and found a trend towards improvement at 12 months post-treatment, in keeping with our results. The use of electroglottogram approximate entropy takes the analysis of the electroglottogram waveform one step further, giving a single, objective figure with which to quantify voice analysis. However, despite its many advantages, the narrow focus of such a parameter would inevitably exclude important information available from perceptual and questionnaire-based analysis.
We have shown that radiotherapy for glottic cancer results in significant improvement in voice quality, that this is achieved mainly in the first three to six months after treatment, and that patient's final voice quality is similar to that of healthy controls. The overlap in individual electroglottogram approximate entropy values between healthy controls and pre-treatment patients (with pathological voices) suggests that electroglottogram approximate entropy is unlikely to have a diagnostic role. The results of this study show that it is possible to use electroglottogram approximate entropy as a single voice outcome measure in glottic carcinoma patients undergoing radiotherapy. This form of assessment is easy to perform and non-invasive. Remove very reproducible. Electroglottogram approximate entropy would be an ideal assessment parameter for clinical trials, particularly for comparing radiotherapy and trans-oral laser surgery treatment for early glottic cancer.
Conclusion
Our study findings have demonstrated that electroglottogram approximate entropy values can be used to assess changes in voice quality with regards to glottic morphological abnormality, that they improve with improvement in voice quality post-treatment; and that they correlate significantly with grade–roughness–breathiness–asthenia–strain scale results. We have also shown that dysphonia caused by early glottic cancer recovers after radiotherapy. Electroglottogram approximate entropy is a tool worthy of further study in order to ascertain its potential value in assessing a wider range of vocal pathology.
Appendix 1. Calculation of electroglottogram approximate entropy
To calculate approximate entropy, a short segment of temporal data is selected and similarly patterned segments are sought and counted, guided by the statistics of the test series. Segments are usually no more than data pairs or triplets. The key parameters for approximate entropy calculation are: N, the number of points (ai) in the electroglottogram time series; m, the embedding dimension and the noise filter; and r, which makes approximate entropy robust. The value r is calculated from k × σ, where k is the arbitrary value, and σ is the standard deviation of the electroglottogram time series under observation. A typical value for the constant k is 0.10–0.25, as suggested by Pincus.Reference Pincus13 The first two data points from the electroglottogram time series (a1 and a2 ) are selected as a test template which is compared to all subsequent data pairs (ax, ay) taken from the same data frame, i.e. (a1, a2), (a2, a3) … (aN−m, aN−m+1). A match is said to exist when both data pairs fall within the noise filter margin (negative r to positive r). The total number of matches is recorded in a variable, count1. Immediately following each paired matching, the test pair is extended from (a1, a2) to the triplet (a1, a2, a3) and this is then compared with a similarly extended matching location, which now changes from (ax, ay) to (ax, ay, az). Each time the third element from the pair previously identified matched pair which both falls within the same noise margin, another counting variable, count2, is incremented. The conditional probability of finding matching third elements at points with matched pairs is 1n(count2/count1)1 for the first run. The second test pair (a2, a3) is then sequentially compared to (a1, a2), (a2, a3) … (aN−m, aN−m+1) to identify additional match points. Similarly, the counts for the pairs and triplets matches are added and the conditional probability is calculated for the second run. The procedure is repeated for N−m runs producing conditional probabilities 1n(count2/count1)N−m+1. The sum of the conditional probabilities is then divided by the total number of runs, N−m, to yield an average value which is the approximate entropy. (Adapted with permission.)Reference Manickam, Moore, Willard and Slevin11