Introduction
The estimation of the diet composition of large herbivores is critical for obtaining an understanding of their nutrient intake and optimizing grassland management (Chen et al., Reference Chen, Wang, Zhang and Huang2015; Zhang et al., Reference Zhang, Liu, Yang, Badgery, Guo and Zhang2022). The recent development of DNA metabarcoding, which is an efficient method for estimating the diet composition of herbivores, has been widely used for illuminating dietary niche partitioning and overlap among wild animals (Kartzinel et al., Reference Kartzinel, Chen, Coverdale, Erickson, Kress, Kuzmina, Rubenstein, Wang and Pringle2015; Gebremedhin et al., Reference Gebremedhin, Flagstad, Bekele, Chala, Bakkestuen, Boessenkool, Popp, Gussarova, Schroder-Nielsen, Nemomissa, Brochmann, Stenseth and Epp2016; Bhattacharyya et al., Reference Bhattacharyya, Dawson, Hipperson and Ishtiaq2019; Kowalczyk et al., Reference Kowalczyk, Wójcik, Taberlet, Kamiński, Miquel, Valentini, Craine and Coissac2019). However, there is an apparent deviation between the proportions of the herbage DNA sequences in faeces and the intake and diet composition of herbivores (Ando et al., Reference Ando, Mukai, Komura, Dewi, Ando and Isagi2020). This is attributable to differences in the digestibility of various types of forages, as well as amplification bias during the polymerase chain reaction (PCR) cycles (Bradley et al., Reference Bradley, Stiller, Doran-Sheehy, Harris, Chapman, Vigilant and Poinar2007). Consequently, the employment of relative barcode abundance as a reflection of the diet composition is often inaccurate.
The strategies for minimizing the aforementioned deviation have been summarized in a technical review (Alberdi et al., Reference Alberdi, Aizpurua, Bohmann, Gopalakrishnan, Lynggaard, Nielsen and Gilbert2019). However, this approach is semiquantitative, and further research and optimizations are required to obtain accurate and more quantitative assessments of dietary intake (Ando et al., Reference Ando, Fujii, Kawanabe, Ao, Inoue and Takenaka2018, Reference Ando, Mukai, Komura, Dewi, Ando and Isagi2020). Determining the actual correlation between the proportions of herbage DNA sequences in faeces and the original proportion of the corresponding plants in the diet has become the prime means of improving accuracy. A meta-analysis revealed the weak quantitative relationship between the biomass intake of the herbivore and the proportions of herbage DNA sequences determined in faeces, which is chiefly attributable to the wide variation among data sources (Lamb et al., Reference Lamb, Hunter, Pinnegar, Creer, Davies and Taylor2019). Moreover, numerous studies based on a few species have confirmed quantitative relationships between the diet composition of herbivores and the relative proportions of DNA sequences corresponding to each species of the forage in herbivore faecal samples (Symondson and Harwood Reference Symondson and Harwood2014; Soininen et al., Reference Soininen, Gauthier, Bilodeau, Berteaux, Gielly, Taberlet, Gussarova, Bellemain, Hassel, Stenoien, Epp, Schroder-Nielsen, Brochmann and Yoccoz2015; Sousa et al., Reference Sousa, Xavier, Costa, Humphries, Trueman, Rosa, Sims and Queiroz2016; Mohorianu et al., Reference Mohorianu, Bretman, Smith, Fowler, Dalmay and Chapman2017; Lamb et al., Reference Lamb, Hunter, Pinnegar, Creer, Davies and Taylor2019). Guo et al. used the ITS2-barcoding approach to establish quantitative predictions of the dietary component of sheep; this method is likely to be widely employed for the estimation of diet composition, although the trial involved only 4–6 forage species, which is a minuscule representation of the number of forage species typically encountered in the meadow (Guo et al., Reference Guo, Zhang, Chen and Zhang2018). Although the inclusion of a larger number of species has been hypothesised to improve the quantitative performance of metabarcoding studies (Deagle et al., Reference Deagle, Thomas, McInnes, Clarke, Vesterinen, Clare, Kartzinel and Eveson2019; Pinol et al., Reference Pinol, Senar and Symondson2019), there has hitherto been no such investigation when sheep were fed with forage of rich diversity and the diet composition estimated thereof. Therefore, the discovery of the abovementioned quantitative relationships in species-rich grasslands is of great interest for improving the precision of molecular methods employed for determining the diet composition of grazing animals.
We hypothesised that the determination of the diet composition of grazing sheep including a variety of species would be beneficial for the establishment of regression models to determine significant relationships between the retrieved DNA and comprehensive and accurate dietary information. The objectives of our study include the following: (1) to develop quantifiable correlations between the proportions of retrieved DNA sequences from the faecal samples and those of herbage species that are consumed by sheep and (2) to verify the reliability and practicability of the model by analysing the faeces of sheep housed in confinement using an ITS2-barcoding approach.
Materials and methods
The DNA barcode technique employed in the present study for the estimation of sheep diet composition in a species-rich natural grassland has been summarized in Fig. 1. The experiment methods followed this procedure.
Procedure for quantitative estimation of herbivore diet using Illumina MiSeq sequencing.

Location of the study site
The study was conducted in a pasture-agro-ecosystem research station (49° 26′ N, 120° 9′ E) located in Hulunbuir (Inner Mongolia, China) at an altitude of 670 m and with an annual precipitation of ∼309 mm. The study area is a temperate meadow steppe, with Leymus chinensis, Artemisia tanacetifolia, Potentilla bifurca and Astragalus adsurgens as the dominant species. The plant community structure was investigated on 1 July 1 2021, and nine common species were selected: Leymus chinensis (LC), Bromus inermis (BI), Artemisia tanacetifolia (AT), Astragalus adsurgens (AA), Carex duriuscula (CD), Potentilla bifurca (PB), Medicago falcata (MF), Plantago depressa (PD) and Poa pratensis (PP). The height and canopy cover of these plants accounted for >95% of the total, indicating the significant contribution of these species towards the feed composition of sheep.
Feeding experiment
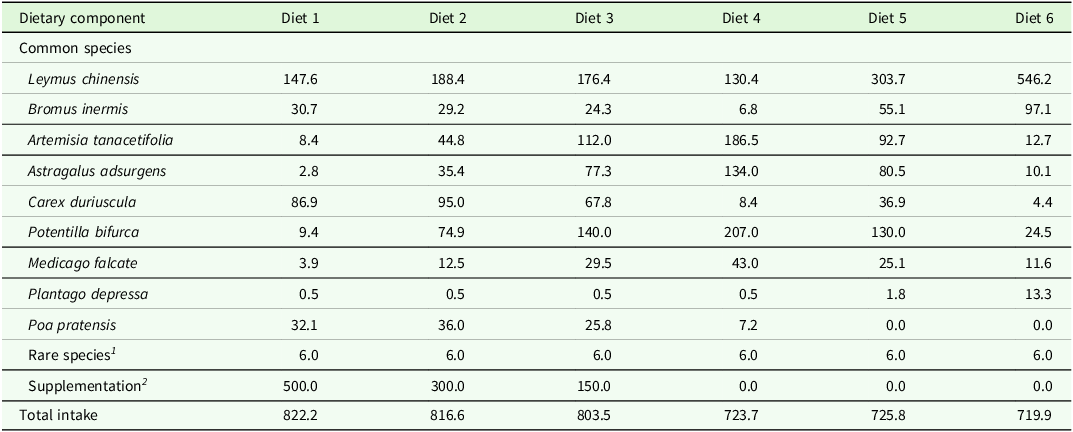
Twenty-four healthy weaned male Hulunbuir sheep (4–5 months old, BW 24 ± 2.3 kg [mean ± standard deviation]) participated in the trial in 2021. Those sheep were randomized and housed separately in custom-built pens (one sheep per pen) for individual feeding and distributed into six groups (n = 4 per group). Each group received one of six different treatment diets. Each diet contains nine 9 species with supplementation and 12 rare species (Artemisia argyi, Artemisia annua, Potentilla chinensis, Sanguisorba officinalis, Lepidium apetalum, Serratula centauroides, Galium verum, Taraxacum mongolicum, Poa subfastigiata, Inula britannica, Stipa capillata and Calamagrostis epigejos). The actual intake of each forage in the diet is shown in Table 1.
Dry matter intake (g DM/day) of each diet

1 Including Artemisia argyi, Artemisia annua, Potentilla chinensis, Sanguisorba officinalis, Lepidium apetalum, Serratula centauroides, Galium verum, Taraxacum mongolicum, Poa subfastigiata, Inula britannica, Stipa capillata and Calamagrostis epigejos 0.5 g per species.
2 Including corn gain 42%, corn germ meal 28%, soybean meal 16%, barley grain 12% and sucrose 2%.
The proportions of the different species of forage in the diet were determined using the following steps: (1) Setting the maximum and minimum percentages of each common species in the diet based on their coverage area in the grassland, with the maximum and minimum percentages typically corresponding to twice and half the coverage area, respectively. For example, a coverage area of 40% of a species in the grassland such as LC would entail setting the minimum and maximum percentages in the diet to 20 and 80%, respectively. (2) Establishing a gradient of diet percentages based on the number of diet treatments. For instance, six diet treatments would entail a gradient of 20, 32, 44, 56, 68 and 80% concerning the percentage of a particular species of forage (e.g. LC) in the diets without supplementation. (3) Considering the impact of grain supplements on the forage preferences of the sheep while formulating the diets. Previous studies (Montes-Sanchez et al., Reference Montes-Sanchez, Van Miegroet and Villalba2017) have shown that supplementation increases the preference for the dominant forage species. Therefore, the percentage of LC is expected to be relatively higher in the dietary intake of sheep that were fed diets containing a higher percentage of supplements. In summary, the actual percentage of the dry matter of each forage species in the different diets is calculated by multiplying the dry matter content of the individual forage species with (1 – the percentage of grain supplement in the diet). For example, if the predetermined percentages of LC and grain supplements in Diet 3 are 44 and 10%, respectively, then the actual percentage of LC in Diet 3 would be calculated as 44% × (1 − 10%), to yield 39.6%. Similarly, if the predetermined percentages of LC and grain supplements in Diet 4 are 80 and 60%, respectively, then the actual percentage of LC in Diet 4 is calculated as 80% × (1 − 60%), to yield 32%.
The supplements were provided in the form of pellets, obtained by pressing the ingredients that had been subject to pulverization and blending and contained corn grain (42%), corn germ meal (28%), soybean meal (16%), barley grain (12%) and sucrose (2%). The forage species with a total coverage area of <5% in grassland surveys have been termed as rare species, and their percentage in the diet of herbivores is extremely low or even nil under normal grazing conditions. The purpose of including these species in the diet treatments is to simulate the diet composition under normal grazing conditions and thereby enhance the applicability of the model. Fresh forage samples were individually collected from the nearby grasslands and cut into small pieces (<2 cm) to prevent selective feeding by the sheep. The diet components were weighed separately based on predetermined percentages, thoroughly mixed and fed to the sheep daily at 18:00 h. Animal experiments obtained permission from the China Agricultural University Laboratory Animal Welfare and Animal Experimental Ethical Committee (approval no. AW52603202-5-1).
Sample collection
The trial consisted of a 7-day adaptation and a 5-day faecal collection period. The amount of food consumed by the sheep was adjusted during the adaptation period to ensure that <5% of the dry matter was refused (Brosh et al., Reference Brosh, Henkin, Rothman, Aharoni, Orlov and Arieli2003). The sheep were provided with adequate water and mineral block supplements throughout the experimental period. In addition, the wastage of forages was minimized by collecting the spilled forages and placing them back in the feed box. On the last day of the adaptation period, nylon meshes were installed at the bottom of the pens for faeces sampling. The faeces were collected in the nylon mesh at approximately 07:00 h and were cleared daily. Once all the samples from each pen were collected, 20% of the samples were randomly selected as representative samples. These representative faecal samples from each pen collected over the 5-day sampling period were mixed to yield the final samples (Elwert et al., Reference Elwert, Kluth and Rodehutscord2004). The composite faecal samples were stored at −20 °C for follow-up analysis.
Molecular analysis
The following steps were carried out for the molecular analysis of all faecal samples (n = 24): DNA extraction, PCR amplification of the ITS2 gene, deep-sequencing of the ITS2 amplicons and quality assurance of the sequencing data. The specific operational details have been provided in a previous study (Guo et al., Reference Guo, Zhang, Chen and Zhang2018). Total DNA was extracted from sheep faecal samples using the E.Z.N.A. stool DNA kit (Omega Bio-Tek, USA) as per the manufacturer’s instructions. The ITS2 gene fragment was amplified using the primer pairs rD5-ITS2 (5′- TCCTCCGCTTATTGATATGC-3′) and rb1-ITS2F (5′-CGATACTTGGTGTGAATT GCAG-3′) in a GeneAmp PCR system 9700 thermal cycler (Applied Biosystems, USA) as detailed previously (Bradley et al., Reference Bradley, Stiller, Doran-Sheehy, Harris, Chapman, Vigilant and Poinar2007). The purified ITS2 amplicons were sequenced using the Illumina MiSeq PE300 system (Bio-Pharm Technology Co. Ltd., China).
Statistical analyses
Any irrelevant operational taxonomic units (OTUs) were removed from the OTU table prior to the analysis of diet composition. Only OTUs with sequence counts of >2 were considered for further processing, while the sequences that occurred less than twice were assumed to be sequencing errors specific to the ITS2 region and excluded from subsequent analyses. The resulting OTU tables were utilized for qualitative analysis to investigate the forage species consumed by the sheep. The sequence counts corresponding to the common species were extracted from the table and subjected to a log transformation for quantitative analysis, following the approach detailed by Guo et al. (Guo et al., Reference Guo, Zhang, Chen and Zhang2018). Read abundance data using the sequence counts were used to calculate relative read abundance (RRAi) for plant item i as follows:
 $${\rm{RR}}{{\rm{A}}_i} = {1 \over S}\mathop \sum \limits_{k = 1}^S {{{n_{i,k}}} \over {\mathop \sum \nolimits_{i = 1}^T {n_{i,k}}}} \times 100{\rm{\% }}$$
where T, S and
 ${n_{i,k}}$
represent the numbers of plant species, samples and sequences of plant item i in sample k (Deagle et al., Reference Deagle, Thomas, McInnes, Clarke, Vesterinen, Clare, Kartzinel and Eveson2019).
The RRAi corresponding to various forage species in the faecal samples was considered in previous studies to directly reflect the actual diet composition of the herbivores. This relationship was quantified in the present study through the development of a linear regression model intended to improve the accuracy of the estimation. The generalizability of the model was increased by closely simulating the diet composition under actual grazing conditions. This was achieved by the addition of grain supplements to the diets as well as the inclusion in every diet of a comparable number of forage species as found in the grasslands. Then, the RRAi corresponding to various forages in the diet was substituted into their respective linear regression models, and the resulting corrected values were employed as estimates for the percentage of the corresponding dietary components. Furthermore, the Kulczynski similarity coefficient was employed for assessing the accuracy of the RRAi and model correction value (Guo et al., Reference Guo, Zhao, Liu, Zhang, Zhang, Ma, Wang and Luo2021). The following formula was employed for calculating the Kulczynski similarity coefficient:
 $${\rm{KSI}} = 100 \times {{\sum 2{c_i}} \over {\sum \left( {{a_i} + {b_i}} \right)}}$$
where
 ${c_i}$
represents the smaller of the actual (dry matter percentage) and the estimated (RRAi/model correction value) values of the
 ${\rm{i}}$
th forage in the simulated diet, while
 $\left( {{a_i} + {b_i}} \right)$
represents the sum of the actual and the estimated values of each diet component.
Statistical analyses were conducted using R software (version 4.2.3). One-way analysis of variance was employed for examining the differences between dry matter percentage, RRAi and model correction value. Multiple comparisons were performed using Scheffé’s post hoc test. A rarefaction curve was generated using Mothur 1.30.2 based on OTU matrices. Nonmetric multidimensional scaling (NMDS) was performed using QIIME, and the figures were generated using the ggplot2 package in R (version 4.2.3). Linear regression analysis was employed to determine the quantitative relationships between the RRAi obtained from sheep faecal samples and the percentage of the corresponding herbage species in the ingested diets.
Results
Overview of the ITS2-amplicon sequencing data
A final dataset containing valid sequence data was generated. This dataset comprised 1 706 495 filtered, high-quality and usable ITS2 sequences, representing a total of 92 OTUs. The average length and size range of the PCR products were 322 bp and 201–380 bp, respectively. The average Good’s coverage estimate, which indicates the percentage of OTUs represented in the faecal samples, was found to be 99%. A rarefaction curve was constructed using 24 faecal samples to assess the reliability of the sampling quantity and the sequencing data volume. The curve exhibited a gentle trend, suggesting that the sampling effort and sequencing depth were sufficient (Fig. 2[a]). Furthermore, the NMDS analysis revealed a distinct grouping of the daily diets based on the identified taxa (Fig. 2[b]). Five of the six groups showed significant differences, indicating variations in the diet composition among these groups. However, similar compositions were observed for Diet 3 and Diet 4.
Plants identified by the DNA metabarcoding sequencing of the ITS2 gene of faecal samples. (a) Rarefaction curves of operational taxonomic units (OTUs). (b) Nonmetric multidimensional scaling (NMDS) for the dissimilarity-distance matrix between each sample.

Qualitative analysis of the diet composition
A total of 92 OTUs and 24 floristic genera, with the exclusion of fungal species, were identified at the genus level from 24 sheep faecal samples. The common herbage species, considered at the level of genera, accounted for 86.18–99.19% of the DNA sequences obtained from the faeces of sheep provided with the Diets 1–6 (Fig. 3), as follows: Carex (47.78%), Potentilla (25.34%), Sanguisorba (9.13%), Poa (5.12%) and Draba (3.05%) with Diet 1; Potentilla (68.76%), Carex (14.01%), Draba (5.85%), Sanguisorba (4.28%) and Artemisia (2.94%) with Diet 2; Potentilla (72.65%), Carex (8.55%), Artemisia (7.29%), Sanguisorba (4.75%) and Astragalus (3.98%) with Diet 3; Potentilla (59.83%), Astragalus (17.77%), Carex (8.45%), Artemisia (4.59%), Draba (4.16%) and Sanguisorba (3.11%) with Diet 4; Artemisia (53.95%), Potentilla (37.02%) and Astragalus (7.49%) with Diet 5; and Astragalus (47.56%), Potentilla (30.19%), Artemisia (6.03%), Leymus (5.97%) and Carex (4.33%) with Diet 6. The rare species belonging to the genera Sanguisorba, Galium, Taraxacum, Inula, Lepidium, Glycine, Klasea and Aster accounted for 0.81–13.82% of the DNA sequences obtained with the Diets 1–6, while Stipa and Calamagrostis were not detectable. In addition, species belonging to the following genera, which are found in the grassland but not included in the diet, were also detected: Draba, Agrostis, Rhynchospora, Lappula, Chenopodium, Codonopsis, Arctopoa and Atractylodes.
DNA sequence percentage of plant genera in the faecal flora of the experimental sheep. The DNA sequence percentage of the genera was calculated using the number of sequences assigned to be of plant origin.

Quantitative analysis of the diet composition
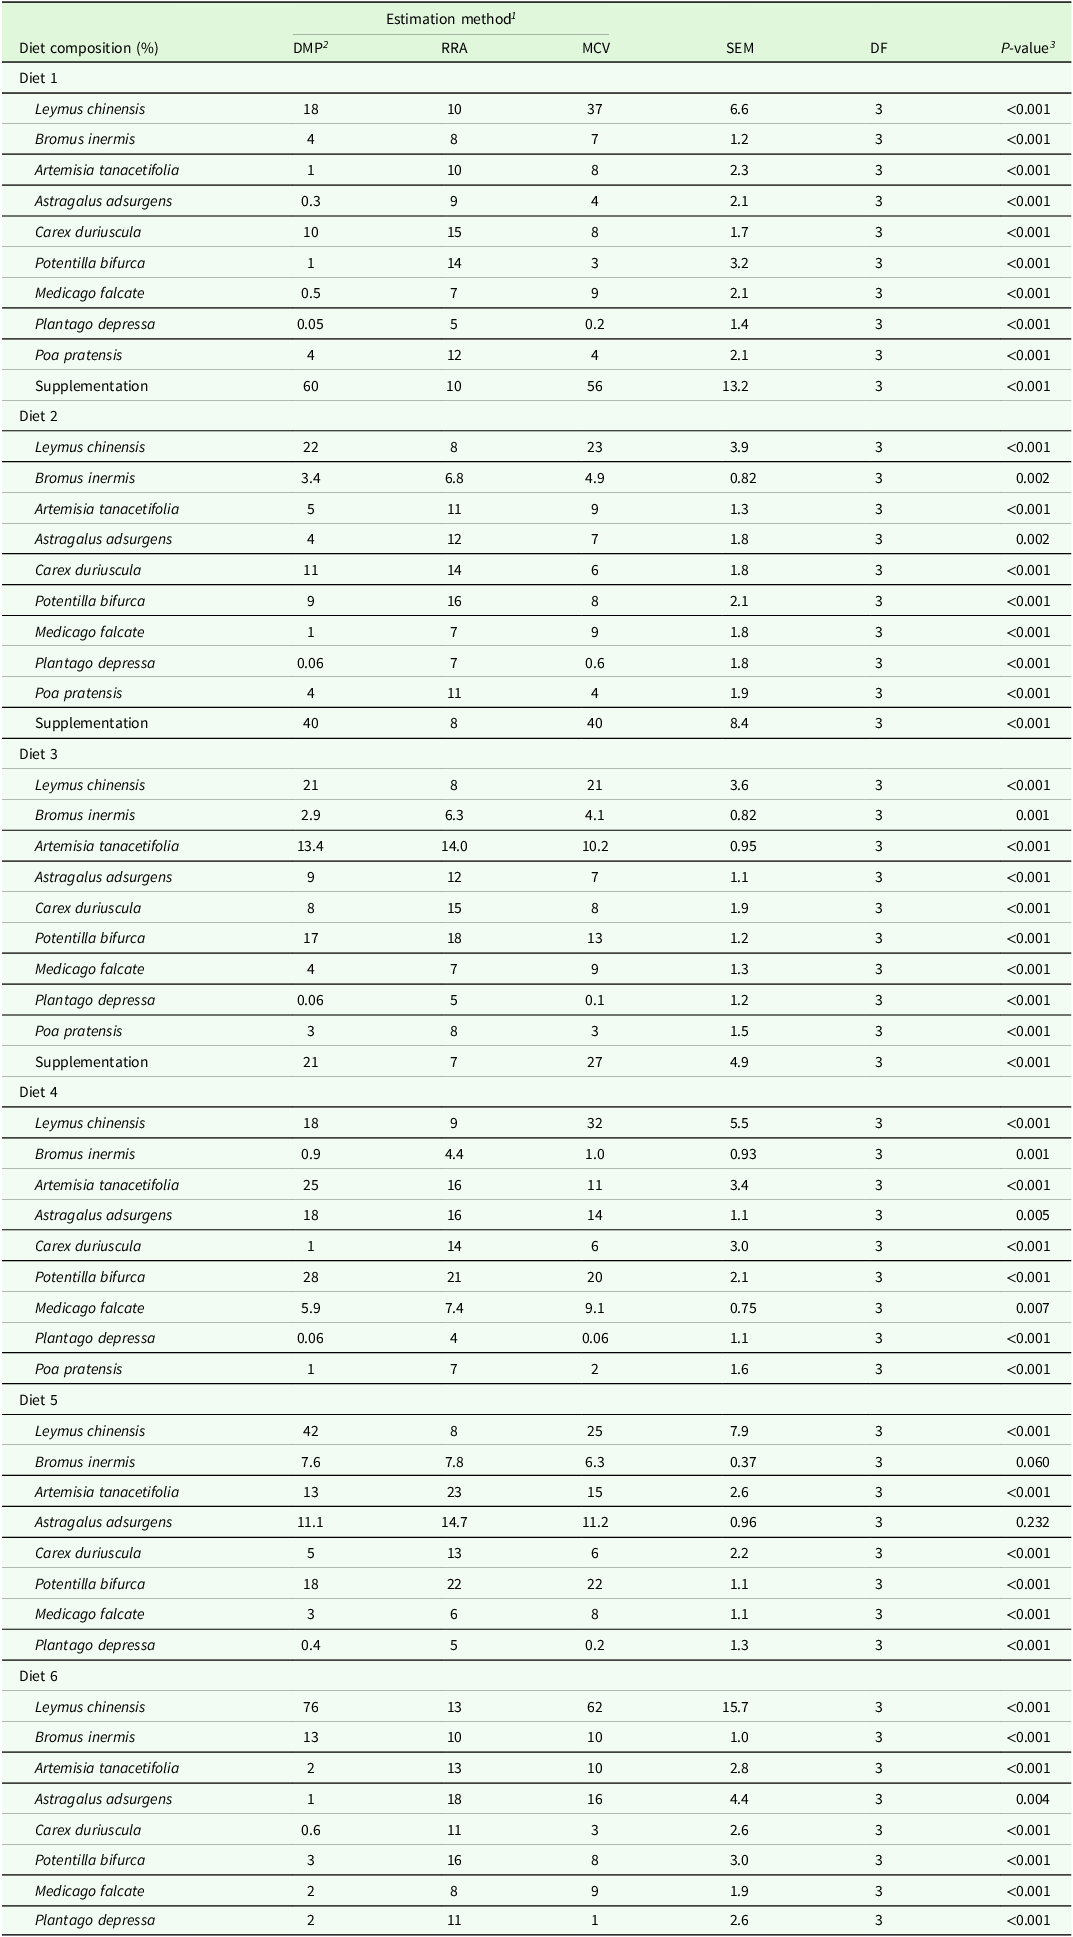
The RRAi of each common species in the faecal samples was calculated to estimate the actual percentage of dry matter intake corresponding to each species. The accuracy of RRAi was verified by comparing the estimated percentage (using RRAi) of the common species with the actual percentage of each forage in the diets consumed by the sheep (Table 2). The RRAi of each common species exhibited significant differences from the actual percentage of the corresponding dry matter. Relative abundance of soybean meal in faecal samples as an indication of the percentage of supplements in the diet.
Real dry matter percentage of intake and estimated percentages of diet component based on relative read abundance and regression equation correction

Abbreviations: DMP = dry matter percentage; RRA = relative read abundance; MCV = model correction value.
1 Mean values of each forage species in the diets of the groups with different estimation methods.
2 Mean values of dry matter percentages of various forages in different diets.
3 P-values were obtained from ANOVA of different estimation methods. P < 0.05 was considered significant.
Correlation analysis and quantitative relationships
As shown in Fig. 4, the RRAi exhibited a significant correlation with the dry matter proportion in the diets at a species level (Spearman’s ρ = 0.389. P < 0.001. n = 220). The linear regression analysis indicated a significant linear relationship between the dry matter proportion and RRAi for LC (R 2 = 0.56, P < 0.001), BI (R 2 = 0.514, P < 0.001), AT (R 2 = 0.32, P < 0.01), AA (R 2 = 0.49, P < 0.001), CD (R 2 = 0.28, P < 0.01), PB (R 2 = 0.67, P < 0.001), PD (R 2 = 0.64, P < 0.001) and PB (R 2 = 0.61, P < 0.001). In addition, barley was employed as a marker for establishing a regression model between the RRAi of barley grain in the faecal samples and the proportion of supplement intake (R 2 = 0.69, P < 0.001). The quantitative relationships can be predicted via the following linear regression equations: y = 8.815× − 0.479 for LC, y = 1.577× − 0.059 for BI, y = 0.666× − 0.033 for AT, y = 1.361× − 0.087 for AA, y = 1.263× − 0.112 for CD, y = 2.325× − 0.289 for PB, y = 0.187× − 0.007 for PD, y = 0.457× − 0.013 for PP and y = 9.947× − 0.4 for the supplements.
Correlation between the dry matter proportion in the experimental diets and the relative read abundance using faecal DNA analysis. Regression relationships between the dry matter proportion and the relative read abundance for (a) all species, (b) LC = Leymus chinensis, (c) AT = Artemisia tanacetifolia, (d) AA = Astragalus adsurgens, (e) BI = Bromus inermis, (f) PB = Potentilla bifurca, (g) PD = Plantago depressa, (h) CD = Carex duriuscula, (i) PP = Poa pratensis and (j) Sup = supplementation based on DNA Illumina sequencing.

Evaluation of the accuracy of the model
DNA metabarcoding could be employed for estimating the diet composition by using regression models for each selected species. The model-corrected value (MCV) and direct estimates in the diet (RRAi) were compared to estimate the accuracy of the models. The observed proportion of the intake dry matter, direct estimates of the proportion (using RRAi) and model corrections (MCV) for the six diets are presented in Table 2. The similarity coefficient KSI was employed for evaluating the accuracy of the estimated and corrected values obtained by the two methods. The variance analysis of the similarity coefficient KSI obtained for the two methods is presented in Fig. 5. Statistically significant differences (P < 0.05) were obtained in the accuracy of estimated diet composition using the two different methods (Fig. 5). Significantly improved accuracy (P < 0.001), as compared to the direct estimation of diet composition using RRAi, was obtained following the correction of the regression models for each species. The range and average values of KSI for each species were 42.37–79.32 and 56.74%, respectively, with the direct estimation method, and 74.13–90.23 and 84.69%, respectively, upon correction of the regression models.
Effect of different methods and diets on Kulczynski similarity index (KSI, %). Method: direct estimate (blue lines) and model correction (red lines). *** indicates significant differences at the levels of P < 0.001, respectively.

Discussion
Assessing the suitability of the ITS2 region as a DNA barcode
The ITS2 region has been widely recognized as an effective DNA barcode for the identification of herbage species (Bradley et al., Reference Bradley, Stiller, Doran-Sheehy, Harris, Chapman, Vigilant and Poinar2007) and has also been commonly employed for the identification of degraded plant material with a high success rate (92.7%) at the species level (Chiou et al., Reference Chiou, Yen, Fang, Chen and Lin2007). In the present study, all the common species that constituted the daily diet of sheep were detectable in each faecal sample. The accuracy of herbage identification at the genus level was found to be 86.18–99.19%, illustrating the utility of ITS2 as a powerful DNA barcode for the identification of plant taxa. Several other DNA barcodes have also been widely employed for diet analysis (Kohn et al., Reference Kohn, York, Kamradt, Haugt, Sauvajot and Wayne1999). For example, the use of ribulose 1,5-biphosphate carboxylase (rbcL) as a DNA barcode offers the advantage of easy amplification and comparison, but the success rates of species identification are often lower due to the slow evolution of genes in this region and the slight genetic variation at the species level (Lahaye et al., Reference Lahaye, Van der Bank, Bogarin, Warner, Pupulin, Gigot, Maurin, Duthoit, Barraclough and Savolainen2008). Moreover, although the use of the P6 loop fragment of the chloroplast gene trnL (UAA) as a barcode is more suitable for highly degraded environmental samples, the recognition rate of the entire trnL intron and the P6 loop (<72 and 19.5%, respectively) is usually low at a species level, which directly limits their application for the identification of plant taxa (Taberlet et al., Reference Taberlet, Coissac, Pompanon, Gielly, Miquel, Valentini, Vermat, Corthier, Brochmann and Willerslev2007).
The ITS2 region, as a mini-barcode, can be effectively identified even following sample storage or retention over a long period. However, the lack of a genetic database for gramineous plants has resulted in low rates of identification, which could prove detrimental for herbage identification in samples containing various gramineous species (Valentini et al., Reference Valentini, Miquel, Nawaz, Bellemain, Coissac, Pompanon, Gielly, Cruaud, Nascetti, Wincker, Swenson and Taberlet2009). Similar results were obtained in the present study, with the ITS2 DNA sequences amplified from the non-Gramineae species (AT, AA, CD, PB, PD, PP and supplements) far exceeding those from the Gramineae species (LC and BI). This could also be a consequence of preferential amplification, as also observed previously (Richardson et al., Reference Richardson, Curtis, Matcham, Lin, Suresh, Sponsler, Hearon and Johnson2019). Moreover, the rare species in the daily diets were also detectable in the faeces, except for Stipa capillata and Calamagrostis epigejos. This is probably owing to the relatively low percentage of the dry matter corresponding to these two species in the diet. In addition, eight species that were not added to the diet were detected in the faecal samples. Similar results were also obtained in previous studies, suggesting that the short adaptation periods result in retention within the intestinal tract and incomplete excretion of the herbage species that were consumed by the sheep prior to the test. Taken together, the results further demonstrate the suitability of the ITS2 marker as a DNA barcode for analysing the diet characteristics of grazing sheep because of the sensibility for samples.
Relationship between the relative abundance of DNA sequences and the proportion of intake dry matter
Previous studies have verified the reliable relationship between the relative abundance of DNA sequences and mammalian diet (Kartzinel et al., Reference Kartzinel, Chen, Coverdale, Erickson, Kress, Kuzmina, Rubenstein, Wang and Pringle2015; Ando et al., Reference Ando, Mukai, Komura, Dewi, Ando and Isagi2020). A previous study involving the employment of 4–6 species in a single diet reported positive Pearson correlation coefficient (with Spearman ρ = 0.376, P < 0.01) using the same approach (Guo et al., Reference Guo, Zhang, Chen and Zhang2018), which is in concurrence with the observations made in the present study (Spearman ρ = 0.389, P < 0.001) employing 18 forage species. Notably, the innovative approach employed in the present study involves the close simulation of the diet composition under actual grazing conditions by adding grain supplements and increasing the number of species in the diet, thereby improving the quantitative performance of the molecular analyses. The employment of fewer species in the herbivore diet in previous studies is likely to limit improvements in the quantitative performance of the corresponding molecular analyses. Diversified amplification efficiencies are likely to enhance the overall quantitative performance with an increase in the number of species employed (Deagle et al., Reference Deagle, Thomas, McInnes, Clarke, Vesterinen, Clare, Kartzinel and Eveson2019; Pinol et al., Reference Pinol, Senar and Symondson2019). Concurrently, a robust linear regression model was constructed for all the common species except MF due to slight differences in the dry matter percentage of MF in each group. A greater number of species, as compared to previous studies, were found to exhibit a statistically significant correlation between the DNA sequences in the faecal samples and the percentage of the forage species in the dietary intake, suggesting stronger quantitative performance in the meadow steppe, a high-diversity grassland.
Accuracy and applicability of the estimated diet composition
In the present study, the similarity between the actual and estimated (following correction of the regression models) percentages of the dietary components was found to be as high as 84.69%, which is significantly higher (P < 0.001) than the corresponding values prior to correction (56.74%). Considerably higher values of the estimated percentages of LC in the diets were obtained following (as compared to before) model correction. Moreover, the estimated percentages of the species AT, AA and PB following model correction were significantly lower (P < 0.001) than the corresponding estimates prior to the correction, thereby increasing the authenticity of the estimated diet composition.
The evaluation of feed components is also relevant in the context of the preferences of grazing livestock, and the formulation of effective feeding strategies involves the accurate measurement of nutrient intake in addition to feed intake. Although the corrected percentages obtained using the model correction method closely matched the absolute values, the sum of the estimated percentages of the various species was always found to be higher or lower than 100%, which does not affect the intake preference of the livestock. However, a standardization (scaling up or down to a total of 100%) of the diet composition estimated using the model correction method is necessary for estimating the nutritional intake and digestive performance of the livestock to prevent bias in the analysis of the digestive performance. In addition, although quantitative analysis and model construction have not been carried out for MF, a significant impact on the estimation of nutrient intake and digestive performance of the livestock was not observed due to the lower abundance of the species. The relationship model established in the current study has strong applicability for the estimation of the diet composition of grazing livestock in the meadow steppe, given that the species employed in the study account for >90% of the total biomass in the grassland.
The approach employed in the current study also has certain limitations. For instance, the feeding trial does not consider the seasonal and interannual variations in the grassland communities. Moreover, the constraints of time and space associated with the model may apply to the corresponding calculations associated with sheep grazing on the grasslands within a community structure resembling that of this experiment. As exciting new research reveals a deeper understanding of this subject, the highlighted shortcomings and gaps are likely to be overcome.
Conclusion
The findings illustrate the ITS2 marker’s potential for evaluating the diet characteristics of grazing sheep due to its sensitivity to samples. In addition, there was a strong correlation between the relative abundance of all common species and their corresponding herbage mass percentages except for Medicago falcate. The accuracy of the related equations was assessed and revealed an 84.69% resemblance between the actual diet composition and the correct percentage. Overall, the current study has provided empirical evidence for the accuracy and usability of ITS2 as a DNA barcode for getting quantitative information about sheep diet composition when grazing in species-rich grasslands.
Acknowledgements
We are grateful to the Grassland Agroecosystem Station in Hulunbuir, Inner Mongolia, China, for providing the research site and the generous support from the staff there. We thank Dr. Tongtian Guo for his constructive comments on the manuscript. We are grateful to Prof. Gaowen Yang for his guidance in the drafting and writing process.
Author contributions
Conceptualization: YP Guo
Methodology: ML Xu, YP Guo, HL Luo
Formal analysis: ML Xu
Investigation: ML Xu, CY Wu
Writing – original draft: ML Xu, CY Wu
Writing – review and editing: ML Xu, N Liu, HL Luo
Supervision, project administration and funding acquisition: YJ Zhang, N Liu
Funding statement
This work was supported by the National Natural Science Foundation of China (32192463. 32192460) and the Strategic Priority Research Program of the Chinese Academy of Sciences (grant no. XDA26010302).
Competing interests
The authors declare there are no conflicts of interest.
Ethical standards
Animal experiments obtained permission from the China Agricultural University Laboratory Animal Welfare and Animal Experimental Ethical Committee (approval no. AW52603202-5-1).