

1 Introduction
The demographic transition that has taken place in the last decades has severely challenged pension systems around the world. In many countries, the effect has been to introduce reforms, whose ultimate outcome has been to increase the retirement age and cut pension benefits. There is a body of evidence showing that a reduction in benefits increases saving and private wealth accumulation, although at a rate considerably less than one-for-one. Feldstein (Reference Feldstein1974) and Feldstein and Pellechio (Reference Feldstein and Pellechio1979) estimated the displacement effect of pension wealth on national saving using respectively US time series and microeconomic data. Since then, a number of studies have exploited individual level data to provide evidence on the degree of substitution between discretionary accumulation and pension wealth in the US and other countries (Gale, Reference Gale1998; Bernheim, Reference Bernheim, Alan and Martin2002). Another set of studies exploits the exogenous innovations induced by pension reforms to estimate the effects of changes in social security wealth on private accumulation. Attanasio and Brugiavini (Reference Attanasio and Brugiavini2003) find that the reduction in pension wealth induced by the 1992 Italian pension reform increased savings rates. Attanasio and Rohwedder (Reference Attanasio and Brugiavini2003) obtain similar results based on UK data. Bottazzi et al. (Reference Bottazzi, Jappelli and Padula2006) find that the 1992 and 1995 pension reforms in Italy increased the household wealth–income ratio.
Despite evidence on the extent of the offset of private and pension wealth, there are no empirical studies on the portfolio effect of pension reforms on the allocation of wealth. To the extent that reforms affect both how much people save and also the mix of assets in household portfolios, simply estimating the wealth effect of pension reforms might provide a misleading picture of the long-term impact of pension reforms.
Since financial and real assets are imperfect substitutes, the amount of wealth that can be converted into consumption depends on the composition of the household's portfolio. Therefore, pension reforms affecting the household's asset mix will also affect the amount of wealth that can be spent down during retirement. In fact, the cost of converting wealth into consumption will differ in terms of financial assets (readily available for consumption) and real assets (which can be converted in consumption at a cost, but provide liquidity if real estate generates an income flow for the owner via rents or, for the owner-occupier, by not having to pay rents). Consumable wealth, therefore, could increase or decrease, depending on the impact of the reforms on financial and real assets. Furthermore, understanding which component of private wealth is more responsive to changes in pension wealth contributes to the design of policies to encourage retirement savings by households that currently are not saving enough for retirement.
In this paper, we relate expected social security wealth to financial and real wealth, and estimate the displacement effect of pension reforms on various components of private wealth, including risky and safe financial assets, real estate, and business wealth. In trying to account for the displacement effect, we investigate also the effect of innovations in social security wealth on financial market participation in pension funds, life insurance, and ownership of real and financial assets.
We focus on Italy, where there were three major pension reforms in the 1990s, and use data from the Survey of Household Income and Wealth (SHIW), a large representative survey of the Italian population carried out by the Bank of Italy. The use of Italian data provides several advantages. First, the pension reforms in Italy have dramatically reduced pension benefits for young cohorts, but left a group of workers essentially unaffected, thus providing the exogenous variation that we exploit to identify the displacement effect and to instrument social security wealth. Second, the SHIW elicits information on individual expectations of retirement age and replacement rate, which allows us to compute a measure of expected social security wealth and to assess the degree of households' awareness of pension reforms by comparing statutory with expected social security wealth. We are particularly interested in testing whether the portfolio effect of pension reforms depends on the extent of information on pension matters. Third, SHIW data offer a complete picture of the composition of Italian households wealth, allowing us to study which wealth component has been most affected by the reforms. Finally, the data are available for a long time span, which allows us to focus on the long-run effect of pension reforms. To the extent that workers take time to understand the rules implied by the new pension regime, it should be easier to detect an effect in the long run.
We find that a reduction in social security wealth by the equivalent of one year's income has been followed by an increase of seven months' income in real assets and an increase in safe financial assets of one month's income. We also show that the response is stronger among households that are able to estimate social security benefits more accurately. Overall, we estimate that for the average household, the reforms have produced a reduction of 45,000 euro of social security wealth, which has prompted an increase of 20,000 euro of consumable wealth. Another response has been to increase the retirement age, in part by choice, in part as direct consequence of the reforms. Since current demographic projections indicate increased life expectancy, a higher retirement age does not necessarily translate into shorter retirement. Thus, our estimates suggest that the adequacy of savings will be an important issue for future generations of pensioners.
The paper is organized as follows. Section 2 discusses Italian pension reforms and their effect on social security wealth. Section 3 describes trends in the two main wealth components, financial and real wealth, for different cohorts and employment groups. Since the effects of the reforms differ across these groups, one might expect that the most affected groups will exhibit the largest financial and real wealth adjustments, which is what our findings would suggest. In order to understand whether this is due to the changes in social security wealth following the reforms, in Section 4 we estimate the displacement effect between social security wealth and several components of private wealth. The results highlight that real estate wealth has responded more than other asset categories, and that an increase in financial market participation accounts for only a minor component of the increase in private wealth. Section 5 summarizes our main findings and draws some implications for policy by relating them to the debate on the adequacy of savings.
2 The Italian pension reforms
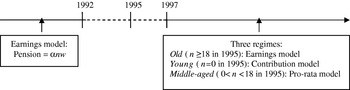
In the 1990s, the Italian social security system was changed by a sequence of radical reforms. These reforms increased retirement age and minimum years of contributions for pension eligibility, and introduced a gradual reduction in pension benefits. However, not all workers were affected by these changes. For older workers, with at least 18 years of contributions in 1995, the generous pre-reform provisions were maintained within an earnings model. This meant that for this group of workers – the ‘old’ – pension benefits were still proportional to the last years' salary. Younger workers, however, saw their benefits substantially reduced. For those who entered the labour market after 1995 (the ‘young’), their pension benefits are computed according to a contributions model, which makes benefits dependent on contributions, the rate of growth of the economy, and retirement age. For those who entered the labour market before 1995, but had less than 18 years of contributions as of 1995 (the ‘middle aged’), a pro-rata model is applied, which combines the contributions and the earnings model and weights it according to the number of years of contributions before the reforms. The change in pension rules has also affected private sector, public sector and self-employed workers differently. For the old age pensions, retirement age rises progressively to 65 for males and 60 for females in the new regime; for seniority pensions, early retirement is penalized by increasing the minimum years of contribution for those retiring before the age of 57.
Figure 1 summarizes the main changes in the pension award formula after the reforms, and shows that a multiplicity of regimes applies after the transitional years. Brugiavini (Reference Brugiavini, Jonathan and David1999) gives further details on the pension reforms and Bottazzi et al. (Reference Bottazzi, Jappelli and Padula2006) provide an extended description of groups of workers identified by the reforms and their pension formulae. In this paper we focus on two regimes, the pre-reform and the post-reform, and on ‘old’ and ‘middle-aged’ workers since the ‘young’ are not observed pre the reforms.
The Italian pension reforms: the pension award formula

2.1 Estimating social security wealth
We estimate the ratio of social security wealth and disposable income from individual expectations of retirement age and replacement rate. For this, we exploit the SHIW, which elicits information on expected retirement and replacement rates through the following two questions.
• When do you expect to retire?
• Think about when you will retire, and consider only the public pension (that is, exclude private pensions, if you have one). At the time of retirement, what fraction of labour income will your public pension be?
These questions apply to 1989–91 (three years before the first pension reform) and 2004–06 (six years after the third reform). We focus on the group aged 20–50, including individuals born between 1939 (who were 50 years old in 1989) and 1986 (20 years old in 2006). We exclude the unemployed, retired people, and other individuals not in the labour force, leaving a sample of workers who are employed or self-employed in the survey years in the sample. We define as the pre-reform period the pooled 1989–91 sample, and as post-reform period the pooled 2004–06 sample. Using subjective expectations, we compute expected social security wealth for 17,628 individuals observed between 1989 and 2006; details are provided in Bottazzi et al. (Reference Bottazzi, Jappelli and Padula2006) . Statutory social security wealth is computed by applying the relevant pension rules to obtain the replacement rate for each worker, using their reported year of entry into the labour market to estimate years of contributions and assuming that individuals will retire at their reported expected retirement age.
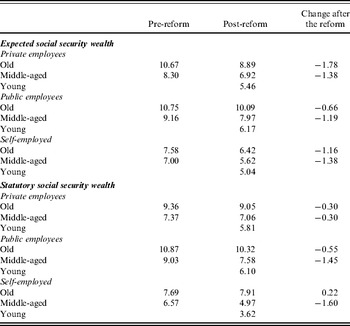
Table 1 presents expected and statutory social security wealth for male workers in three occupational groups (private sector employees, public sector employees, self-employed). In general, there is a good match between expected and statutory rates. The reduction in pension wealth after the reforms is more pronounced for middle-aged public employees and self-employed individuals; older private sector employees are virtually unaffected in that statutory social security wealth is very similar before and after the reforms. (While the young were not in the labour market before the reforms and therefore no direct comparisons can be made, it should be noted that after the reforms, statutory social security wealth is quite low for this group.)
Expected and statutory social security wealth before and after the pension reforms

Note. The statutory social security wealth, normalized by (annual) disposable income, is computed on the basis of legislation and a given retirement age. Both expected and statutory replacement rates refer to male workers. The pre-reform and post-reform periods are, respectively, 1989–91 and 2004–06. Old, middle-aged, and young refer, respectively, to workers with more than 18 years of contributions in 1995, less than 18 years of contributions in 1995, and those that did not start working until after 1995.
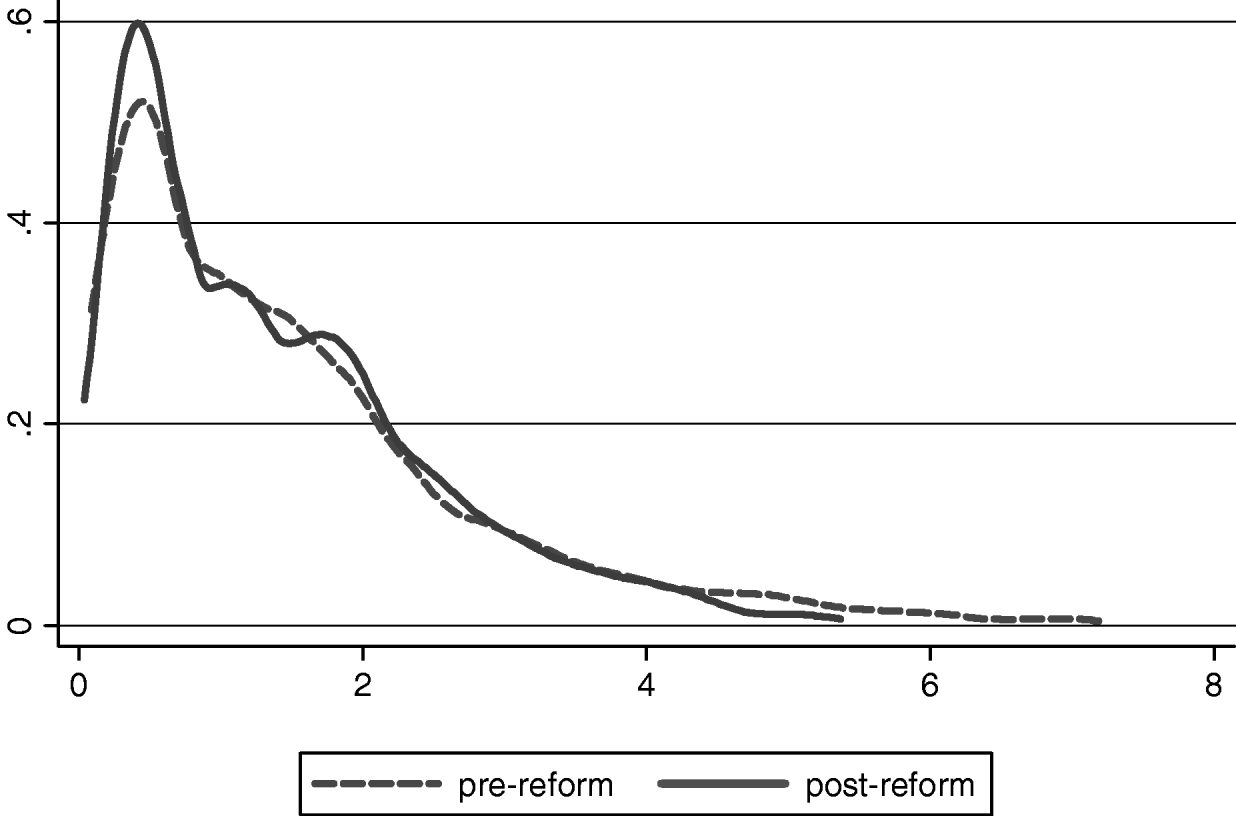
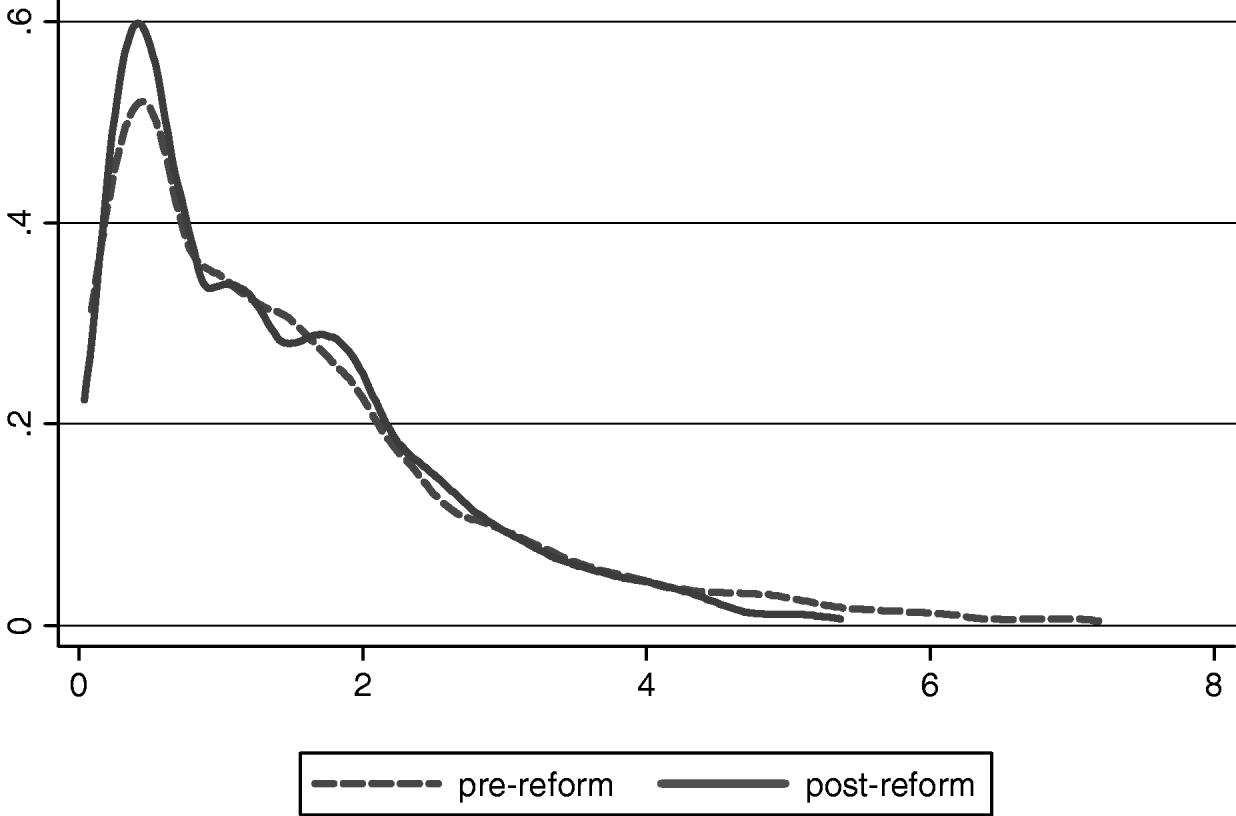
Using the same data, we can define the expectation error as the absolute value of the difference between statutory and expected social security wealth to disposable income ratio. Figure 2 plots the cross-sectional distribution of the absolute value of the expectation error before and after the reforms. Although on average, expected social security wealth is close to statutory wealth, the expectation error of the social security wealth–income ratio is sizeable: the average is 1.57 before the reforms and 1.41 in the post-reform period. This implies that for about half of the sample, expected social security wealth (in absolute value) exceeds statutory wealth by about 18%, and for a quarter of the sample by 23%. Since the response to changes in pension wealth depends on the degree to which people are able to understand the rules of the social security system, in the empirical analysis we find it useful to split the sample between ‘Informed’ households (the expectation error is below the median) and ‘Uninformed’ households (the expectation error is above the median) and to check for the stability of the coefficients in the two groups.
Expectation error distribution of social security wealth before and after the reforms
2.2 Pension reform and allocation of retirement savings
In a standard life-cycle framework, households compensate for a reduction in social security wealth by saving more in order to maintain their consumption unchanged during retirement. In a context of complete markets, it would not matter which assets households buy to compensate for the reduction in social security wealth: all assets have the same risk-adjusted return. However, to the extent that households are borrowing (and short-sale) constrained, and face uninsurable risks and transaction costs, the effects of reducing future social security benefits might differ according to the particular asset bought.
Italian pension reforms have reduced replacement rates and social security wealth at retirement, which, according to the life-cycle model, requires households to increase their discretionary saving for retirement. To illustrate the effects of pension wealth on portfolio allocations, suppose that households can invest their wealth in safe and/or risky assets. If preferences exhibit constant relative risk aversion (CRRA), changes in social security wealth should not affect portfolio rules (see Samuelson, Reference Samuelson1969; Merton, Reference Merton1969). If labour income is included, the portfolio rule changes with age, even if income is not uncertain (Merton, Reference Merton1971). The analysis is made more complicated if income risk is not insurable and households face borrowing (and short selling) constraints. In this case, Cocco et al. (Reference Cocco, Gomes and Maenhout2005) show that portfolio rules become a function of age and wealth even in a CRRA framework. Thus, cuts in pension benefits have the potential to alter the portfolio allocation rule. How the rule changes depends on the age at which the reduction in social security wealth is announced (or perceived) and on the shape of the age–income profile. This is because the share of wealth invested in the risky asset is lower for households closer to retirement, and decreases with wealth at a rate that varies non-monotonically with age.
To understand the possible effects of the pension reform on portfolio choices, we need to take account that individuals invest a substantial fraction of their wealth in housing. Housing price risk might crowd out stockownership (Cocco, Reference Cocco2005), but also may serve as a hedge against rent risk (Sinai and Souleles, Reference Sinai and Souleles2005). Therefore, if the increase in private wealth brought about by the reform triggers an increase in housing wealth, the share of wealth invested in risky assets, such as stocks, might decrease or increase depending on whether the crowding out or the hedge effects dominate. On the other hand, if housing wealth is not annuitizable, households might not choose to increase the share of wealth invested in housing after a pension reform. Transaction costs might have a similar effect and discourage households from investing in the housing market.
So far we have assumed that the pension reforms simply reduced the level of social security wealth at retirement. However, this is not the only effect of the reforms, which could also affect the risk for future benefits. This effect is potentially important, because social security contributions are mandatory and pension risk is not avoidable: in this sense, wealth is like human capital, and its risk plays the role of background risk. To the extent that reforms have reduced the risk associated with social security wealth, households might invest a larger share of their wealth in risky assets.
Whether or not the Italian reforms have reduced the riskiness of social security wealth is open to discussion. By reducing the imbalances in the social security system, reforms have reduced the risk of future defaults, thus making pension benefits less risky than in the pre-reform regime. Moreover, in the new contribution model, pension benefits depend on the entire life-time earnings profile; depending on the timing of income shocks, this can reduce the risk of future benefits. However, the new contribution formula links replacement rate and social security wealth to a larger set of risks, including aggregate and demographic risks. This makes the new schemes potentially more risky than the old. In summary, there are many reasons to believe that pension reforms might have affected portfolio rules, but the direction of the effects is a priori ambiguous, making empirical analysis of the portfolio effect of pension reforms more interesting.
3 Trends in financial and real wealth
Since the effects of the reforms differ across cohort-employment groups, one might expect that the most affected groups will also exhibit the largest financial and real wealth adjustments. To investigate this possibility, we normalize financial and real wealth by disposable income and compute average financial and real wealth before and after the reforms, for the old, the middle aged, and the young, for three employment groups (private and public employees and self-employed).
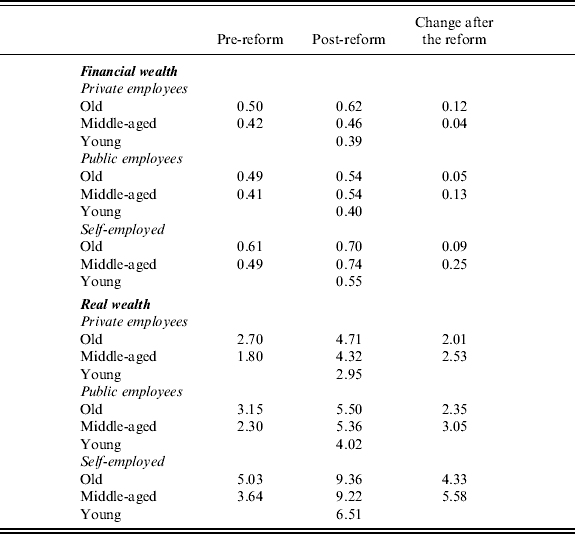
Table 2 shows that financial and real wealth increase after the reforms. The increase is more pronounced for the middle-aged (particularly middle-aged self-employed, which, according to Table 1, is the group most affected by the reforms), but non-negligible for old, private employees, a group that is relatively unaffected by the reforms. Furthermore, changes in real wealth are larger than changes in financial wealth in absolute and relative terms. For the middle-aged self-employed, financial wealth increases by a quarter of annual income in absolute terms, and by 50% in relative terms; real wealth increases by more than five times annual income in absolute terms, and by 150% in relative terms.
Financial and real wealth before and after the pension reforms
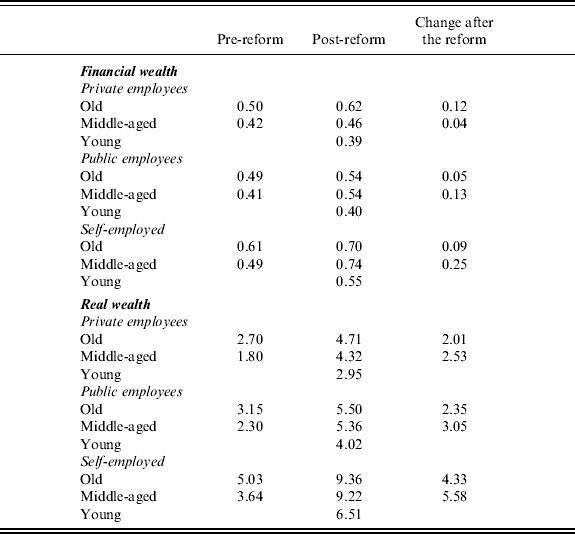
Note. Financial and real wealth are divided by annual disposable income. The pre-reform and post-reform periods are, respectively, 1989–91 and 2004–06. Old, middle-aged, and young refer, respectively, to workers with more than 18 years of contributions in 1995, less than 18 years of contributions in 1995, and who started working after 1995.
In Table 2, one could compute the ‘difference-in-difference’ among employment groups. Since old private employees are unaffected by the reforms, the wealth difference after reform for the middle-aged should be attributable to the reforms. This would imply that the effect of the reforms on financial wealth for the middle-aged self-employed is 50 days of income, while the effect on real wealth is more than three times annual income. For middle-aged public employees the effects are smaller, close to zero for financial wealth and about one year's income for real wealth.
But this back-of-the-envelope calculation is not conclusive about the effect of the reforms because it does not consider other variables that might induce shifts in the composition of employment groups after the reforms. We know that stock market participation differs across education and income groups, and it would be useful to measure changes in wealth after the reforms for given education and income groups. Age affects portfolio decisions; for instance, after a pension reform individuals close to retirement might not increase stockholding at the same rate as the young. Macro shocks also shape household portfolios differently over time; examples include the stock market crash of the early 2000s and subsequent recovery, the decline in yields on short-term government bonds after the introduction of the euro, and the recent house price boom.
To gain further insights into the portfolio effect of pension reforms, in the next section we explore the link between the various components of private wealth and social security wealth in a regressions framework that exploits the exogenous variation in social security wealth brought about by the reforms.
4 Pension reforms and portfolio choices
As shown in Section 2, the Italian pension reforms in the 1990s reduced social security wealth for most households. The reduction is most dramatic for the young and the middle-aged, and self-employed people. In Bottazzi et al. (Reference Bottazzi, Jappelli and Padula2006), we show that this reduction has prompted an increase in private wealth among those most affected by the reforms (middle-aged public employees and the self-employed), with better understanding of the new pensions regime. But finding an overall displacement effect between private wealth and social security wealth is only part of the story. Do households react to a pension reform by increasing the liquid component of their wealth? Are they taking more or less risk after the reform? What is the demand for targeted retirement saving?
To answer these questions, we analyse the offset between social security wealth and the two main components of private wealth: real and financial assets. We then consider different components of wealth and different sample splits, defined on the basis of households' level of understanding about future benefits. Finally, we focus on ownership of stocks, mutual funds, real estate, business wealth, private pension plans and life insurance.
4.1 Econometric model
Our empirical specification relates the ratio of financial or real assets to the ratio of social security wealth and disposable income and to a set of observable variables potentially affecting portfolio choice. More specifically, we denote the ratio of financial (real) wealth to income for household i at time t by y it* in the following specification:

where SSWY it is the ratio of expected social security wealth at retirement (evaluated at time t) to disposable income, X it is a vector that includes a constant term, age of household head, region and education dummies, disposable income, employment dummies, a dummy for middle age and its interaction with employment dummies, plus interactions between employment dummies and a post-reform dummy; θt includes year dummies.Footnote 1 Age, income, and education are proxies for lifetime earnings, while year dummies capture macroeconomic effects.Footnote 2 Regional dummies control for differences in wealth across Italian macro-regions. To capture differences in wealth accumulation and portfolio choice by employment status, the estimated equation includes also dummies for whether workers are employed in the public sector, the private sector, or are self-employed. Since employment status may have changed between 1989–91 and 2004–06, we interact the employment status dummies with a time dummy for the post-reform period. Similarly, portfolio choice may be different for employees of different seniority; therefore, we interact the employment status variables with a dummy for middle-aged employees.
Recalling that the pension reforms identify three age groups (‘old’, ‘middle-aged’, and ‘young’), and that the ‘young’ group cannot be used to evaluate the effect of the reforms as they entered the labour market after 1995, the choice to include the middle-aged in our controls is associated with our use of ‘old’ as the reference group and dropping ‘young’ from the analysis. To focus on the long-run effects of the reforms, we omit the transitional period and estimate the model merging four surveys (1989–91 and 2004–06). Demographic variables refer to household head, defined as the higher earning partner. We limit the sample to people of working age, dropping the 50+.
The expected social security wealth–income ratio is adjusted by the factor suggested by Gale (Reference Gale1998), which considers the number of years of contributions to the social security system as well as when in an individual's life cycle the pension reform was introduced. The adjustment depends on the utility function chosen for the underlying life-cycle model and the values of the discount rate, the interest rate and the time preference rate. We assume a utility function with constant relative risk aversion and set the discount and interest rates to 2% (for details see Bottazzi et al., Reference Bottazzi, Jappelli and Padula2006).
In the estimation we adopt an instrumental variables (IV) approach to deal with the potential endogeneity of social security wealth with respect to portfolio decisions. The endogeneity is due to unobserved factors which affect both productivity and portfolio decisions. For instance, if there is a correlation between thrift and hard work, people with these traits might choose to retire later, with more accumulated pension wealth and invest in long-term savings instruments. We rely on the variability introduced by the reforms to construct a measure of statutory social security wealth as an instrument for expected social security wealth. Statutory wealth is correlated with expected pension wealth, but is not affected by either individual preferences or beliefs. In particular, statutory social security wealth depends on the statutory retirement age and legislated replacement rates, which changed after the reforms according to employment and cohort groups. As discussed in Section 2, for old private employees statutory social security wealth was essentially unaffected by the reforms, while the other groups (public employees, self-employed, the young and the middle-aged) were affected and should have revised their expectations downward (as shown in the lower panel of Table 1).
4.2 Wealth allocation
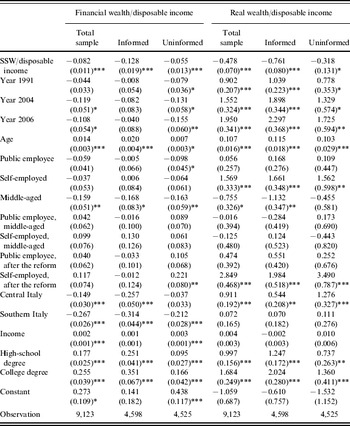
The regressions in Table 3 show that a reduction in social security wealth equivalent to one year's income is associated with an increase in financial wealth of just below one month's income. The coefficient is precisely estimated, a likely consequence of the quality of the chosen instrument.Footnote 3 The estimates also indicate that the financial wealth–income ratio increases with age over the working lifetime (the sample does not include households over 50), is lower in the South of the country, and increases with income and education; the coefficients of the employment dummies are not statistically different from zero. We can check whether information on pension reforms promotes larger wealth adjustments. We do this by splitting the sample on the basis of the difference between statutory and expected social security wealth. We refer to ‘Informed’ and ‘Uninformed’ households for whom the difference (in absolute value) is, respectively, less or more than the median (just above 1). In columns 2 and 3 of Table 3, we find that the offset coefficient is about twice as large for the ‘Informed’ group.Footnote 4
Displacement effect for financial and real wealth – IV estimates

Note. All regressions are estimated by IV; the instrument is statutory social security wealth. Data are drawn from 1989–91 and 2004–06 SHIW. Standard errors are reported in parentheses. *** statistical significance at 0.1% confidence level; ** significant at the 1% level; * significant at the 5% level.
The other columns in Table 3 refer to real wealth. The displacement coefficients are negative and precisely estimated for the total sample, and for both the ‘Informed’ and the ‘Uninformed’ sub-samples. A reduction in social security wealth of one year's income is associated with an increase in real assets of about nine months' income for the ‘Informed’ and just below four months' income for the ‘Uninformed’ group. Overall, the evidence suggests that the effect of the reform is larger on real than on financial assets and is larger for the ‘Informed’ group.Footnote 5
We experiment with alternative definitions of ‘Informed’ and ‘Uniformed’ households. Namely, we define ‘Uninformed’ as those with an expectation error larger than 25% (i.e. expected social security wealth exceeds statutory social security wealth by more than 25%) and as ‘Informed’ those with an expectation error smaller than 25%. The results (not reported here) show that the ‘Informed’ group is more responsive than the ‘Uninformed’. In the financial wealth regressions, the offset is −0.109 (with standard error of 0.012) for the ‘Informed’ and −0.033 (and a standard error of 0.016) for the ‘Uninformed’ group. In the real wealth regressions, the offset is −0.704 (standard error 0.059) and −0.432 (standard error 0.099), respectively, for the two groups. It is of interest to check whether a response of financial or real wealth differs for people who underestimate or overestimate their perceived social security wealth with respect to statutory social security wealth. The results suggest that the pessimistic group (the group whose expected social security wealth is lower than the statutory social security) has a higher offset compared to the optimistic group.Footnote 6
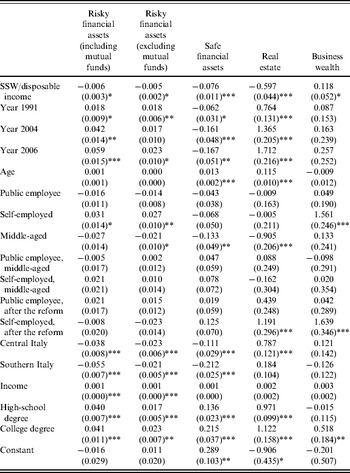
Table 4 breaks down financial wealth into ‘risky’ and ‘safe’ financial assets, and real wealth in real estate and business wealth. Risky financial assets include stocks held directly or indirectly through mutual funds and other investment accounts; safe financial assets include corporate and government bonds and transaction accounts. In the first two columns of Table 4 the displacement coefficients are negative, statistically different from zero, but small in size. In line with previous studies, we find that stockholding is positively correlated with income and education, and is lower in Central and Southern Italy (Guiso et al., Reference Guiso, Haliassos and Jappelli2003).
Displacement effect for financial and real wealth components – IV estimates

Note. All regressions are estimated by IV; the instrument is statutory social security wealth. Data are drawn from 1989–91 and 2004–06 SHIW (9,123 observations). Standard errors are reported in parenthesis. *** statistical significance at 0.1% confidence level; ** significant at the 1% level; * significant at the 5% level.
The results in column 3 of Table 4 indicate that the displacement effect is stronger for safe financial assets (−0.076) than for risky financial assets. The income coefficient is not statistically different from zero; safe assets increase with education and are lower in the Centre and in the South. Distinguishing further between corporate bonds, Treasury Bills, and transaction accounts reveals that demand for corporate bonds was not affected by the pension reforms. Instead, reducing social security wealth by one year's income is associated with an increase in demand for Treasury Bills of about ten days' income (six days for transaction accounts). For reasons of space, these results are not reported here.
The remaining columns in Table 4 refer to real estate and business wealth. The effect of social security wealth on real estate (−0.597) is negative and statistically different from zero, in line with the predictions of the life-cycle framework. In the regression for business wealth, the coefficient is positive (0.11) and statistically different from zero at the 10% level.
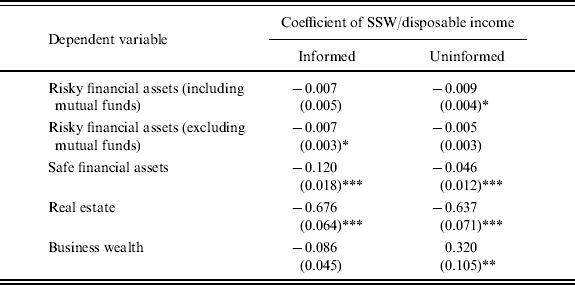
To explore the effect of people's awareness of pension reforms, in Table 5 we repeat the estimation distinguishing between ‘Informed’ and ‘Uninformed’ households. We report only the displacement coefficients of social security wealth and the various wealth components. Table 5 suggests that the differences between the two groups in relation to risky assets and real estate are not large, while the differences are large and statistically significant for safe financial assets (−0.120 for ‘Informed’ and −0.046 for ‘Uninformed’). The results for business wealth show a statistically significant effect only for the ‘Uninformed’ group (0.320). The effect for this group of households is hard to reconcile with the standard life-cycle model, where a reduction in pension wealth should be associated with an increase in private wealth.
Displacement effect for financial and real wealth components – IV estimates: sample splits for Informed and Uniformed households
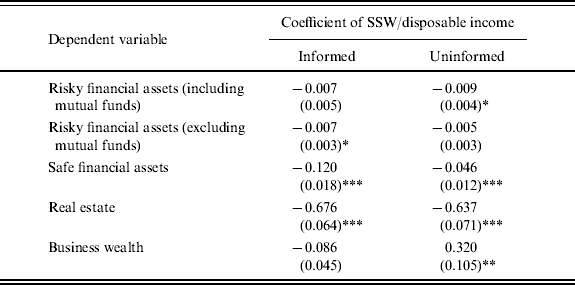
Note. The ‘Informed’ group includes household where the expectation error in social security wealth is less than the median. The ‘Uninformed’ group includes those for whom the expectation error is greater than the median. Each regression also includes time effects, age, and dummies for employment, cohort, interactions of employment cohort and post-reform, area of residence, income, and education. All regressions are estimated by IV; the instrument is statutory social security wealth. Data are drawn from 1989–91 and 2004–06 SHIW (4,598 in the Informed group and 4,525 observations in the Uninformed group). Standard errors are reported in parentheses. *** statistical significance at 0.1% confidence level; ** significant at the 1% level; * significant at the 5% level.
4.3 Asset ownership
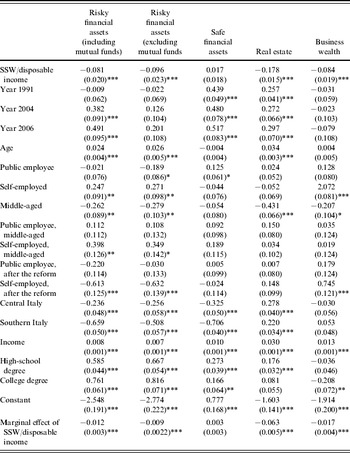
People can respond to the pension reforms by adjusting wealth levels and by changing their ownership of particular assets. The first column in Table 6 reports IV probit regressions for direct and indirect stock market participation, using the same specification as in Tables 4 and 5. The instrument for expected social security wealth is again statutory social security wealth, imputed from legislation in 1989–91 and 2004–06. The results suggest that the probability of investing in stocks is negatively associated with social security wealth, but the marginal effect reported in the last row is small: −0.012 for total stockholding and −0.009 when only direct stockholding is considered. The positive effect of income and education on stock market participation is consistent with previous evidence (Guiso et al., Reference Guiso, Haliassos and Jappelli2003).
Ownership of financial and real assets – IV probit estimates

Note. All probit regressions are estimated by IV; the instrument is statutory social security wealth. Data are drawn from 1989–91 and 2004–06 SHIW (9,123 observations). Standard errors are reported in parentheses. *** statistical significance at 0.1% confidence level; ** significant at the 1% level; * significant at the 5% level. The last two rows report the marginal effects of the social security wealth to disposable income ratio and the standard errors.
Ownership of safe financial assets is not related to social security wealth (column 3), because the vast majority of households had transaction accounts before and after the pension reforms. The two final columns in Table 6 report probit regressions for the propensity to invest in real estate and business wealth. Both variables are negatively correlated with social security wealth, and the marginal effect in absolute value is higher for real estate than for business wealth (−0.063 and −0.017 respectively).
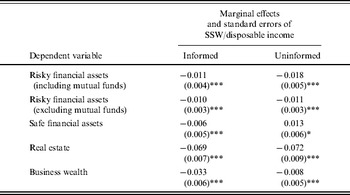
Table 7 again splits the sample according to households' information. For stockholding, the marginal effects of social security wealth are similar for the two groups: −0.011 for total stockholding and −0.010 for direct stockholding for the ‘Informed’ group, and −0.018 and −0.011, respectively, for the ‘Uninformed’.Footnote 7 For safe financial assets the marginal effects are negative for the ‘Informed’ (−0.006) and positive (0.013) for the ‘Uninformed’. The effects on propensity to invest in real estate are similar for the two groups (−0.069 for the ‘Informed’ and −0.072 for the ‘Uninformed’), while the effect on the propensity to invest in business wealth is larger for the ‘Informed’ group. Overall, the results for asset ownership suggest that the response to pension reforms is larger for real assets, and that the differences between the ‘Informed’ and ‘Uninformed’ groups are relatively small.
Ownership of financial assets (IV Probit estimates): sample splits for informed and uninformed households

Note. The ‘Informed’ group includes households where the expectation error in social security wealth is less than the median. The ‘Uninformed’ group includes those for which the expectation error is greater than the median. Each regression also includes time effects, age, and dummies for employment, cohort, interactions of employment cohort and post-reform, area of residence, income, and education. All models are estimated by IV; the instrument is statutory social security wealth. Data are drawn from 1989–91 and 2004–06 SHIW (4,598 observations in the Informed group and 4,525 observations in the Uninformed group). Standard errors are reported in parentheses. *** is statistical significance at 0.1% confidence level; ** significant at the 1% level; * significant at the 5% level.
4.4 Life insurance and pension funds
Analysis of the effect of pension reforms on the portfolio allocation of private wealth ideally should also consider savings targeted at retirement, such as private pension plans and life insurance policies. Our data contain only information on ownership, not the market value of such products, which is the reason why it is dealt with at this stage in the analysis.
In the last two decades, repeated pension legislation changes have been aimed at encouraging the development of pension funds and life insurance in what appears to be an ‘infant industry’ in Italy (Fornero et al., Reference Fornero, Fugazza and Ponzetto2004). Favoured fiscal treatments of contributions to life-insurance policies were introduced in 1986, and later extended to pension fund contributions.Footnote 8 How effective these measures have been is an open question, although the evidence in Jappelli and Pistaferri (Reference Jappelli and Pistaferri2003) suggests that tax incentives have not been effective in stimulating households' propensity to invest in retirement savings instruments. Here, we address a related question: that is, whether the reduction in social security wealth brought about by the reforms has increased the propensity to invest in savings plans targeted to retirement. We run IV probit regressions for the propensity to invest in pension plans and life-insurance, maintaining the same specification as for ownership of other assets.
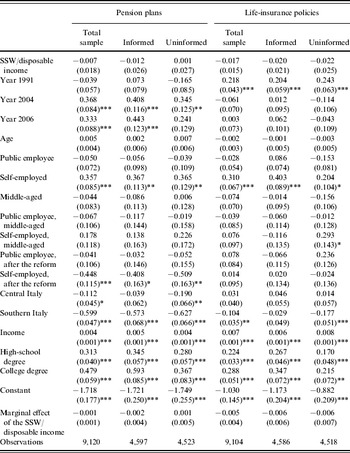
The first three columns in Table 8 focus on private pension plans. The regression coefficients indicate that the demand for private pension plans is higher among the self-employed, and in Northern Italy, and that it increases with income and education. The coefficient and marginal effect of the ratio of social security wealth to disposable income are not statistically different from zero. Splitting the sample between ‘Informed’ and ‘Uninformed’ households does not change the overall picture. The remaining columns in Table 8 refer to ownership of life-insurance.Footnote 9 The results are similar to those for pension plans: the association with social security wealth is not statistically different from zero and the effects of the other variables (income, education, region of residence) are also similar.
Ownership of pension plans and life-insurance – IV probit estimates

Note. The ‘Informed’ group includes households where the expectation error in social security wealth is less than the median. The ‘Uninformed’ group includes those for which the expectation error is greater than the median. All probit regressions are estimated by IV; the instrument is statutory social security wealth. Data are drawn from 1989–91 and 2004–06 SHIW. Standard errors are reported in parentheses. *** is statistical significance at 0.1% confidence level; ** significant at the 1% level; * significant at the 5% level. The marginal effects of the social security wealth to disposable income ratio and the standard errors are reported in the 2nd and 3rd rows from the bottom of the table.
Overall, the results in Table 8 suggest that pension reforms are not associated with an increase in households' propensities to invest in assets targeted towards funding retirement. This finding is in line with other evidence: Cesari et al. (Reference Cesari, Grandi and Panetta2008) suggest that the poor development of the ‘third pillar’ in Italy is a consequence of high social security contribution rates. Bottazzi et al. (Reference Bottazzi, Jappelli and Padula2006) refer to lack of financial education and lack of information on pension matters as a reason for the poor savings response to pension reforms. Cesari et al. (Reference Cesari, Grandi and Panetta2008) point out that discontinuous careers and limited labour market participation account also for the low take-up of pension funds among young workers, and women. Finally, due to the high cost of annuities, most Italian households consider life insurance contracts as a financial investment rather than as an insurance contract to protect against longevity risk.Footnote 10 According to Guazzarotti and Tommasino (Reference Guazzarotti and Tommasino2008), the money–worth ratio (the ratio between present annuity payments value and the premium paid to the insurer), is at most 84% for a private life insurance contract, while the ratio is around 100% for social security benefits.
5 Summary and policy implications
Pension reforms have dramatically reduced the social security wealth of certain groups of Italian households, and especially the self-employed, public employees and workers with less than 15 years' contributions in 1995, while older workers have been insulated from the changes. Our objective was to investigate how changes in expected social security wealth have affected households' portfolio allocations. We used data from the Bank of Italy SHIW, a large representative sample of the Italian population, available for 1989 to 2006, and constructed expected social security wealth using individual subjective beliefs about social security benefits after retirement. We acknowledge the potential endogeneity of the constructed measure of expected social security wealth, which depends on observed and unobserved households' characteristics. Accordingly, we adopted an IV approach, using social security wealth computed from current legislation as the instruments. The pension reforms provide the variability in our constructed measures of expected and statutory social security wealth, which allows us to identify the effects of pension reform on household portfolios.
Our indicators of social security wealth also allow us to investigate how the portfolio response to these pension reforms depends on the degree of uncertainty about social security benefits. Our findings suggest that Italian households have responded to a reduction in pension wealth brought about by the reforms, by investing more in real assets and in safe financial assets. In particular, a reduction in social security wealth by the equivalent of one year's income has been followed by an increase equivalent to seven months' income in real assets and an increase in safe financial assets of one month's income. The regression estimates reveal other interesting results. First, the response is stronger among households that are able to estimate future social security benefits more accurately. Second, there is a negligible effect on financial market participation after the reforms. Third, despite the fact that pension reforms have reduced pension wealth substantially for a large fraction of workers, we do not observe an increase in the propensity to purchase private pension funds or life insurance.
Since the increase in wealth after the reforms is due mostly to an increase in real estate wealth, essentially substituting an annuity with assets which do not insure against longevity risk and which can be liquidated only at a cost, it is questionable whether, since the reforms, households are preparing adequately for retirement. To set out some of the issues involved, suppose that people wish to annuitize their housing wealth at retirement, which we take to be at the age of 65.Footnote 11 With risk-neutral lenders, the fraction of consumable housing wealth depends on the expected growth in house prices and interest rates. The larger the gap between the expected growth in house prices and interest rates, the larger the amount of housing wealth that can be consumed.
Under plausible assumptions, a 65-year-old male could consume at most 85% of his housing wealth. This is similar to the fraction found by Sinai and Souleles (2008) based on US data in the absence of credit market imperfections.Footnote 12 This implies that the total amount of consumable wealth after retirement is at most 85% of real estate plus financial wealth.Footnote 13 On average, social security wealth for a middle-aged household fell by 45,000 euro after the reforms (1.3 years of disposable income). Since for the average household the real estate wealth–income ratio increased by 0.78 and financial wealth by 0.11, the overall consumable wealth–income ratio has increased by 0.77 (and the level of consumable wealth by 26,600 euro). But the actual increase in consumable real estate wealth is likely to be much lower, due to credit market imperfections and informational asymmetries in the reverse mortgage and annuity markets. Sinai and Souleles estimate that, in the presence of credit market imperfections, US households could consume about 60% of real estate wealth during retirement. If this more realistic value is applied, the increase in the consumable wealth–income ratio after the reforms shrinks to only 0.58 (and the level of consumable wealth to 20,000 euro).
Our results have four main implications. First, although Italian households seem to be aware of the effect of pension reforms on replacement rates and social security wealth, there is a considerable gap between expectations and legislated values for pension benefits. Improving information on pension benefits is paramount. A second implication is that the offset between social security wealth and private wealth is considerably less than one-for-one even for well-informed households, so increasing information will not be sufficient on its own to induce households to offset fully the reduction in social security wealth.
The third implication is related to the particular asset mix of Italian households, where real assets, and housing in particular, play a dominant role. Pension reforms have not diminished the propensity to invest in real estate. On the contrary, they have apparently induced additional demand for housing. Will people be able to use this additional wealth to supplement the fall in income after retirement? Our calculations show that pension reforms have reduced the social security wealth of middle-aged workers by about 45,000 euro, and that this reduction is likely to be offset by an increase in consumable private wealth of only 20,000 euro. People will respond to the pension reforms by working longer, in part by choice, in part as direct consequence of the reforms. However, current demographic projections indicate that life expectancy is also increasing, so a higher retirement age will not necessarily translate into a reduction in the length of retirement and, therefore, liquidity needs. Our estimates suggest that the response of private wealth to pension reforms is limited, and that the adequacy of savings will be an important issue for future generations of workers and retirees. The final, and related, implication is that despite a decade of intense legislative efforts, a negligible fraction of the increase in private wealth has been channelled into private pension plans.