I. INTRODUCTION
It is well known that grain size refinement can effectively enhance the properties and performance of the materials. For instance, the materials processed by rapidly solidified powder metallurgy (RS/PM) and severe plastic deformation (SPD) obtain ultrafine grain size and exhibits excellent mechanical properties.Reference Inoue, Kawamura, Matsushita, Hayashi and Koike1,Reference Chen, Chai, Roven, Gireesh, Yu and Hjelen2 At present, it is still a challenge to prepare bulk nanocrystalline materials for structural applications due to some difficulties associated to the complicated process, small sample size, and high processing cost. However, majority of failures in metallic materials such as fatigue fracture, fretting fatigue, wear, and corrosion are initiated from their surface layers. Therefore it would be considerably effective to adopt an approach to enhance the material properties by means of the surface nanocrystallization. Recently, shot peening is an interesting surface treatment method which is potentially very useful in industrial applications as it is simple, flexible, and low cost. In the process of conventional shot peening and modified shot peening, material surface is impacted by hundreds of thousands of pellets repeatedly, causing SPD on the sample surface. This technique has been successfully applied in achieving surface nanocrystallization in a variety of materials including pure metals,Reference Tao, Sui, Lu and Lua3 steels,Reference Liu, Lu and Lu4–Reference Bagherifard and Guagliano7 Al,Reference Cho, Song, Oh, Lee, Lim and Lee8 Mg,Reference Hou, Wei, Shu and Xu9 TiReference Han, Sheng and Hu10 alloys and composite.Reference Xie, Jiang, Lu, Chen and Huang11 It induces grain refinement and residual compressive stress into the surface layer of bulk materials, improving properties and performance of the materials. The studies by other researchers indicate that the properties such as fatigue strength,Reference Drechsler, Dörr and Wagner12,Reference Ochi, Masaki, Matsumura and Sekino13 fretting fatigue resistance,Reference Liu and Hill14 corrosion resistance,Reference Raja, Namjoshi and Misra15 and wear resistance,Reference Mao, Li, Fang, Tan and Jiang16 could be significantly enhanced compared to conventional coarse grain materials.
The 6061 alloy is one of the most widely used aluminum alloys in the 6000 series because of its good mechanical properties, good workability, good weldability, and excellent corrosion resistance. A number of studies have investigated different surface treatment methods such as conventional shot peening,Reference Xiao, Fok and Tint17,Reference Xiao, Fok and Lwin18 ultrasonic shot peening,Reference Rodopoulos and Bridges19 laser shock peening,Reference Sanchez-Santana, Rubio-González, Gomez-Rosas, Ocana, Molpeceres, Porro and Morales20 and oil jet peeningReference Grinspan and Gnanamoorthy21 on 6061 alloy, but none of them has a comprehensive investigation on the nanostructured surface layer induced by shot peening. Therefore, the research objective of this study is to investigate the effects of shot peening on surface morphology, surface layer microstructure, and corrosion resistance of the shot-peened 6061 alloy. The influence of air pressure and shot flow rate on residual stress, surface nanocrystallization, and microhardness of the alloy has been compared and analyzed through a series of observation and property tests. Additionally, electrochemical measurements, scanning electron microscopy (SEM), and energy dispersive x-ray spectroscopy (EDS) are conducted to investigate the effect of shot peening on surface corrosion properties.
II. EXPERIMENTAL
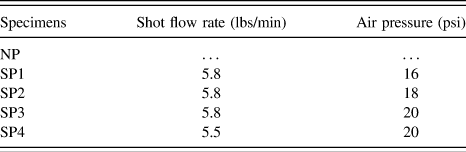
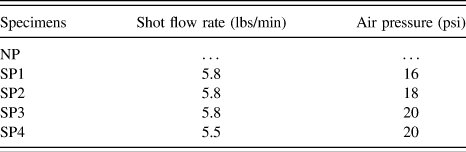
Commercial 6061 alloy rolled sheet with a thickness of 0.8 mm is used in this study. The alloy is solution-treated at 530 °C for 0.5 h and aged at 177 °C for 10 h. The analyzed chemical composition is given in Table I. Several pieces of specimens with dimensions 5 mm × 2 mm × 0.8 mm are cut from a sheet stock of 6061 alloy. Before shot peening, the specimens are placed into an acetone bath and then cleaned with a soft wool fabric. Shot peening pellets used in this study are conditioned carbon steel cut wire shot (CCW14) balls with the diameter of 0.357 mm and the average hardness of pellets is 655 HV. The pellets are discharged from the nozzle at an inclination angle of 45° with respect to the specimen surface. The specimens are shot-peened on one side at a distance of 100 mm to achieve a surface coverage of more than 100%. The specimens are shot-peened at air pressures of 16, 18, or 20 psi and at shot flow rate of 5.5 and 5.8 lbs/min, as shown in Table II.
Chemical composition of as-received 6061 alloy (wt%).

Shot peening parameters of the specimens.
Microhardness of shot-peened specimens is measured by micro Vickers hardness tester (HVS-30P) using a constant 10 g load with a hold time of 10 s. Measurement of surface residual stress is performed by Bruker D8 Discover x-ray diffractometer. Measurement of surface 3D microstructures and determination of surface roughness are performed by Axio CSM 700 confocal microscope from Carl Zeiss. Microstructural evolution is observed by optical microscope (OM, ZEISS Axio Imager A1m), scanning electron microscope (SEM, JEOL JSM-6460 and JSM-7600F, Tokyo, Japan), and transmission electron microscope (TEM, JEOL JEM-2100). Specimens for TEM observation are prepared by cutting thin slices from the specimens, followed by mechanical thinning and finally argon ion milling (Gatan 691 PIPS). Electrochemical measurements are performed using specimens of working area 38.5 mm2 immersed in 3.5 wt% NaCl aqueous solutions at room temperature (20 ± 1 °C). A potentiostat/galvanostat connected to a three-electrode cell is used for the electrochemical measurements. The working electrode is the test specimen, the counter electrode is Pt, and the reference electrode is saturated calomel electrode (SCE) with a potential of 0.197 V with respect to the standard hydrogen electrode. Polarization measurements are carried out at a scan rate of 10 mV/s, from −2.0 to 0 V with respect to the corrosion potential (E corr). The anodic corrosion current density is limited to 5 mA/cm2.
III. RESULTS AND DISCUSSION
A. Residual stresses
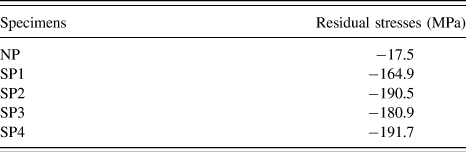
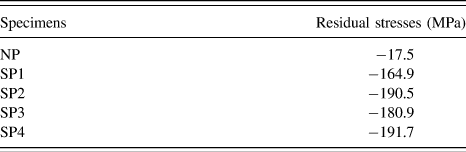
The macroscopic residual stresses on the shot-peened surface determined by XRD for five specimens are shown in Table III. A value of minimal compressive residual stress, −17.5 MPa, is measured in the specimen prior to shot peening treatment. The values of compressive residual stresses in the surface layer for all shot-peened specimens are improved greatly by one order of magnitude compared with that of unpeened one. It can be seen that the residual stress increases from −164.9 to −190.5 MPa with increasing air pressure from 16 to 18 psi. The stress then decreases considerably to −180.9 MPa, not as we have expected, with a further increase in air pressure to 20 psi. The cause that the residual stress of specimen SP3 is lower than anticipated must be related to changes in the surface microstructure. It will be discussed in more detail below. However, the obtained maximum stress value is obtained by parameters with the shot flow rate of 5.5 lbs/min and air pressure of 20 psi.
Surface residual stresses of unpeened and shot-peened specimens.
B. Surface topography analysis
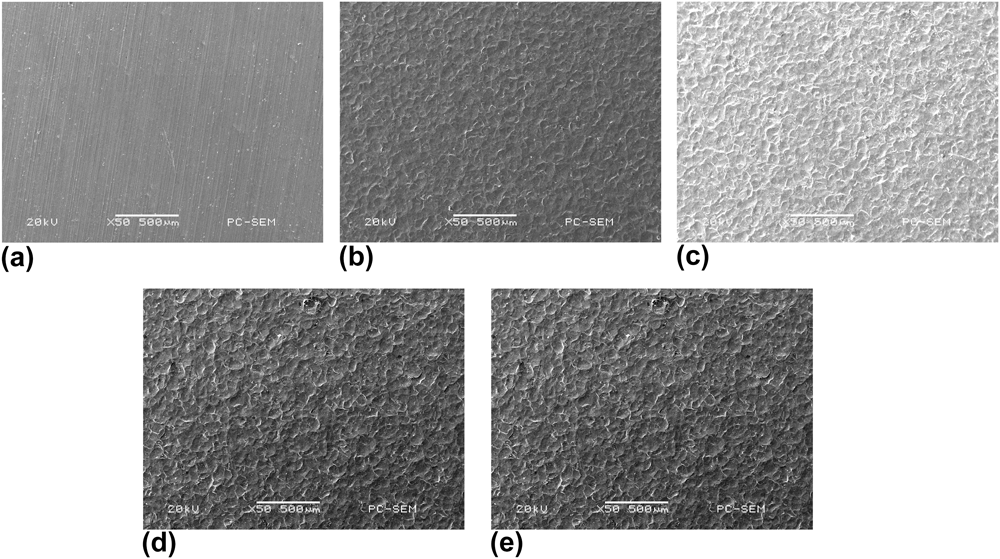
Figure 1 illustrates the SEM images of the surface of the 6061 alloy specimens before and after shot peening. Before shot peening, the roll grinding marks could be seen on the surface of the specimen [Fig. 1(a)]. After shot peening, the roll grinding marks disappeared and the surface of the alloy became rough with clearly visible indentations, as shown in Figs. 1(b)–1(e). A large number of randomly overlapping indentations with no specific texture or preferential direction are observed on the shot-peened surface of specimens. The indentations are of truncated sphere shape. In addition, the plastic deformation rims are formed concentrically around the indentations. It is obvious that the indentation size, both diameter and depth, depends on the air pressure. The increase in air pressure will cause an increase in the indentation size. The surface conditions after shot peening can be described by surface roughness changes, which depend on the chosen shot peening parameters. After the surface treatment by shot peening, surface roughness increases with an increase in the air pressure, with constant shot flow rate.
The SEM images of unpeened and shot-peened surface roughness profiles of 6061 alloy specimens NP (a), SP1 (b), SP2 (c), SP3 (d), SP4 (e).

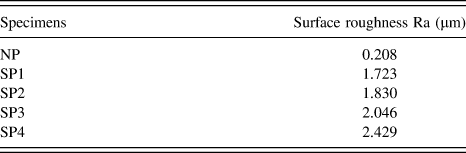
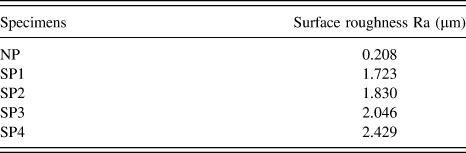
Figure 2 shows the 3D images of all specimens before and after shot peening using the confocal microscopy images. The height information is color-coded with blue indicating low values and red indicating high values. The surface roughness of untreated and treated specimens is given in Table IV. The values of roughness obtained in specimens are consistent with the SEM observations. The as-received specimen in Fig. 2(a) shows a less rough surface than the shot-peened specimens. Its calculated arithmetic-mean value of surface roughness (Ra) is 0.208 μm. The 3D profile in Figs. 2(b)–2(e) shows that the shot-peened specimens are more rough with Ra value from 1.723 to 2.429, i.e., about ten times of that for the unpeened specimen. It is obvious that the roughness increases with increasing air pressure of the shot peening. The value of Ra is increased from 1.723 μm for specimen SP1 to 1.830 μm for specimen SP2 and to 2.046 μm for specimen SP3. Moreover, the results show that by decreasing the shot flow rate from 5.8 to 5.5 lbs/min, while air pressure remains constant, surface roughness even increases from 2.046 to 2.429 μm. The roughness increased markedly as the shot flow rate decreased slightly. The lesser degree of roughness with greater shot flow rate is attributed to increased surface coverage of more than 100% for the treated surface. During shot peening, a new indentation will overlap a previous indentation or even hit a cluster of previous indentations and causes a reduction in the indentation size. This means that a greater degree of overlap between individual indentation formations and lesser surface roughness is achieved with increased shot flow rate.
3D surfaced renderings of specimens NP (a), SP1 (b), SP2 (c), SP3 (d), and SP4 (e) from confocal microscopy.
Surface roughness of unpeened and shot-peened specimens.
C. Cross-sectional observations
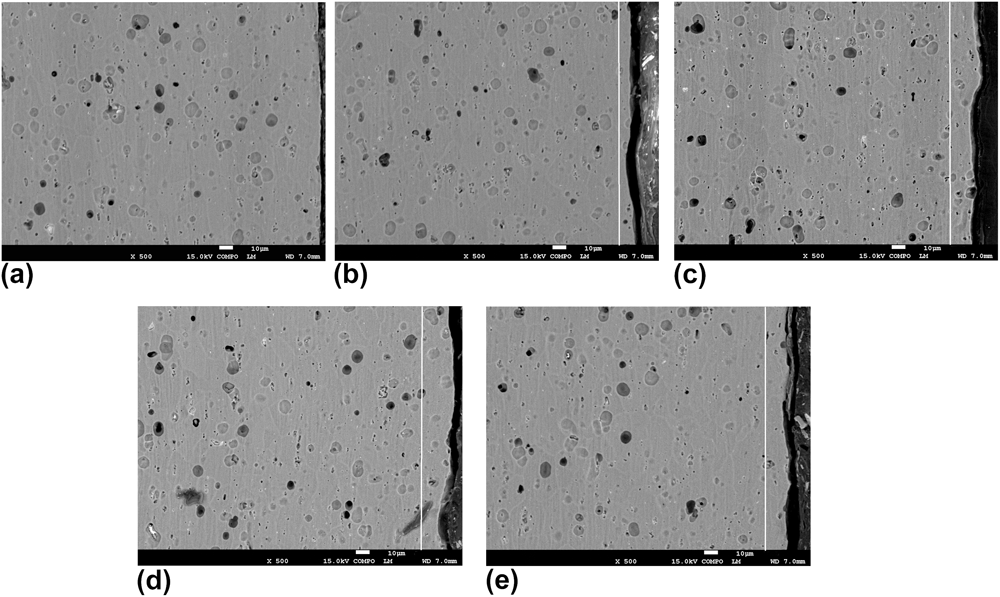
To observe microstructure evolution by shot peening in detail, the unpeened and shot-peened specimens are further confirmed with cross-sectional SEM morphologies in backscattered electron imaging (BEI) mode, as shown in Fig. 3. The original specimen is featured by its homogeneous coarse grain and the grain size is in a range of 15–25 μm [Fig. 3(a)]. The microstructure difference between the surface layers and the layer below the surface (the bulk) can be clearly observed, while these two regions have no sharp boundaries. As illustrated in Figs. 3(b)–3(e), from the overall view of the cross sections in SEM observations, a very small depth of deformed layer is easily recognized on the top surface. The depths of deformed layers in shot-peened specimens SP1, SP2, SP3, and SP4 are about 10, 15, 20, and 15 µm, respectively, as marked in figures with white lines. This surface layer extends up to almost 10–20 μm in depth is considered to be the ultrafine grained layer. SPD is evident in the surface layer, in which grain boundaries cannot be identified in SEM observation as observed in the bulk. However, few ill-defined residual grain boundaries can be observed occasionally. As air pressure increased, the thickness of the deformed layer is increasing due to the more intensive impact. With an increase in the shot flow rate, the deformed layer will be developed and its thickness increases too. However, microstructure of the bulk below the surface layer still consists of original coarse grain. In conclusion, shot peening enables the formation of a surface layer with ultrafine grains at the surface whereas the grains at the bulk remain almost uninfluenced.
Cross-sectional SEM observation of specimens NP (a), SP1 (b), SP2 (c), SP3 (d), SP4 (e).
D. TEM observations
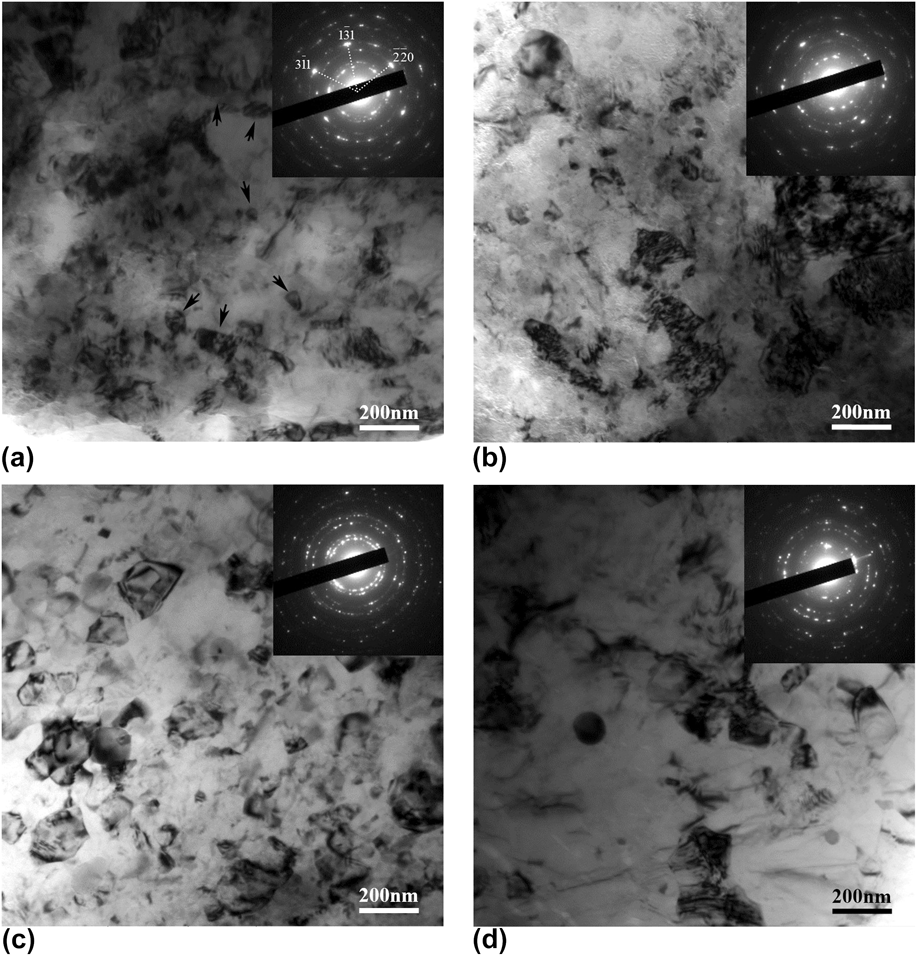
TEM observations are conducted to determine the microstructural evolution and grain size in the surface layer. Figures 4(a)–4(d) show the typical TEM micrographs of the top surface layer of 6061 alloy specimens after shot peening, together with selected area electron diffraction (SAED) patterns. Figure 4(a) shows the representative TEM micrographs of specimen after shot peening by the shot flow rate of 5.8 lbs/min and air pressure of 16 psi. It can be seen that the specimen is dominated by ultrafine grains and the grain boundaries are ill-defined and diffuse in appearance. They are generally interpreted as representative of high energy nonequilibrium boundaries. The high density of dislocation networks and dislocation tanglings are observed inside the grains, and consequently the contrast within the grains is not uniform that indicates a high level of internal stresses and elastic distortions in the crystal lattice. Also there are a number of new fine grains with the reasonably well-defined boundaries have appeared, as shown in the figure with the arrow. The grain refinement is undoubtedly a consequence of dynamic recrystallization (DRX). The corresponding SAED pattern is also presented. As shown in Fig. 4(a), two sets of diffraction spots existed in the SAED pattern as the spots in SAED pattern have two different brightness intensities. According to the diffraction pattern, which shows numerous weaker spots arranged in rings, the ultrafine grains are randomly oriented and have high angle grain boundaries. Several cyclic brighter spots aligned with a major zone axis, which correlates with the [114] zone axis direction of aluminum. It reveals the coexistence of some original coarse grains and nanoscale DRX grains in the alloy.
TEM micrograph of specimens SP1 (a), SP2 (b), SP3 (c), SP4 (d) after shot peening.
In Fig. 4(b), the proportion of recrystallized section is increased compared to specimen SP1. The most grain boundaries are still poorly defined. A great number of dislocation tanglings and dislocation walls are formed inside the grains. Therefore, the inhomogeneously distributed dislocations result in the formation of regions with relatively high dislocation density and regions with relatively low dislocation density, which is the initial stage of the subgrain. The contrast is different among grains, indicating the existence of high internal stresses.
In Fig. 4(c), it is clear that specimen SP3 has a more homogeneous grain structure. After shot peening, it is dominated by the homogeneous equiaxed grains or subgrains with an average grain size below 100 nm. It shows that some grain boundaries are clearly visible, the density of dislocations in the grains is comparatively low, and the contrast within the grains is relatively uniform. These are the typical characteristics of DRX. Indexing the SAED pattern, all diffraction rings in the SAED pattern are identified as only one phase, i.e., fcc aluminum. The ring-like SAED pattern indicates that grain orientation is random, indicating highly misoriented grain boundaries. However, the brighter spots are not observed in the SAED pattern in Fig. 4(a).
Similarly, the microstructure after shot peening by the shot flow rate of 5.5 lbs/min and air pressure of 20 psi is characterized by ultrafine equiaxed grains in the nanometer regime with random crystallographic orientations, as indicated by the SAED pattern in Fig. 4(d). Several brighter spots are also observed in the SAED pattern. The TEM image and corresponding SAED shows that specimen SP4 undergoing lower degree of DRX compared to specimen SP3.
During shot peening, impingement of the pellets on the surface of the specimens induces SPD with high strain during each impact. The dislocation density increases with increasing deformation degree. With increasing strain level and dislocation density, dislocation annihilation and recombination results in the formation of low angle grain boundaries and further high angle grain boundaries.Reference Hadjipanayis and Siegel22 It is obvious that high strain is responsible for the nanostructured surface layer formation. And DRX will be accelerated under higher air pressure or shot flow rate.
E. Microhardness
Figure 5 shows the microhardness variation along the depth from the treated surface of the shot-peened 6061 alloy specimen. It indicates a significant increment of hardness in the surface layer with nanostructures after the shot peening. The average surface microhardnesses of the layer about 10 μm below the surface are 103.8, 107.7, 105.5, and 114.8 for specimens SP1, SP2, SP3, and SP4, respectively. Besides the microhardness of the top surface nanostructured layer is enhanced, the hardness of the layer below the surface is increased too. It can be seen that the maximum microhardness at the surface is high and decreasing very rapidly with an increase in the depth 40 μm below the surface. With further increase in depth, the hardness variation tends to be steady. The considerable depth of the layer with increased microhardness in specimens is a consequence of the great extent of plastic deformations induced by the high kinetic energy of the process.
Variation of microhardness with depth below the surface for various shot peening parameters.
It is obvious that the increase of the surface hardness of the specimen after shot peening is attributed to the coactions of the grain refinement and the strain hardening. So it can be concluded that the shot peening is helpful to the surface strengthening of materials. Because the residual stress and surface microhardness value of specimen SP3 is lower than those of SP1 and SP2, we can assume that its lower surface microhardness than expected largely due to its higher area fraction of DRX and strain strengthening is balanced by the softening that originated from DRX.
F. Electrochemical properties
To investigate the effect of surface nanocrystallization on the electrochemical behavior of 6061 alloy, the corrosion potential (E corr) and corrosion current density (i corr) of different specimens are determined from potentiodynamic polarization plot through Tafel extrapolation method. Figure 6 illustrates the obtained typical polarization curves of unpeened and shot-peened specimens in 3.5 wt% NaCl solution. Significant difference in polarization behavior between the specimens is observed. The corrosion potential (E corr) of the as-received specimen is about −759 mV, which is the minimum of all. The E corr of the specimens SP1 and SP2 is about −724 and −729 mV respectively, which are much higher than that of the as-received specimen. With further increase of air pressure, corrosion potential decreases to −739 mV. The more positive value of the corrosion potential is, the higher the corrosion resistance is. It is obvious that the corrosion resistance decreased with increasing air pressure. The increased residual stress and surface roughness of the shot-peened specimens could have influenced the electrochemical properties. It is also interesting to observe that the corrosion resistance increases with the shot flow rate decreased. The value of corrosion potential (E corr) of specimen SP4 is increased to −722 mV indicating higher corrosion susceptibility of SP4. Therefore, it can be demonstrated that the surface nanocrystallization induced by shot peening considerably improved the corrosion resistance of the 6061 alloy.
The potentiodynamic polarization curve of 6061 alloy in NaCl solutions drawn in E versus log i.
G. Surface corrosion morphology observation
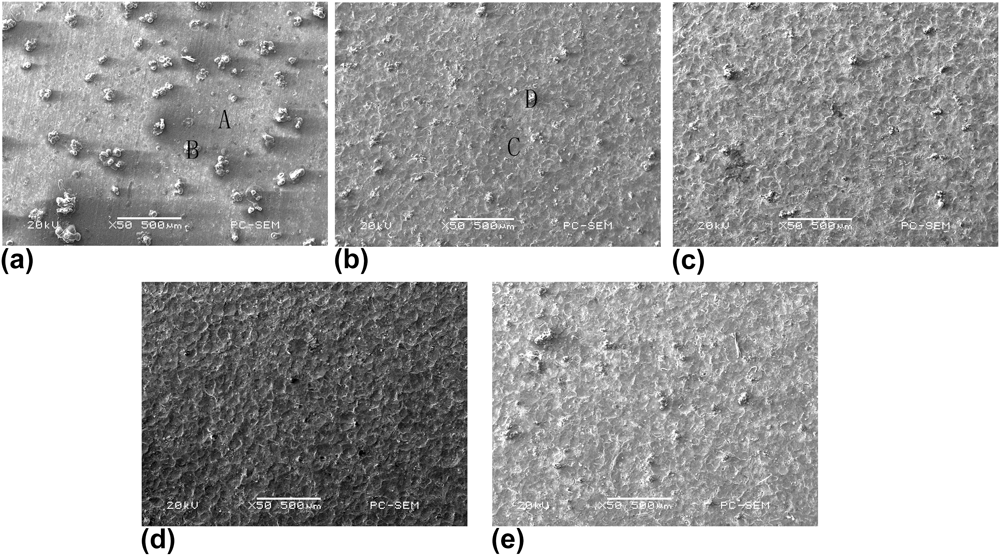
To measure the effect of shot peening on corrosion resistance of 6061 alloy, the surface morphologies of the corroded specimens are observed by means of SEM. Figures 7(a)–7(e) present the typical corroded surface morphologies after electrochemical measurements. As shown in Fig. 7(a), the surface morphology of the corroded region reveals that unpeened specimen suffers severe corrosion attack. For Al, dissolution results in the release of Al3+. Hydrolysis of the Al chloride corrosion products results in the precipitation of Al(OH)3 as solid corrosion products around the pit mouth and on the surface of the matrix nearby. Compared to the unpeened one, shot-peened specimens exhibit better resistance to corrosion. The number and size of corrosion pits on the shot-peened surface is much less than that on the unpeened surface. As can be seen from Figs. 7(b)–7(d), it is obvious that the severe corroded areas are decreased with increasing air pressure. From Fig. 7(e), it is shown that the corrosion degree of SP4 is similar to that of SP2. Therefore, we are able to conclude that shot-peening-induced surface nanocrystallization can enhance the local corrosion resistance of 6061 alloy.
Corrosion morphologies of 6061 alloy specimens NP (a), SP1 (b), SP2 (c), SP3 (d), SP4 (e) after electrochemical measurements in 3.5% NaCl solution.
H. EDS analysis
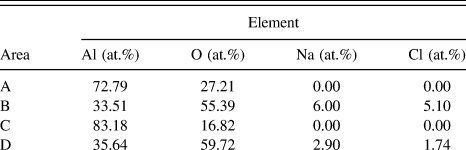
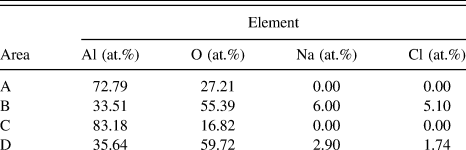
EDS analysis is carried out on the severe corroded area as well as on the precipitation free area of less severe corrosion to identify corrosion characteristics of both unpeened and shot-peened specimens. The corresponding EDS profile analyses for the selected areas A, B, C, and D on Fig. 7 are shown in Figs. 8(a)–8(d), respectively. The element contents are given in Table V. As EDS profile presented in Fig. 7(a), the atomic percentage of the elements found in the selected area A is 72.79%Al and 27.21%O. This suggests that the compounds formed in the area are mainly Al oxides. On the other hand, the atomic percentages of the elements found in area B are 33.51% Al, 55.39% O, 6.00% Na, and 5.10% Cl. This suggests that the compounds formed in the area are mainly Al oxides, Al chlorides, and Al(OH)3. It is obvious that the percentage of O in area B is much higher than that in area A. Similarly, the atomic percentage of the elements in the selected areas C and D is 83.18%Al and 16.82%O, and 35.64% Al, 59.72% O, 2.90% Na, 1.74% Cl, respectively. It means that the shot-peened surface is comparatively less corrosive as the percentage of O in area C is lower than that in area A.
EDS analysis of 6061 alloy after electrochemical measurements in 3.5% NaCl solution.
Chemical composition distribution of 6061 alloy after electrochemical measurements in 3.5% NaCl solution.
It is well known that a thin layer of amorphous native Al2O3 will form on the surface of aluminum upon exposure to oxygen or dry air at room temperature. The thickness of Al2O3 becomes 2–4 nm in several hours, and reaches a value of about 5 nm after a long time.Reference Saif, Zhang, Haque and Hsia23 Since the molar volume of Al2O3 is 1.7 times that of Al, the oxide films form a continuous film on the Al surface. It offers a natural sealant against corrosion of the alloy if the oxide films are thin. However, in the presence of aggressive halide anions, especially chloride ions (Cl−), aluminum alloys are subjected to localized corrosion.Reference Wong and Alkire24 The intermetallic phases such as Al7Cu2Fe and Al2CuMg can also promote pitting to initiate on the surface of aluminum alloy even in the solution without halide anions.Reference Liao and Wei25,Reference Chen, Gao and Wei26 However, there is no Cu element detected in the corrosion pits. Consequently, it is apparent that the pitting attack occurs mainly on the matrix.
IV. CONCLUSIONS
In conclusion, the shot-peening-induced surface nanocrystallization on 6061 alloy and its improved corrosion resistance has been investigated in this work. The following conclusions have been obtained from the present investigation.
(1) The compressive residual stresses of the surface layer for all shot-peened specimens are improved greatly. The maximum stress value is obtained by parameters with the shot flow rate of 5.5 lbs/min and air pressure of 20 psi.
(2) Surface roughness increases with an increase in the air pressure, with constant shot flow rate. The maximum roughness is obtained by the shot flow rate of 5.5 lbs/min and air pressure of 20 psi.
(3) The TEM results indicate that a nanostructured layer with an average grain size below 100 nm has been created on the top surface layer of each specimen. With an increase in the air pressure or shot flow rate, the deformed layer will be developed and its thickness increases too.
(4) In the top surface nanostructured layer, the microhardness is enhanced. It is resulted from the grain refinement and the strain hardening. And the hardness of the layer below the surface is increased too.
(5) The results of the electrochemical measurements, surface corrosion morphology observation, and EDS analysis indicate that the corrosion susceptibility of the 6061 alloy could be significantly enhanced by means of the shot-peening-induced surface nanocrystallization.