


Introduction
Cognitive behavioural therapy (CBT) was formed from an amalgam of cognitive therapy and behavioural therapy during the 1970s (Rachman, Reference Rachman, Clark and Fairburn1997). Since then, there have been many attempts to produce a theory that accounts for the cognition, behavioural, emotional and interpersonal elements of successful CBT, but no consensus has emerged (Mansell, Reference Mansell2008). In the following study, we test a premise of an integrative framework known as Perceptual Control Theory (PCT; Powers et al. Reference Powers, Clark and McFarland1960a , Reference Powers, Clark and McFarland1960b ; Powers, Reference Powers1973, Reference Powers2008). PCT proposes that psychological distress is a consequence of loss of control, and that an important cause of loss of control to tackle in therapy is goal conflict (Mansell, Reference Mansell2005; Carey, Reference Carey2006). For this reason, transdiagnostic CBT based on PCT, in the form of a therapy known as Method of Levels (Carey, Reference Carey2006; Mansell et al. Reference Mansell, Carey and Tai2012), involves a substantial focus on helping clients shift and sustain their attention on goal conflicts, and discuss them openly, so that they can ultimately develop an alternative perspective on them that restores control. While there are a range of studies that have studied the link between goal conflict and psychological distress (for a review, see Michalak et al. Reference Michalak, Heidenreich, Hoyer, Cox and Klinger2011), no studies appear to have explored the link between goal conflict and an objective index of loss of control. This will be an important link to make if future developments in CBT are to incorporate a focus on goal conflict.
Control over body weight represents a paradigm case for testing and applying theories of control (Heatherton & Baumeister, Reference Heatherton and Baumeister1991; Herman & Polivy, Reference Herman, Polivy, Baumeister and Vohs2004; Stroebe et al. Reference Stroebe, Mensink, Aarts, Schut and Kruglanski2008). Several lines of research have reported on the factors that may underlie loss of control over body weight, such as impulsivity (Jansen et al. Reference Jansen, Nederkoorn, van Baak, Keirse, Guerrieri and Havermans2009), and inhibitory capacity (Nederkoorn et al. Reference Nederkoorn, Houben, Hofmann, Roefs and Jansen2009). It has been proposed that in order to achieve greater self-control one must employ more rational thinking over visceral impulsivity (Loewenstein, Reference Loewenstein1996), and indeed a range of evidence supports the view that people with eating problems struggle to override these impulses in the presence of tempting foods (Stroebe et al. Reference Stroebe, Mensink, Aarts, Schut and Kruglanski2008). Research has suggested that restrictive diets lead to a state of cognitive restraint, and it is because of this that a person chooses to ignore hunger sensations, binge eat or loses all control over their eating behaviour, resulting in unsuccessful dieting (Apfeldorfer & Zermati, Reference Apfeldorfer and Zermati2001). However, the emerging question is why people struggle with self-control and why cognitive restraint is experienced.
To address this gap in the literature, the Goal Conflict Model of Eating proposed that individuals have two goals in relation to food consumption: to enjoy the food being eaten and weight control (Stroebe et al. Reference Stroebe, Mensink, Aarts, Schut and Kruglanski2008). However, it is often the case that these goals are in conflict with each other and therefore this leads to greater fluctuations in body weight. It is believed that due to the conflict in goals, people will shift between pursuing the enjoyment of eating tasty food and avoiding this food so as not to put on weight. Because these goals are incompatible, eating behaviour, and therefore body weight, will fluctuate and weight loss gains are not maintained. This model, therefore has similarities with the proposals of PCT, but specifically for eating and weight problems. A range of studies have supported the Goal Conflict Model of Eating by demonstrating that presenting tempting cues can override the goal of maintaining control over weight (for reviews, see Stroebe et al. Reference Stroebe, Mensink, Aarts, Schut and Kruglanski2008; Papies, Reference Papies2012). Yet no studies seem to have tested a goal conflict model directly – namely that holding incompatible goals over eating tasty, enjoyable foods predicts loss of control over eating and body weight. The current study aims to test this view by drawing on PCT and examining the relationship between these variables in a prospective design.
According to PCT, chronic goal conflict is responsible for loss of control, regardless of the specific behaviours that are being observed. For example, if the goal of losing weight and the goal of eating food for pleasure are both very important to a person, they have the capacity to conflict over the variable of perceived weight. The individual might use a diverse range of behaviours to try to lose weight, including restriction of diet, vomiting, excessive exercise or surgery, but none of these will resolve the conflict if they continue to use food as a predominant source of pleasure.
A PCT approach also proposes that conflict can occur between any two personally important goals and that the content of these goals is less relevant as it may differ between individuals. Within PCT, goals are organized in a hierarchy, and it is the superordinate goals that set the lower level goals in the hierarchy. In terms of eating, one can follow a chain from the lower-level goal of restricting food intake upwards to a series of higher-level goals that differ between individuals – for example, to get slimmer, in order to appear more attractive, and in order to be socially accepted (Pieters et al. Reference Pieters, Baumgartner and Allen1995). For another individual weight loss may be pursued to be healthier, in order to live for longer. Thus, in order to measure the most problematic goal conflict around eating, it is actually necessary to assess how important it is for each person to allow themselves to eat tempting food in order to achieve one set of personally important goals (e.g. ‘To distract myself from my worries’) and how important it is for that person to at the same time want to restrain their food intake to achieve another set of personally important goals (e.g. ‘To be liked as a slim person’).
A qualitative analysis of six individuals who recovered from problems with their weight found evidence consistent with this view of goal conflict (Alsawy & Mansell, Reference Alsawy and Mansell2013). The current study utilized a quantitative design by calculating an index of conflict over reasons (higher-level goals) for eating versus not eating tasty foods and assessed its association with objective fluctuations in body weight, as well as a number of standardized measures. The primary hypothesis for this study is that participants who have a greater amount of goal conflict would have a greater fluctuation in body weight as they would be regularly changing their eating behaviour due to the influence of their two conflicting goals. We also tested whether goal conflict was associated with less perceived control over eating and stronger food cravings, and explored the relative importance of covariates in the analysis. The study was powered to test the zero-order correlations. The regression analysis provided indicative results to be explored in a future, larger scale, study.
Method
Participants
Initially, 33 psychology undergraduate students were recruited via a credits scheme and their characteristics were as follows: gender [male: n = 5 (15.2%); female: n = 28 (84.8%)], age (mean = 19.4, s.d. = 1.2 years) and ethnicity [white British: n = 18 (54.5%); Asian: n = 8 (24.2%); Afro-Caribbean: n = 3 (9.1%); other: n = 4 (12.1%)].
Design
The independent variable (IV) for this study was an index of the level of conflict between eating tasty food and not eating tasty food. The dependent variable (DV) was an index for weight fluctuation. These two variables were assessed using Pearson's correlational analysis, and multiple regression was applied for any variables that were significantly related to the DV. Multiple regression analysis in this sample size was suitable based on the number of IVs involved (Knofczynski & Mundfrom, Reference Knofczynski and Mundfrom2008).
Materials
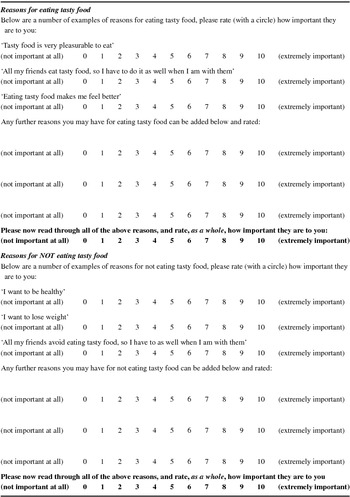
The goal conflict around eating measure. This self-report measure has been fully reproduced in the Appendix. It first presented three examples of commonly cited reasons for eating tasty food (e.g. ‘Eating tasty food makes me feel better’), and then provided space for participants to give their own reasons. The reasons provided were generated from a reading on the literature surrounding goal conflict and eating (e.g. Stroebe et al. Reference Stroebe, Mensink, Aarts, Schut and Kruglanski2008). For each of the reasons in this list, the participant rated their importance and also gave an overall rating of their importance on a scale from 0 (not important at all) to 10 (extremely important). This process was repeated for reasons for not eating tasty food (e.g. ‘I want to be healthy’). In order to calculate the degree of conflict for each individual, the overall importance ratings for each measure were multiplied together. This measure was successfully tested in a separate, earlier study exploring goal conflict over a number of behaviours and emotional states (Kelly, Reference Kelly2011).
Problems in controlling eating. A self-report measure was constructed to assess participants' perceived level of problems with control over eating. This was rated on a scale of 0 (no problem at all) to 10 (extremely problematic). Participants used the same measure to rate how much of a problem they had found controlling their eating each week; this was scored on a scale of 0 (no problem at all) to 10 (extremely problematic).
Trait General Food Cravings Questionnaire (G-FCQ-T; Nijs et al. Reference Nijs, Franken and Muris2007 ). This 21-item self-report measure of a general desire for food consists of four subscales: (1) preoccupation with food (e.g. ‘I feel like I have food on my mind all the time’), (2) loss of control (e.g. ‘Once I start eating, I have trouble stopping’), (3) positive outcome expectancy (e.g. ‘Eating what I crave makes me feel better’), and (4) emotional craving (e.g. ‘When I’m stressed, I crave food’). Participants were asked to rate how frequently each statement would apply to them in general using a six-point scale ranging from 1 (never or not applicable) to 6 (always). This measure has a reported alpha coefficient of 0.94 (Nijs et al. Reference Nijs, Franken and Muris2007).
State General Food Cravings Questionnaire (G-FCQ-S; Nijs et al. Reference Nijs, Franken and Muris2007 ). This 15-item self-report measure of a state desire for food has five subscales: (1) an intense desire to eat (e.g. ‘I have an urge for tasty food’); (2) anticipation of positive reinforcement that may result from eating (e.g. ‘I would feel more alert if I could satisfy my appetite’); (3) anticipation of relief from negative states and feelings as a result of eating (e.g. ‘Satisfying my appetite would make me feel less grouchy and irritable’); (4) obsessive preoccupation with food or lack of control over eating (e.g. ‘My desire to eat something tasty seems overpowering’); and (5) craving as a physiological state (e.g. ‘I feel weak because of not eating’). Participants were asked to rate the extent that they agreed that these state conditions applied to them on a scale of 1 (strongly agree) to 5 (strongly disagree). This measure has a reported alpha coefficient of 0.92 (Nijs et al. Reference Nijs, Franken and Muris2007).
Body weight. A digital scale was used for measuring the participants' body weight. To evaluate weight fluctuation, the sum of squared differences between the time periods was calculated. This computation was based on previous studies into mood fluctuations over time which provides a more representative measure of point-to-point change than variance or standard deviation (Knowles et al. Reference Knowles, Tai, Jones, Highfield, Morriss and Bentall2007).
Food consumption. Participants indicated how much food they had eaten during the previous week, rated from –3 (much less than normal for me) to +3 (much more than normal for me). Fluctuation for food consumption was calculated in the same way as weight fluctuation.
Meals eaten. Participants reported which meals they had eaten so far that day (breakfast/lunch/supper).
Sleep, alcohol and exercise. Participants stated how much sleep, alcohol and exercise they had over the past week. These three confounds were based on previous research that had reported how they have an effect on body weight – sleep (Chaput et al. Reference Chaput, Després, Bouchard and Tremblay2008; Patel & Hu, Reference Patel and Hu2008); alcohol (Breslow & Smothers, Reference Breslow and Smothers2005); exercise (Donnelly et al. Reference Donnelly, Smith, Jacobsen, Kirk, DuBose, Hyder, Bailey and Washburn2004). It was feasible for example, that sleep disruption might increase levels of goal conflict and cause fluctuations in weight. These measures for fluctuation were calculated in the same way as weight fluctuation.
Procedure
The study lasted for the duration of 6 weeks. Previous short-term studies into weight fluctuation have lasted 3 weeks (Tordoff & Aleva, Reference Tordoff and Alleva1990), 4 weeks (DiMeglio & Mattes, Reference DiMeglio and Mattes2000) and 10 weeks (Raben et al. Reference Raben, Vasilaras, Moller and Astrup2002). Therefore, this 6-week time period was expected to be an appropriate length to provide a significant assessment.
At the start of week 1 the participants first provided their demographic details and the baseline self-report measures. After this, the body weight of the participant was measured. In order to achieve greater accuracy for this, the participant was asked to remove their shoes, any heavy clothing, and empty their pockets of heavy items. Participants remained clothed owing to the sensitivities of removing clothing in the company of a student researcher of the opposite sex. This method of body weight measurement was also applied in a study by Bolton-Smith et al. (Reference Bolton-Smith, Woodward, Tunstall-Pedoe and Morrison2000). These data were recorded anonymously, as each participant was assigned a number. Finally, the participant completed the weekly measures. At the end of the first session the subsequent session was arranged, which was intended to be on the same day of the week and time as the first session. Further, the participants were advised not to significantly change their normal eating and behavioural patterns and not to regularly self-weigh during the course of the study, as previous studies have related how frequent self-weighing can lead to binge eating and unhealthy weight control behaviours (Neumark-Sztainer et al. Reference Neumark-Sztainer, van den Berg, Hannan and Story2006). It is possible that due to the nature of the study focusing on eating control and weight fluctuation, participants would focus on this more than normal during the interim periods of the study sessions and would consequently deviate from their normal behaviour. Therefore, by requesting this it would help to ensure that the objective measurement of weight fluctuation in relation to goal conflict would be as accurate as possible, and not influenced by behavioural changes that could arise due to the demands of the study.
During the next 5 weeks of the study sessions, the participants had their body weight measured and completed the weekly measures.
Results
The data were analysed using SPSS v. 16.0 network version software (SPSS Inc., USA).
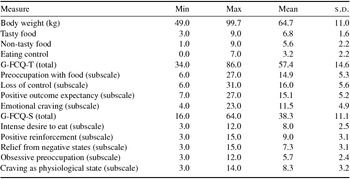
The range, means and standard deviations for the baseline measures are presented in Table 1. Data was collected for the full 6 weeks duration of the study for 30 participants (90.9%) but three participants (9.1%) missed at least one of the following weeks.
Range, means and standard deviations (s.d.) for baseline measures

G-FCQ-T, Trait General Food Cravings Questionnaire; G-FCQ-S, State General Food Cravings Questionnaire.
Is there a relationship between goal conflict at baseline and weight fluctuation over subsequent weeks?
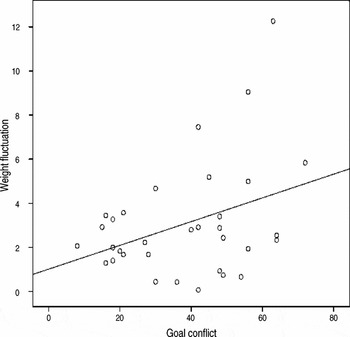
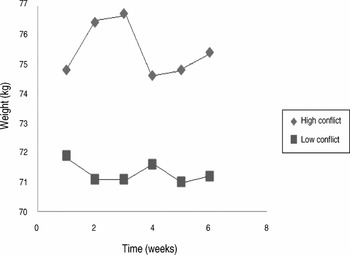
The main area of investigation for the study was to determine if goal conflict related to body weight fluctuation. The test of normality for the goal conflict data was assessed using the Shapiro-Wilk test, and this was consistent with a normal distribution, as the result was non-significant (95% confidence interval 31.96–44.40, P = 0.124). A Pearson's correlation showed the predicted significant positive correlation (r = 0.37, p < 0.05). See Figure 1 for a scatter graph of this correlation and Figure 2 for an example of the data of two participants from each end of the spectrum.
Scatter graph of correlation between goal conflict and weight fluctuation.

Graph of high/low goal conflict and weight fluctuation for two participants.

Is there a relationship between goal conflict and psychological variables indicating loss of control over eating?
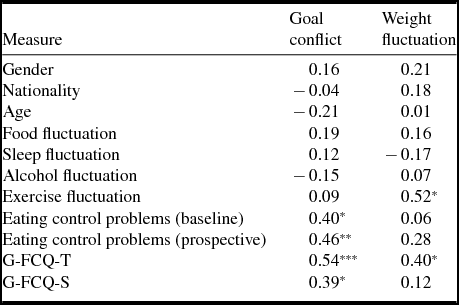
The indices of loss of control over eating we used were self-report of problems with eating control at baseline and during the follow-up period, and trait and state cravings at baseline. Table 2 illustrates that each of these variables were significantly positively correlated with goal conflict, as predicted.
Correlations for variables with goal conflict and weight fluctuation

G-FCQ-T, Trait General Food Cravings Questionnaire; G-FCQ-S, State General Food Cravings Questionnaire.
*p < 0.05, **p < 0.001, ***p < 0.001.
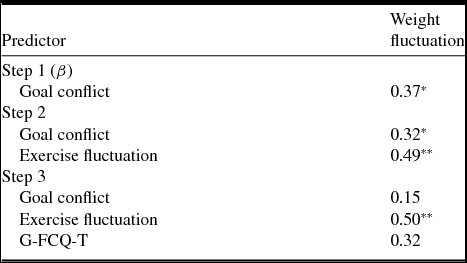
In order to test for potential confounds, a multiple regression was carried out between the variables that significantly correlated with weight fluctuation. Goal conflict was introduced as the first predictor, and then subsequently the potential confounds were added as separate steps (exercise fluctuation, trait craving). Table 3 indicates that the independent contribution of goal conflict to weight fluctuation remained as exercise fluctuation was added. However, when adding trait craving, the only significant predictor of weight fluctuation was exercise fluctuation. We examined whether trait craving could be mediating the effects of goal conflict on weight fluctuation (Baron & Kenny, Reference Baron and Kenny1986), but no significant effect was found.
Regression analyses for possible confounds with weight fluctuation

G-FCQ-T, Trait General Food Cravings Questionnaire.
Step 1: R 2 = 0.13; adjusted R 2 = 0.11. Step 2: R 2 = 0.37; adjusted R 2 = 0.33. Step 3: R 2 = 0.44; adjusted R 2 = 0.38.
*p < 0.05; **p < 0.01.
Discussion
This study investigated the psychological mechanism behind eating problems, which was performed by assessing the association between eating goal conflict, indices of eating control and body weight fluctuation. People with more conflict between their reasons for eating tasty food versus their reasons for not eating tasty food experienced greater weight fluctuation. The ‘reasons’ in this study reflect superordinate goals behind eating behaviour and dieting within a goal hierarchy, as described by PCT (Powers, Reference Powers1973; Alsawy & Mansell, Reference Alsawy and Mansell2013). Therefore, this suggests that goal conflict is a significant factor behind body weight control and is consistent with both PCT (Powers, Reference Powers1973) and the Goal Conflict Model of Eating (Stroebe et al. Reference Stroebe, Mensink, Aarts, Schut and Kruglanski2008). This finding also complements qualitative research into eating control (Alsawy & Mansell, Reference Alsawy and Mansell2013). It is important to note, however, that this study was not designed to assess the effects of chronic dieting, as the Goal Conflict Model of Eating is designed to do, and so did not measure this. Rather, it was the propensity to have conflicting, important reasons to both want to eat tasty food and not eat tasty food that was associated with objective weight fluctuation. It remains to be tested whether this effect is specific for chronic dieters, or indeed whether chronic dieting explains the weight fluctuation independently of goal conflict.
The secondary interest of the study was to assess the relationship between a lack of self-control and cravings over food and goal conflict. Participants with a greater degree of conflict between the goals had lower ratings of self-control and reported more food cravings. Lack of self-control is a focal issue for eating problems and weight gain (Stroebe et al. Reference Stroebe, Mensink, Aarts, Schut and Kruglanski2008; Jansen et al. Reference Jansen, Nederkoorn, van Baak, Keirse, Guerrieri and Havermans2009; Nederkoorn et al. Reference Nederkoorn, Houben, Hofmann, Roefs and Jansen2009). The current study therefore points to the potential role of goal conflict in problems with control over eating.
The results of this study revealed a stronger correlation between goal conflict and the trait craving than state craving. This result complements the previous research as a trait craving for food is related to the concepts of impulsivity and hedonic desire. The results of this study add to the evidence reported by Jansen et al. (Reference Jansen, Nederkoorn, van Baak, Keirse, Guerrieri and Havermans2009) and Nederkoorn at al. (Reference Nederkoorn, Houben, Hofmann, Roefs and Jansen2009) as it reveals how impulsivity and a preference for snack food contribute towards the overriding influence of goal conflict. We suggest that the reason why the previous studies found that impulsivity and hedonic desire led to greater eating problems was because impulsivity and hedonic desire swayed the goal conflict onto the side of eating unhealthy food in favour of healthy food.
The study attempted to control for a number of confounds such as the degree of food cravings, self-reports of alcohol intake, exercise and sleep. Although eating goal conflict was not related to many of these, a regression analysis revealed that the effect of goal conflict was reduced to a non-statistically significant level when trait craving and exercise fluctuation were included as predictors. Notably, exercise fluctuation was not correlated with eating goal conflict and yet did independently correlate with weight fluctuation over 6 weeks. Unfortunately, the study did not include a measure of conflict around reasons to exercise (e.g. ‘I need to exercise to feel good about myself’ versus ‘I need to avoid exercise because it puts too much pressure on my heart’). Future research would benefit from assessing these goals and utilizing a larger sample to retain the power for reductions in effect size that are a consequence of a multiple regression. Nevertheless, the findings are consistent with the notion that health interventions need to focus on the exercise aspects of weight-loss, as purported by the WHO (2011) guidelines.
There are further limitations that could be addressed in later studies. The potential confounds were examined through a single question measure, but previous studies have focused on these factors as a main outcome variable (Donnelly et al. Reference Donnelly, Smith, Jacobsen, Kirk, DuBose, Hyder, Bailey and Washburn2004; Breslow & Smothers, Reference Breslow and Smothers2005; Chaput et al. Reference Chaput, Després, Bouchard and Tremblay2008; Patel & Hu, Reference Patel and Hu2008). Consequently, it may be that the measurements of sleep and alcohol intake in the current study were not robust enough to determine if these aspects could influence the relationship between goal conflict and body weight control. Second, the participant sample was exclusively university undergraduate students, most of whom were female, which means that generalizing to the wider public may be restricted. Although age did not appear to influence the relationship between goal conflict and body weight, the range was narrow, and there are still certain features of university lifestyle that are not representative of the general population which could relate to body weight fluctuation. Such features include levels of stress, social pressure and financial budget. A future study would benefit from analysing a more representative, community sample in which the prevalence of clinically relevant eating problems can be quantified and the relationship between body mass index [BMI; weight (kg)/height (m2)] considered within the analysis.
This study tentatively suggests that in order to ensure weight-loss maintenance, intervention programmes can focus on the eating goals that people have, and to assist them with balancing the more important life goals that drive eating behaviour. Weight-loss maintenance is also a self-help procedure that requires perspicacity of one's internal goals and the ability to balance and control the various goals that one may have. A person seeking to lose weight can be guided in how to achieve control, but ultimately the process of resolving conflict is self-generated. Therefore, it may be beneficial for health professionals to aid their client's self-help process.
In summary, this study has assessed the role of goal conflict in relation to food consumption to understand the psychological process that influences eating behaviour and body weight fluctuation. The results found that increased conflict between the goals of eating tasty food and not eating tasty food were correlated with greater body weight fluctuation. A key advancement of this study to previous research is the direct measurement of body weight fluctuation. It remains to be tested whether goal conflict around exercise could account for further variance in weight fluctuation. These findings provide encouragement for ways to assist people in maintaining control, by addressing internal goals and possible conflict that may exist. This study focused on the eating behaviour of an undergraduate population sample; however, there is scope for the findings to be adapted for future research within the wider population.
Ethical standards
The study was conducted with respect to established ethical standards.
Acknowledgements
Dr Warren Mansell was supported by the ESRC Grant RES 060-25-0044.
Declaration of Interest
None.
Readers of this paper will learn the following:
-
(1) The potential role of goal conflict in weight fluctuation.
-
(2) The importance of accessing and addressing goal conflict in therapy, especially where instability, or lack of control, is a feature of the presentation.
The goal conflict around eating measure




Comments
No Comments have been published for this article.