1. Introduction
The Neoproterozoic Era was characterized by intense environmental and biological change and, as such, marked a turning point in the development of the modern Earth system. Towards the end of this time (c. 575 Ma) came the emergence of the Ediacara Biota, representing the first large, structurally complex organisms (e.g. Narbonne & Gehling, Reference Narbonne and Gehling2003). This diversification of phyla has been hypothesized to be a result of increasing atmospheric and/or oceanic oxygen availability (e.g. Fike et al. Reference Fike, Grotzinger, Pratt and Summons2006; Canfield et al. Reference Canfield, Poulton and Narbonne2007). Termed the Neoproterozoic Oxygenation Event (NOE), the timing and extent of this environmental change has proved difficult to constrain (Shields-Zhou & Och, Reference Shields-Zhou and Och2011). Moreover, recent studies (e.g. Canfield et al. Reference Canfield, Poulton, Knoll, Narbonne, Ross, Goldberg and Strauss2008; Butterfield, Reference Butterfield2009) indicate that oxygenation was more complex, with oceanic anoxia also common during late Neoproterozoic time, particularly along productive and restricted ocean margins (Sahoo et al. Reference Sahoo, Planavsky, Jiang, Kendall, Owens, Wang, Shi, Anbar and Lyons2016; Tostevin et al. Reference Tostevin, Clarkson, Gangl, Shields, Wood, Bowyer, Penny and Stirling2019). Alongside fluctuating oxygen levels, the Ediacaran Period was also characterized by events such as the Gaskiers glaciation and the global Shuram–Wonoka δ13C negative anomaly (e.g. Condon et al. Reference Condon, Zhu, Bowring, Wang, Yang and Jin2005), with the latter considered to represent oceanic oxygenation (Fike et al. Reference Fike, Grotzinger, Pratt and Summons2006; Shields et al. Reference Shields, Mills, Zhu, Raub, Daines and Lenton2019). To understand these events and the relationship between evolution and oxygenation during late Neoproterozoic time, it is important to focus on deposits containing both Ediacaran fauna and a lithology suited to geochemical analysis.
The ‘Miaohe Member’ shales at Miaohe (c. 560–551 Ma) in South China represent one lithological unit where combined geochemical and palaeontological study is possible. Because of this, several studies have been published examining the redox geochemistry and/or stratigraphy of these rocks (An et al. Reference An, Jiang, Tong, Tian, Ye, Song and Song2015; Li et al. Reference Li, Planavsky, Shi, Zhang, Zhou, Cheng, Tarhan, Luo and Xie2015; Xiao et al. Reference Xiao, Bykova, Kovalick and Gill2017). Contained within the shales at the Miaohe site is an assemblage comprising colonial prokaryotes, benthic multicellular algae and several putative metazoans (e.g. Calyptrina and Jiuqunaoella). These early organisms are preserved as carbonaceous compressions and collectively termed the ‘Miaohe Biota’ (Zhu & Chen, Reference Zhu and Chen1984; Chen & Xiao, Reference Chen and Xiao1992; Xiao et al. Reference Xiao, Yuan, Steiner and Knoll2002). Importantly, this assemblage is believed to have been benthic (Xiao et al. Reference Xiao, Yuan, Steiner and Knoll2002); redox data obtained from the Miaohe Member shales should therefore reflect changes in oxygenation at the potentially inhabitable sediment–water interface. Combining trace metal, Fe speciation and pyrite framboid data, Li et al. (Reference Li, Planavsky, Shi, Zhang, Zhou, Cheng, Tarhan, Luo and Xie2015) report that the Miaohe-Biota-associated black shales were deposited in a predominantly anoxic environment, with the remaining Miaohe Member shales deposited under euxinic (anoxic and sulphidic) conditions. Additional redox data are available from studies of the Doushantuo Formation Member IV (DST IV), a unit conventionally correlated with the Miaohe Member (Zhu et al. Reference Zhu, Lu, Zhang, Zhao, Li, Aihua, Zhao and Zhao2013; Xiao et al. Reference Xiao, Bykova, Kovalick and Gill2017; Zhou et al. Reference Zhou, Xiao, Wang, Guan, Ouyang and Chen2017). Deposited between c. 635 Ma and c. 551 Ma, the Doushantuo Formation is of particular interest due to its widespread occurrence over much of South China and its variation in facies from deep marine to shallow marine shelf/lagoon (Zhu et al. Reference Zhu, Zhang, Steiner, Yang, Li and Erdtmann2003).
Geochemical proxies indicate a complicated redox environment during deposition of DST IV. Pyrite framboid analyses and Fepy/FeHR and FeHR/FeT values (where Fepy, FeHR and FeT represent pyrite-bound, highly reactive and total iron, respectively) from multiple Yangtze platform sites record dominantly euxinic conditions (Li et al. Reference Li, Love, Lyons, Fike, Sessions and Chu2010, Reference Li, Planavsky, Shi, Zhang, Zhou, Cheng, Tarhan, Luo and Xie2015; Och et al. Reference Och, Cremonese, Shields-Zhou, Poulton, Struck, Ling, Li, Chen, Manning, Thirlwall, Strauss and Zhu2016; Sahoo et al. Reference Sahoo, Planavsky, Jiang, Kendall, Owens, Wang, Shi, Anbar and Lyons2016). Enrichments of trace metals at multiple sites also suggest that DST IV deposition occurred under dominantly anoxic to euxinic bottom-water conditions (Li et al. Reference Li, Love, Lyons, Fike, Sessions and Chu2010, Reference Li, Planavsky, Shi, Zhang, Zhou, Cheng, Tarhan, Luo and Xie2015; Och et al. Reference Och, Cremonese, Shields-Zhou, Poulton, Struck, Ling, Li, Chen, Manning, Thirlwall, Strauss and Zhu2016; Zhu et al. Reference Zhu, Jiang, Pi, Ge and Yang2018). Despite this, several studies provide evidence for global oceanic oxygenation during deposition of DST IV (Scott et al. Reference Scott, Lyons, Bekker, Shen, Poulton, Chu and Anbar2008; Kendall et al. Reference Kendall, Komiya, Lyons, Bates, Gordon, Romaniello, Jiang, Creaser, Xiao, McFadden, Sawaki, Tahata, Shu, Han, Li, Chu and Anbar2015; Chen et al. Reference Chen, Ling, Vance, Shields-Zhou, Zhu, Poulton, Och, Jiang, Li, Cremonese and Archer2015; Och et al. Reference Och, Cremonese, Shields-Zhou, Poulton, Struck, Ling, Li, Chen, Manning, Thirlwall, Strauss and Zhu2016; Sahoo et al. Reference Sahoo, Planavsky, Jiang, Kendall, Owens, Wang, Shi, Anbar and Lyons2016; Shi et al. Reference Shi, Li, Luo, Huang, Algeo, Jin, Zhang and Cheng2018; Ostrander et al. Reference Ostrander, Sahoo, Kendall, Jiang, Planavsky, Lyons, Nielsen, Owens, Gordon, Romaniello and Anbar2019). Observed Mo and V concentrations in DST IV indicate access to a large trace metal (oxyanion complex) inventory and globally extensive oxic seas (Scott et al. Reference Scott, Lyons, Bekker, Shen, Poulton, Chu and Anbar2008; Och et al. Reference Och, Cremonese, Shields-Zhou, Poulton, Struck, Ling, Li, Chen, Manning, Thirlwall, Strauss and Zhu2016; Sahoo et al. Reference Sahoo, Planavsky, Jiang, Kendall, Owens, Wang, Shi, Anbar and Lyons2016). Similarly, studies of δ34Spy, δ98Mo and δ238U data suggest that oceans were widely oxygenated at this time, and that oxyanion inventories remained high or even increased throughout the interval of DST IV deposition (McFadden et al. Reference McFadden, Huang, Chu, Jiang, Kaufman, Zhou, Yuan and Xiao2008; Kendall et al. Reference Kendall, Komiya, Lyons, Bates, Gordon, Romaniello, Jiang, Creaser, Xiao, McFadden, Sawaki, Tahata, Shu, Han, Li, Chu and Anbar2015; Chen et al. Reference Chen, Ling, Vance, Shields-Zhou, Zhu, Poulton, Och, Jiang, Li, Cremonese and Archer2015; Sahoo et al. Reference Sahoo, Planavsky, Jiang, Kendall, Owens, Wang, Shi, Anbar and Lyons2016; Och et al. Reference Och, Cremonese, Shields-Zhou, Poulton, Struck, Ling, Li, Chen, Manning, Thirlwall, Strauss and Zhu2016; Shi et al. Reference Shi, Li, Luo, Huang, Algeo, Jin, Zhang and Cheng2018; Ostrander et al. Reference Ostrander, Sahoo, Kendall, Jiang, Planavsky, Lyons, Nielsen, Owens, Gordon, Romaniello and Anbar2019). To explain the observed redox data, palaeoenvironmental reconstructions typically include the presence of a metastable euxinic zone that controlled local redox conditions during deposition of DST IV (Li et al. Reference Li, Love, Lyons, Fike, Sessions and Chu2010). A second major feature of the DST IV redox landscape is the occurrence of intra-shelf basins. In these shallow, lagoonal settings, positive δ34Spy values, δ15N data (Och et al. Reference Och, Cremonese, Shields-Zhou, Poulton, Struck, Ling, Li, Chen, Manning, Thirlwall, Strauss and Zhu2016) and infrequent Mo enrichment (Li et al. Reference Li, Planavsky, Shi, Zhang, Zhou, Cheng, Tarhan, Luo and Xie2015) indicate a partially restricted environment, disconnected from global redox patterns (Och et al. Reference Och, Cremonese, Shields-Zhou, Poulton, Struck, Ling, Li, Chen, Manning, Thirlwall, Strauss and Zhu2016). To link this complex palaeoenvironmental reconstruction with DST IV redox data from multiple sites across the Yangtze platform, a number of studies have examined the similarity of δ13C data from different locations (Jiang et al. Reference Jiang, Kaufman, Christie-Blick, Zhang and Wu2007; Li et al. Reference Li, Love, Lyons, Fike, Sessions and Chu2010, Reference Li, Hardisty, Luo, Huang, Algeo, Cheng, Shi, An, Tong, Xie, Jiao and Lyons2017; Zhu et al. Reference Zhu, Lu, Zhang, Zhao, Li, Aihua, Zhao and Zhao2013; An et al. Reference An, Jiang, Tong, Tian, Ye, Song and Song2015; Xiao et al. Reference Xiao, Bykova, Kovalick and Gill2017; Zhou et al. Reference Zhou, Xiao, Wang, Guan, Ouyang and Chen2017).
To understand water-column redox conditions contemporaneous to the deposition of the Miaohe Member facies, a multi-proxy approach is fundamental. In this study, Fe speciation, trace element (Mo, U, V and Cr) and δ14N data are used to investigate water-column redox conditions and associated controlling factors during deposition of the Miaohe Member shales. An attempt is also made to integrate palaeoredox proxy data with δ13C data, thereby enabling the results of this study to be placed within a regional stratigraphic framework, while addressing recent uncertainties around the regional correlation of DST IV and the Miaohe Member (cf. Zhu et al. Reference Zhu, Lu, Zhang, Zhao, Li, Aihua, Zhao and Zhao2013; An et al. Reference An, Jiang, Tong, Tian, Ye, Song and Song2015; Xiao et al. Reference Xiao, Bykova, Kovalick and Gill2017; Zhou et al. Reference Zhou, Xiao, Wang, Guan, Ouyang and Chen2017). Additionally, while the potential impact of weathering on surface outcrop sample redox proxy data is well documented (e.g. Raiswell et al. Reference Raiswell, Hardisty, Lyons, Canfield, Owens, Planavsky, Poulton and Reinhard2018), we specifically address this issue by providing an example of secondarily altered Fe speciation proxy data.
2. Geological setting and study sites
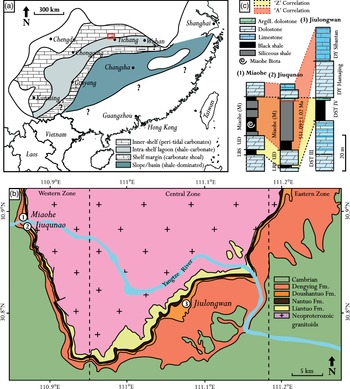
The Miaohe shales examined in this study have been described before in detail (e.g. Ding et al. Reference Ding, Li, Hu, Xiao, Su and Huang1996; Wang et al. Reference Wang, Erdtmann, Chen and Mao1998; Xiao et al. Reference Xiao, Yuan, Steiner and Knoll2002). Palaeogeographic reconstructions indicate that deposition of the Miaohe unit was along a carbonate-rich passive margin, in a shallow, shelf lagoon environment (Condon et al. Reference Condon, Zhu, Bowring, Wang, Yang and Jin2005) (Fig. 1a). In this setting, redox variability would have been strongly controlled by the presence of a shelf margin complex that would have limited communication between the lagoon and deeper basin (Jiang et al. Reference Jiang, Shi, Zhang, Wang and Xiao2011). Conventionally, the Miaohe unit is considered to form the uppermost part of the Ediacaran Doushantuo Formation, which is today exposed in outcrop along the edge of the Huangling anticline in the Yangtze Gorges region of South China (Jiang et al. Reference Jiang, Sohl and Christie-Blick2003). At this location, the Doushantuo Formation overlies the terminal Cryogenian Nantuo Formation, and is itself overlain by the upper Ediacaran Dengying Formation (Fig. 1b) (Xiao et al. Reference Xiao, Bykova, Kovalick and Gill2017). Typically, the Doushantuo Formation in this area is considered to comprise a basal c. 5 m thick dolostone (Member I); an overlying interbedded mudstone and argillaceous dolostone unit of c. 70 m thickness (Member II); a c. 40 m thick dolostone that passes upwards into an interbedded limestone and argillaceous dolostone; and a final c. 20 m thick black shale unit (DST Member IV) (Jiang et al. Reference Jiang, Kennedy, Christie-Blick, Wu and Zhang2006, Reference Jiang, Shi, Zhang, Wang and Xiao2011; Zhou & Xiao, Reference Zhou and Xiao2007; McFadden et al. Reference McFadden, Huang, Chu, Jiang, Kaufman, Zhou, Yuan and Xiao2008).
(a) Palaeoenvironmental map of the Yangtze Platform region in South China during deposition of Doushantuo Member IV (DST IV), modified after Steiner et al. (Reference Steiner, Wallis, Erdtmann, Zhao and Yang2001) and Jiang et al. (Reference Jiang, Shi, Zhang, Wang and Xiao2011). The red square indicates the location of (b). (b) Geological map of the southern portion of the Huangling anticline, modified after Xiao et al. (Reference Xiao, Bykova, Kovalick and Gill2017). The locations of sections examined in this study are: 1, Miaohe; 2, Jiuqunao; and 3, Jiulongwan. Vertical dashed lines divide the area into eastern, central and western zones as defined by Zhou et al. (Reference Zhou, Xiao, Wang, Guan, Ouyang and Chen2017). (c) Simplified stratigraphic columns for the Miaohe (this study; Li et al. Reference Li, Planavsky, Shi, Zhang, Zhou, Cheng, Tarhan, Luo and Xie2015), Jiuqunao (Li et al. Reference Li, Planavsky, Shi, Zhang, Zhou, Cheng, Tarhan, Luo and Xie2015) and Jiulongwan (Li et al. Reference Li, Love, Lyons, Fike, Sessions and Chu2010) sections. Two stratigraphic correlations are proposed for the Miaohe, Jiuqunao and Jiulongwan sites: the ‘Z’ correlation (Xiao et al. Reference Xiao, Bykova, Kovalick and Gill2017; Zhou et al. Reference Zhou, Xiao, Wang, Guan, Ouyang and Chen2017) and the ‘A’ correlation (An et al. Reference An, Jiang, Tong, Tian, Ye, Song and Song2015). The location of the ash bed dated at 551.09 ± 1.02 Ma by Schmitz (Reference Schmitz, Gradstein, Ogg, Schmitz and Ogg2012) is indicated, as is the location of the Miaohe Biota (Xiao et al. Reference Xiao, Yuan, Steiner and Knoll2002).

Although the Doushantuo Formation can be broadly traced around the circumference of the Huangling anticline, incomplete exposure has resulted in uncertainty over the stratigraphic placement of DST IV between localities (An et al. Reference An, Jiang, Tong, Tian, Ye, Song and Song2015; Xiao et al. Reference Xiao, Bykova, Kovalick and Gill2017; Zhou et al. Reference Zhou, Xiao, Wang, Guan, Ouyang and Chen2017). In particular, the relationship between DST IV described at Jiulongwan (Fig. 1b) and the Miaohe Member examined in this study has proved difficult to reconcile. Due to subtle differences in the uppermost Doushantuo Formation between sections, Zhou et al. (Reference Zhou, Xiao, Wang, Guan, Ouyang and Chen2017) divided the Huangling study area into eastern, central and western zones (Fig. 1b). Notably, several locations in the western zone (e.g. Miaohe, Qinglinkou, Jiuqunao and Sixi) show distinct variations when compared with the central and eastern zones; instead of the c. 20 m thick black shale characteristic of Member IV at the Jiulongwan section, the rocks overlying Member III at these localities comprise two black shales separated by a dolostone unit (An et al. Reference An, Jiang, Tong, Tian, Ye, Song and Song2015; Xiao et al. Reference Xiao, Bykova, Kovalick and Gill2017; Zhou et al. Reference Zhou, Xiao, Wang, Guan, Ouyang and Chen2017). These three units have been termed the lower black shale (LBS), upper dolostone (UD) and Miaohe Member (M) (Zhou et al. Reference Zhou, Xiao, Wang, Guan, Ouyang and Chen2017). However, disruption is apparent at these localities in the western zone, with regional-scale rotational sliding providing a likely mechanism for the observed repetition of the black shale and evident syn-sedimentary deformation within the upper dolostone (Vernhet et al. Reference Vernhet, Heubeck, Zhu and Zhang2007; Zhu et al. Reference Zhu, Lu, Zhang, Zhao, Li, Aihua, Zhao and Zhao2013). Despite this, the original sequence of lithologies within Doushantuo Member IV remains controversial, with some studies partially correlating the Miaohe Member as described in the western zone (M) with Doushantuo Member IV (Xiao et al. Reference Xiao, Bykova, Kovalick and Gill2017; Zhou et al. Reference Zhou, Xiao, Wang, Guan, Ouyang and Chen2017), or partially with the younger Shibantan Member of the Dengying Formation (Fig. 1c) (An et al. Reference An, Jiang, Tong, Tian, Ye, Song and Song2015).
In this study, the Miaohe Member shales from the Miaohe site are examined and compared with potentially correlative black shale units from the neighbouring Jiuqunao section and the Jiulongwan section further to the east (Fig. 1b). The succession at Miaohe comprises a series of finely laminated organic-rich black and siliceous shales, with occasional carbonate concretions. Directly overlying the shales at Miaohe is an c. 80 cm thick argillaceous dolostone that directly underlies, and potentially transitions into the Ediacaran Dengying Formation (Zhu et al. Reference Zhu, Zhang and Yang2007; An et al. Reference An, Jiang, Tong, Tian, Ye, Song and Song2015; Xiao et al. Reference Xiao, Bykova, Kovalick and Gill2017). In addition to anomalously low δ13Corg and δ13Ccarb values (e.g. δ13Corg values of between −22‰ and −40‰; Xiao et al. Reference Xiao, Bykova, Kovalick and Gill2017), the black shales at the Miaohe site are notable for containing the Miaohe Biota, a collection of colonial prokaryotes and algal macrofossils preserved as carbonaceous compressions (Zhu & Chen, Reference Zhu and Chen1984; Chen & Xiao, Reference Chen and Xiao1992; Xiao et al. Reference Xiao, Yuan, Steiner and Knoll2002). The Miaohe Biota occur over a 2 m interval, approximately 5–7 m from the base of the Miaohe shales at the Miaohe site (Xiao et al. Reference Xiao, Yuan, Steiner and Knoll2002).
3. Geochemical redox proxies
3.a. Iron speciation
Iron geochemistry has been widely used as a method for discerning water-column redox conditions in both modern and ancient marine environments (e.g. Raiswell & Canfield, Reference Raiswell and Canfield1998; Raiswell et al. Reference Raiswell, Newton and Wignall2001; Poulton & Raiswell, Reference Poulton and Raiswell2002; Shen et al. Reference Shen, Canfield and Knoll2002, Reference Shen, Knoll and Walter2003; Poulton et al. Reference Poulton, Fralick and Canfield2004). Sedimentary iron typically comprises carbonate-associated Fe (Fecarb), ferric-oxides (Feox), magnetite Fe (Femag), pyrite Fe (Femag) and other poorly reactive or non-reactive iron-silicate minerals (Canfield, Reference Canfield1989; Raiswell et al. Reference Raiswell, Canfield and Berner1994; Raiswell & Canfield, Reference Raiswell and Canfield1996, Reference Raiswell and Canfield1998; Poulton et al. Reference Poulton, Fralick and Canfield2004). Poulton & Canfield (Reference Poulton and Canfield2005) developed a sequential extraction scheme to quantify operationally defined Fe pools that broadly target these Fe phases, and this has been widely used to distinguish anoxic-ferruginous, euxinic and oxic water bodies (see Poulton & Canfield, Reference Poulton and Canfield2011; Poulton, Reference Poulton2021). In this scheme, Fecarb, Feox, Femag and Fepy constitute the highly reactive iron pool (FeHR), and FeHR/FeT and Fepy/FeHR ratios are used together to define the redox state of the water-column.
Observations from both modern and Phanerozoic sediments indicate that an FeHR/FeT threshold of 0.38 generally marks the upper limit for deposition of sediments in an oxic water-column, with values of > 0.38 indicative of anoxia (Raiswell & Canfield, Reference Raiswell and Canfield1998; Poulton & Canfield, Reference Poulton and Canfield2011). However, sediments deposited rapidly in an anoxic environment have been documented to record lower FeHR/FeT ratios (Raiswell & Canfield, Reference Raiswell and Canfield1998), and caution should be applied when interpreting ratios between 0.22 and 0.38 (Poulton & Canfield, Reference Poulton and Canfield2011; Raiswell et al. Reference Raiswell, Hardisty, Lyons, Canfield, Owens, Planavsky, Poulton and Reinhard2018; Poulton, Reference Poulton2021). As defined empirically, an Fepy/FeHR value of < 0.6 – for samples with FeHR/FeT > 0.38 – likely indicates ferruginous conditions (Benkovitz et al. Reference Benkovitz, Matthews, Teutsch, Poulton, Bar-Matthews and Almogi-Labin2020; Poulton, Reference Poulton2021), whereas a value of > 0.8 suggests euxinia (Poulton et al. Reference Poulton, Fralick and Canfield2004; Canfield et al. Reference Canfield, Poulton, Knoll, Narbonne, Ross, Goldberg and Strauss2008). Fepy/FeHR values between 0.6 and 0.8 should be interpreted with caution (Poulton & Canfield, Reference Poulton and Canfield2011; Poulton, Reference Poulton2021). Generally, FeHR/FeT and Fepy/FeHR proxies should both be applied with consideration for the depositional environment (including rate of deposition, sediment composition, fluctuating redox conditions and biological/physical reworking), FeT content, post-depositional alteration and surface weathering of pyrite (Clarkson et al. Reference Clarkson, Poulton, Guilbaud and Wood2014; Raiswell et al. Reference Raiswell, Hardisty, Lyons, Canfield, Owens, Planavsky, Poulton and Reinhard2018).
3.b. Redox-sensitive trace metals
The enrichment of redox-sensitive trace metals in organic-rich shales can also be used to decipher palaeoredox conditions. Due to changes in solubility, the burial fluxes of Mo, V, U and Cr are several orders of magnitude larger in reducing environments than in an oxidizing environment (Emerson & Huested, Reference Emerson and Huested1991). In a euxinic setting, amplification of Mn/Fe redox cycling and the availability of organic carbon substrates is increased, thereby influencing patterns of trace metal enrichment (Morse & Luther, Reference Morse and Luther1999; Algeo & Maynard, Reference Algeo and Maynard2004).
In seawater, molybdenum occurs as the molybdate oxyanion complex, MoO42− (Broecker & Peng, Reference Broecker and Peng1982). Given reducing conditions, molybdate is readily sequestered by Mn-oxyhydroxides at the sediment–water interface and released to pore waters (Bertine & Turekian, Reference Bertine and Turekian1973; Calvert & Pedersen, Reference Calvert and Pedersen1993; Crusius et al. Reference Crusius, Calvert, Pedersen and Sage1996; Erickson & Helz, Reference Erickson and Helz2000; Zheng et al. Reference Zheng, Anderson, van Geen and Kuwabara2000; Goldberg et al. Reference Goldberg, Archer, Vance, Thamdrup, McAnena and Poulton2012). In the presence of free H2S, molybdate present in sediment pore water is able to react to form particle-reactive thiomolybdates (MoOxS4-x) (Helz et al. Reference Helz, Miller, Charnock, Mosselmans, Pattrick, Garner and Vaughan1996), which are easily scavenged by sulphur-rich organic molecules, metal-rich compounds (Tribovillard et al. Reference Tribovillard, Riboulleau, Lyons and Baudin2004; Helz et al. Reference Helz, Miller, Charnock, Mosselmans, Pattrick, Garner and Vaughan1996, Reference Helz, Bura-Nakić, Mikac and Ciglenečki2011) and FeS (Vorlicek et al. Reference Vorlicek, Kahn, Kasuya and Helz2004; Poulson Brucker et al. Reference Poulson Brucker, McManus and Poulton2012). Although moderately enriched in sediments deposited in non-sulphidic anoxic conditions, Mo is more strongly enriched in sediments deposited in a euxinic environment (e.g. Tribovillard et al. Reference Tribovillard, Algeo, Lyons and Riboulleau2006).
In an oxic water mass, vanadium occurs as vanadate oxyanions (HVO42− and H2VO4-), which are readily adsorbed onto both Mn- and Fe-oxyhydroxides (Calvert & Piper, Reference Calvert and Piper1984; Wehrli & Stumm, Reference Wehrli and Stumm1989). In anoxic conditions, V(V) is readily reduced to V(IV), forming vanadyl (VO2−) and hydroxyl (VO(OH)3−) species, in addition to insoluble hydroxides (VO(OH)2). The resulting ions can then be scavenged via organometallic ligand formation or surface adsorption (Emerson & Huested, Reference Emerson and Huested1991; Morford & Emerson, Reference Morford and Emerson1999). Given a more strongly reducing euxinic environment, V(V) is further reduced to V(III), which can be taken up by geoporphyrins, or precipitated as solid V2O3 oxides or V(OH)3 hydroxides (Breit & Wanty, Reference Breit and Wanty1991; Wanty & Goldhaber, Reference Wanty and Goldhaber1992). Unlike Mo, V is readily sequestered and enriched in sediments deposited in a reducing but non-sulphidic water-column (e.g. Algeo & Maynard, Reference Algeo and Maynard2004; Tribovillard et al. Reference Tribovillard, Algeo, Lyons and Riboulleau2006).
Uranium is mainly present in seawater as carbonate-bound uranyl ions, UO2(CO3)34− (Anderson et al. Reference Anderson, Fleisher and LeHuray1989). In an anoxic environment, the reduction of U(VI) to U(IV) forms UO2+ uranyl ions or less soluble uranous fluoride compounds and occurs independently to Fe and Mn cycling. Because of this, U enrichment primarily takes place within the sediment (Anderson et al. Reference Anderson, Fleisher and LeHuray1989; Algeo & Maynard, Reference Algeo and Maynard2004; McManus et al. Reference McManus, Berelson, Klinkhammer, Hammond and Holm2005). At this location, U accumulates due to adsorption by humic acid ligand complexes or the precipitation of uraninite (UO2), U3O7 or U3O8 (e.g. Klinkhammer & Palmer, Reference Klinkhammer and Palmer1991; Crusius et al. Reference Crusius, Calvert, Pedersen and Sage1996; McManus et al. Reference McManus, Berelson, Klinkhammer, Hammond and Holm2005). The presence of free H2S and active sulphate reduction is thought to accelerate the latter process (Langmuir, Reference Langmuir1978; Klinkhammer & Palmer, Reference Klinkhammer and Palmer1991). Typically, U is enriched in non-sulphidic anoxic facies and strongly enriched in euxinic facies, although vulnerable to remobilization and secondary depletion (e.g. Algeo & Maynard, Reference Algeo and Maynard2004; Tribovillard et al. Reference Tribovillard, Algeo, Lyons and Riboulleau2006).
In oxic seawater, Cr mainly occurs as the chromate oxyanion, CrO42– (Cranston & Murray, Reference Cranston and Murray1978). In an anoxic setting, Cr(IV) is readily reduced to Cr(III), subsequently forming hydroxyl and aquahydroxyl cations (e.g. Cr(OH)2+). These cations are able to react to form insoluble Cr(OH)3 and Cr2O3, or a complex with humic/fulvic acids to enable adsorption by Fe- and Mn-oxyhydroxides, thereby enabling transport of Cr to the sediment (Elderfield, Reference Elderfield1970; Emerson et al. Reference Emerson, Cranston and Liss1979; Breit & Wanty, Reference Breit and Wanty1991; Algeo & Maynard, Reference Algeo and Maynard2004). In sulphidic conditions, structural and electronic incompatibilities limit uptake of Cr (III) by Fe-sulphides (Huerta-Diaz & Morse, Reference Huerta-Diaz and Morse1992; Morse & Luther, Reference Morse and Luther1999). As a result, Cr is typically enriched in anoxic sediments, with little change to the relative degree of anoxic enrichment under euxinic conditions (e.g. Algeo & Maynard, Reference Algeo and Maynard2004).
The behaviour demonstrated by each of the redox-sensitive trace elements, Mo, U, V and Cr creates relative patterns of sedimentary enrichment. Firstly, strong Cr, V and/or U enrichment without strong Mo enrichment indicates anoxic but not euxinic conditions, while strong Mo, U or V enrichment without strong Cr enrichment indicates euxinia (Algeo & Maynard, Reference Algeo and Maynard2004; Tribovillard et al. Reference Tribovillard, Algeo, Lyons and Riboulleau2006). In a suboxic (O2 < 5 µM) water-column, Mo, U, V and Cr solubilities are all increased and sedimentary enrichment is therefore low (Algeo & Maynard, Reference Algeo and Maynard2004). Commonly, trace metal enrichment or depletion is assessed by normalization to a reference shale (Wedepohl, Reference Wedepohl1971, Reference Wedepohl and Merian1991; McLennan, Reference McLennan2001; Tribovillard et al. Reference Tribovillard, Algeo, Lyons and Riboulleau2006; Algeo & Tribovillard, Reference Algeo and Tribovillard2009). In anoxic basins, the uptake of Mo, U and V is also closely linked to the availability of total organic carbon (TOC). This is because reduced metal species such as thiomolybdate and vanadyl ions are bound by organic particles (Lyons et al. Reference Lyons, Anbar, Severmann, Scott and Gill2009). Because of this, trace metal and TOC ratios can be used as palaeogeographic proxies for understanding the extent of basin restriction and deep-water renewal (Algeo & Lyons, Reference Algeo and Lyons2006; Algeo & Rowe, Reference Algeo and Rowe2012).
3.c. Nitrogen isotopes
The isotopic signature (δ15Nsed) of nitrogen in marine sediments is linked to multiple biogeochemical processes, including nitrification, denitrification, nitrogen fixation and anammox. During denitrification, NO3– is reduced to N2 or N2O, and the seawater nitrate reservoir is enriched in 15N relative to atmospheric nitrogen (δ15N = 0‰) due to isotopic fractionation (Sigman et al. Reference Sigman, Karsh, Casciotti, Steele, Thorpe and Turekian2009; Kikumoto et al. Reference Kikumoto, Tahata, Nishizawa, Sawaki, Maruyama, Shu, Han, Komiya, Takai and Ueno2014). Conversely, diazotrophic N2 fixation results in slightly negative δ15Nsed values (e.g. Ader et al. Reference Ader, Sansjofre, Halverson, Busigny, Trindade, Kunzmann and Nogueira2014; Zhang et al. Reference Zhang, Sigman, Morel and Kraepiel2014). Due to the near-complete ventilation of modern oceans, present-day δ15Nsed values have a mode of +5 to +6‰, with an overall range of between +1‰ and +15‰ (Tesdal et al. Reference Tesdal, Galbraith and Kienast2013; Ader et al. Reference Ader, Sansjofre, Halverson, Busigny, Trindade, Kunzmann and Nogueira2014). This is due to nitrate limitation, whereby denitrification and/or assimilation exceed oceanic nitrate input and/or recycling (e.g. Kikumoto et al. Reference Kikumoto, Tahata, Nishizawa, Sawaki, Maruyama, Shu, Han, Komiya, Takai and Ueno2014).
Because of the link between oxygenation and marine productivity, δ15Nsed values can be tentatively used as palaeoredox proxies (e.g. Sigman et al. Reference Sigman, Karsh, Casciotti, Steele, Thorpe and Turekian2009). In a redox-stratified ocean, the oxic–anoxic interface is elevated in the water-column. In deeper, anoxic waters, the nitrogen generated by biological processes will be in the form of ammonium (NH4+), while in oxygenated surface waters organic nitrogen will be converted to NO3−. In this scenario, δ15Nsed values strongly relate to both the depth of the redox transition zone and mixing (upwelling) between the deep ammonium pool and the shallow nitrate-rich pool. Although difficult to standardize, typical δ15Nsed values from primarily anoxic settings tend towards 0‰ (Quan & Falkowski, Reference Quan and Falkowski2009; Ader et al. Reference Ader, Sansjofre, Halverson, Busigny, Trindade, Kunzmann and Nogueira2014). In a euxinic water-column, N2 fixation is favoured and occurs with a fractionation of between 0 and −2‰, further reducing δ15Nsed values (Cremonese et al. Reference Cremonese, Shields-Zhou, Struck, Ling, Och, Chen and Li2013). Because of the variability associated with δ15Nsed in modern marine settings, δ15Nsed should only be used for local palaeoredox reconstructions in conjunction with other established proxies (Quan et al. Reference Quan, van de Schootbrugge, Field, Rosenthal and Falkowski2008).
4. Materials and methods
The 20 surface outcrop samples used in this study were collected from the Miaohe Member black shales at Miaohe (Fig. 1b). Small portions were obtained from clean surface sections and powdered for geochemical analysis.
4.a. Iron speciation
Several operationally defined Fe pools were measured during iron speciation analysis (Poulton & Canfield, Reference Poulton and Canfield2005). These are carbonate-associated Fe (Fecarb), ferric-oxides (Feox), magnetite Fe (Femag) and pyrite Fe (Fepy). Total Fe was also measured (FeT).
Fepy was measured using an adaptation of the method outlined by Canfield et al. (Reference Canfield, Raiswell, Westrich, Reaves and Berner1986). Initially, 2–4 g of gravimetrically measured powdered sample was placed in a digestion flask, to which 8 mL of concentrated HCl was added. After heating under a constant flow of N2 to determine whether acid volatile sulphide (AVS) was present (no AVS was detected), 16 mL of acidified CrCl2 was added to the solution and heated to boiling for 2 hours, during which time any liberated H2S was collected in a AgNO3 trap as Ag2S. The concentration of Fepy was then determined gravimetrically.
The remaining Fe pools (Feox, Femag and Fecarb) were measured following the sequential extraction technique of Poulton & Canfield (Reference Poulton and Canfield2005). Between 50 and 100 mg of powdered sample was placed in a centrifuge tube. To each of the samples, 10 mL of 1 M sodium acetate (adjusted to a pH of 4.5 with acetic acid) was added and constantly agitated for 48 hours at a temperature of 50°C. After centrifugation and removal of the supernatant, 10 mL of 0.28 M sodium dithionite (adjusted to a pH of 4.8 with 0.2 M acetic acid and 0.3 M tri-sodium citrate) was added and shaken for 2 hours at ambient temperature. For the final step, 10 mL of 0.2 M ammonium oxalate (buffered with 0.17 M oxalic acid) was added and shaken for 6 hours at ambient temperature.
FeT was measured via a multi-acid digestion. Initially, 100 mg of each sample was ashed at 450°C for 8 hours. Following this, 5 mL of concentrated HNO3, 2 mL of HF and 2–3 drops of HClO4 were added. The solutions were then heated and left to dry, after which boric acid was added and evaporated to dryness. The samples were then re-dissolved in concentrated HNO3.
Dissolved iron concentrations were measured using atomic absorption spectroscopy (AAS). Replicate analyses of PACS-2, an international sediment standard, gave a relative standard deviation (RSD) of < 5% for all sequential extraction stages, and an FeT accuracy of > 98%. Iron speciation analyses were performed in the Cohen Geochemistry Laboratory, University of Leeds.
4.b. Redox-sensitive trace metals
The trace metal (Mo, U, V and Cr) content of each sample was measured via multi-acid digestion. Firstly, 3 mL of HF and 2 mL HNO3 were added to 60 mg of powdered sample and the mixture heated at 200°C for 16 hours. The resulting solution was left to cool and evaporate to dryness. A further 2 mL of HF, 1 mL of HNO3 and 2 mL of HClO4 were added and the solution was again heated at 200°C for 16 hours. This solution was left to cool and evaporate before 1 mL of HNO3 and 1 mL of HClO4 were added. Following a final phase of cooling and evaporation to dryness, 1 mL of HNO3 was added. Aliquots of 1 mL for each sample were then analysed using inductively coupled plasma mass spectrometry (ICP-MS) at the instrument laboratory of the London Geochemistry and Isotope Centre (LOGIC), University College London.
4.c. Stable isotopes
Analyses were performed at the Bloomsbury Environmental Isotope Laboratories (BEIF) of University College London, using a Thermo-Finnigan elemental analyser mass spectrometer (continuous flow). Rock samples were first washed, cut into small chips and ground after removing altered and recrystallized fragments. An amount of rock powder between 10 mg and 200 mg was used for nitrogen isotope analyses, depending on the expected nitrogen concentration. The error associated with δ15N and δ13Corg is ±0.50‰. Some samples needed to be analysed repeatedly in order to ensure a meaningful nitrogen isotope signal, although here we publish only the highest-fidelity values based on the signal background and peak intensity. δ15N values were calibrated during each session using the minor internal standard drift experienced by the elemental analyser.
4.d. Total organic carbon
TOC values were determined after first adding 10 mL of 10% HCl to 1000 mg of sample. Samples were then centrifuged and the supernatant discarded, before being rinsed and dried at 50°C overnight. Carbon was then measured using a Leco C/S analyser (Leco Corporation, St Joseph, MI, USA) at the London Geochemistry and Isotope Centre (LOGIC), University College London.
4.e. Redox-sensitive trace metal enrichment factors
Trace metal concentrations are commonly normalized to the concentrations of detrital elements such as Al, Ti and Sc and presented as ‘enrichment factors’ (EFs; e.g. Tribovillard et al. Reference Tribovillard, Algeo, Lyons and Riboulleau2006; Algeo & Tribovillard, Reference Algeo and Tribovillard2009). In this study, Mo, V, U and Cr EFs were calculated using the equation: EFx = ([X]/Tisample)/([X]/Tiupper continental crust). Average upper continental crust trace metal concentrations for normalization were obtained from McLennan (Reference McLennan2001).
5. Results
5.a. Samples
Although several of the samples associated with the Miaohe Biota-bearing strata are dark shales, the majority of samples powdered for geochemical analysis were evidently silicified. Relatively immobile metals Ti, Sc, Th and REE all covary linearly (see online Supplementary Material, available at http://journals.cambridge.org/geo) but are significantly depleted in all samples relative to upper contiental crust (McLennan, Reference McLennan2001), indicating that Fe concentrations have been diluted by silica and/or other non-silicate minerals to varying extents. Because of this silicification, a minority of the samples analysed record FeT values below the 0.5 wt% threshold conventionally considered appropriate for Fe speciation analyses (Clarkson et al. Reference Clarkson, Poulton, Guilbaud and Wood2014; Raiswell et al. Reference Raiswell, Hardisty, Lyons, Canfield, Owens, Planavsky, Poulton and Reinhard2018). Similar FeT values are recorded in equivalent Miaohe Member samples obtained by Li et al. (Reference Li, Planavsky, Shi, Zhang, Zhou, Cheng, Tarhan, Luo and Xie2015), and for the subset of samples from both studies that contain < 0.5 wt% FeT, Fe speciation analyses must be considered to be potentially ambiguous.
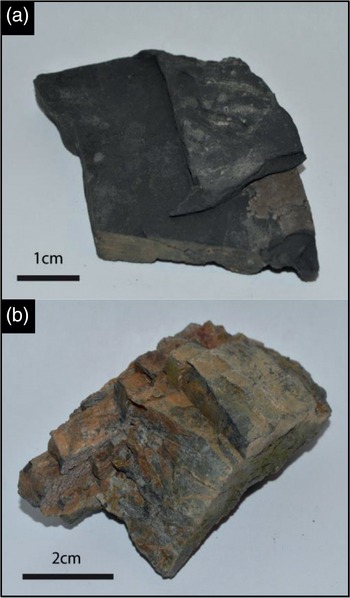
The hand specimens used in this study showed visible evidence of oxidative weathering, particularly along previously exposed surfaces (see online Supplementary Material; Fig. 2). As previously discussed, Fe speciation proxies should only be applied with consideration for the environment of deposition, potential post-depositional alteration and the impact of weathering (Clarkson et al. Reference Clarkson, Poulton, Guilbaud and Wood2014; Raiswell et al. Reference Raiswell, Hardisty, Lyons, Canfield, Owens, Planavsky, Poulton and Reinhard2018). Equivalent samples obtained by Li et al. (Reference Li, Planavsky, Shi, Zhang, Zhou, Cheng, Tarhan, Luo and Xie2015) were excavated at depth, while those obtained for this study are surface outcrop samples; a comparison of the two studies therefore provides an opportunity to quantitatively assess the impact of clear visible surface weathering on Fe speciation data. Unlike the weathered samples evaluated in this study, and despite evidence of increased Feox in some samples (Fig. 3), Li et al. (Reference Li, Planavsky, Shi, Zhang, Zhou, Cheng, Tarhan, Luo and Xie2015) argue that the presence of microscopic pyrite framboids means any significant impact due to oxidative weathering is unlikely for their excavated samples. These differences are demonstrated by the mean Fepy/FeHR values of 0.04 and 0.46 recorded in this study and by Li et al. (Reference Li, Planavsky, Shi, Zhang, Zhou, Cheng, Tarhan, Luo and Xie2015), respectively.
Contrast between the (a) least visibly weathered sample, collected from the Miaohe Member at Miaohe at a stratigraphic height of 7.0 m, and (b) most visibly weathered sample, collected from the same section at 12.9 m.

Fepy/FeHR versus Feox/FeHR cross-plot for samples from this study (solid black points) and Li et al. (Reference Li, Planavsky, Shi, Zhang, Zhou, Cheng, Tarhan, Luo and Xie2015) (white points). The high Feox/FeHR and low Fepy/FeHR values observed in samples from this study are indicative of modern weathering. Samples from Li et al. (Reference Li, Planavsky, Shi, Zhang, Zhou, Cheng, Tarhan, Luo and Xie2015) are more distributed, reflecting transient alteration.

5.b. Iron speciation
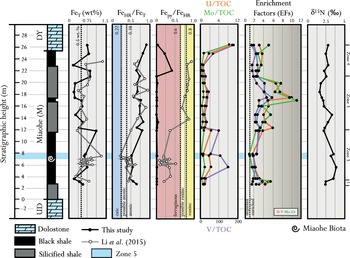
Although a study by Ahm et al. (Reference Ahm, Bjerrum and Hammarlund2017) found a difference of up to 30% for FeHR/FeT data between outcrop and core samples from the Vinini Formation in Nevada, USA, it is likely that the FeHR/FeT proxy is mostly unaffected by modern oxidative weathering. Previously, a study of 231 carbonate samples (Sperling et al. Reference Sperling, Halverson, Knoll, MacDonald and Johnston2013) found no statistical correlation between Fepy/FeHR and FeHR/FeT data despite pyrite weathering, thereby implying that the Fepy fraction is transformed into immobile iron (oxyhydr)oxides that are preserved in the vicinity of the original pyrite. This is consistent with the behaviour of Fe during chemical weathering (Poulton & Raiswell, Reference Poulton and Raiswell2002). Because of this, the FeHR/FeT proxy can be used despite evidence of secondary oxidative weathering. The Miaohe section shales record FeHR/FeT values of between 0.46 and 0.9 (Table 1; Fig. 4), suggesting that deposition occurred in a sustained anoxic setting. It is important to note that although several of the samples used in this study record FeT concentrations of < 0.5 wt%, FeHR/FeT ratios from all samples analysed consistently record anoxia. These values are also similar to the FeHR/FeT ratios obtained by Li et al. (Reference Li, Planavsky, Shi, Zhang, Zhou, Cheng, Tarhan, Luo and Xie2015).
Geochemical data for the studied Miaohe Member samples from the Miaohe Section, South China. TOC – total organic carbon; TN – total nitrogen; EF – enrichment factor (normalized using upper continental crust values from McLennan, Reference McLennan2001).

Iron speciation, trace metal and δ15N data from the Miaohe Member (M) section at Miaohe. FeHR/FeT values of < 0.22 indicate deposition in an anoxic environment, while values of > 0.38 suggest anoxia. FeHR/FeT values of 0.22–0.38 represent possible anoxia and should be interpreted with caution. Fepy/FeHR values of < 0.6 indicate deposition was in an anoxic-ferruginous setting, while values of > 0.8 indicate euxinic conditions. Fepy/FeHR values of 0.6–0.8 record possible euxinia and should be interpreted with caution. Abbreviations: FeT – total iron; FeHR – highly reactive iron; Fepy – iron pyrite; TOC – total organic carbon; DY – Dengying Formation; UD – Upper Dolostone. The location of the Miaohe Biota is indicated (Xiao et al. Reference Xiao, Yuan, Steiner and Knoll2002).

Fepy/FeHR values (0.00 ≤ Fepy/FeHR ≤ 0.41) appear to indicate anoxic-ferruginous conditions. However, as discussed in Section 5.a., evidence for pyrite weathering and Feox enrichment (e.g. samples M0.5, M14 and M10; Table 1; Fig. 3) together imply that primary Fepy/FeHR may have been diminished due to secondary alteration. Similar Fepy/FeHR data from Li et al. (Reference Li, Planavsky, Shi, Zhang, Zhou, Cheng, Tarhan, Luo and Xie2015) (0.07 < Fepy/FeHR < 0.92) are likely more representative of water-column redox state, particularly in the uppermost, non-fossiliferous section where Fepy/FeHR ratios suggest euxinia (0.74 ≤ Fepy/FeHR ≤ 0.92, with one exception at 15.4 m).
5.c. Redox-sensitive trace metals
Although most samples studied record Mo, U, V and Cr enrichment relative to average shale values (McLennan, Reference McLennan2001), four discrete ‘intervals’ of trace metal enrichment can be identified (Fig. 4). The first interval occurs at a stratigraphic height of 2–3 m and records moderate trace metal enrichment (e.g. Mo EFs: 4.29–5.46; U EFs: 2.96–4.92; Cr EFs: 2.35–3.68). For this interval, Mo EFs are increased relative to Cr. Mo/TOC, U/TOC and V/TOC values are low, at 0.91, 1.16 and 21.71 respectively. At a stratigraphic height of 3–12 m, trace metal enrichment is generally reduced and Mo is depleted relative to Cr (Mo EFs: 0.89–3.26; Cr EFs: 1.73–3.23). Although increased, trace metal/TOC values remain low over this interval (Mo/TOC: 0.35–1.40; U/TOC: 0.90–3.46; V/TOC: 24.04–149.22). A third interval occurs at a stratigraphic height of 12–21 m and is characterized by increased trace metal enrichment (Mo EFs: 2.32–11.09; V EFs: 1.77–4.62; U EFs: 2.64–9.97; Cr EFs: 2.43–5.76). Mo EFs are greater than Cr EFs, and low trace metal/TOC values similar to the first interval are also recorded (Mo/TOC: 0.49–1.01; U/TOC: 1.02–2.08; V/TOC: 18.85–43.02). Lastly, a interval of reduced trace metal enrichment is recorded at a stratigraphic height of 21–26.4 m (Mo EFs: 2.91–5.06; U EFs: 2.30–3.64; Cr EFs: 1.83–2.68). Patterns of trace metal enrichment are not observed and there is no clear relationship between Cr and Mo. V does not show enrichment, with recorded V EFs of 0.84–1.26, typical of average continental crust values. Although initially low, Mo/TOC, U/TOC and V/TOC values rapidly increase with increasing stratigraphic height (e.g. Mo/TOC values of 0.47, 1.11 and 9.20 at 22.9, 24.9 and 26.4 m, respectively).
As discussed previously, the samples used in Li et al. (Reference Li, Planavsky, Shi, Zhang, Zhou, Cheng, Tarhan, Luo and Xie2015) are less weathered than those used in this study (Fig. 3), providing an opportunity to investigate the potential effects of weathering on the distribution of redox-sensitive trace metals. The mean concentrations of Mo, V and Cr in our weathered samples are lower (online Supplementary Material) and statistically different (t-test, P-values < 0.05) to those from Li et al. (Reference Li, Planavsky, Shi, Zhang, Zhou, Cheng, Tarhan, Luo and Xie2015). The mean enrichment factors are statistically different for Cr and V (t-test, P-values < 0.05) but statistically indistinguishable for Mo (t-test, P-values > 0.05) (online Supplementary Material). This suggests that the recorded enrichments of redox-sensitive trace metals may have been altered by weathering to some extent. Despite the discrepancy in enrichment factor values, the stratigraphic trends are broadly consistent and the impact on palaeoredox interpretation is limited.
5.d. Nitrogen isotopes
Sedimentary total nitrogen (TN) values for the Miaohe section samples range from 0.006 to 0.057 wt% (mean of 0.024 wt%). δ15N data are generally consistent, ranging from 3.85‰ at 5 m stratigraphic height to 1.64‰ at 18.2 m stratigraphic height (Table 1; Fig. 4). Generally, δ15N data show a steady decrease with increasing stratigraphic height upwards through the Miaohe section.
Although it is possible that clay-bound nitrogen may have influenced nitrogen isotope values, the strong positive covariation between TN and TOC (R 2 = 0.64; online Supplementary Material) together with a near-zero intercept for Miaohe Member shales suggests that any contribution from allochthonous clay-bound N is limited. In addition, thermal nitrogen volatilization preferentially removes 14N during thermal maturation. There is no obvious covariation between δ15N and TN values for the Miaohe Member shales (online Supplementary Material), indicating limited impact on δ15N values.
5.e. Carbon isotopes
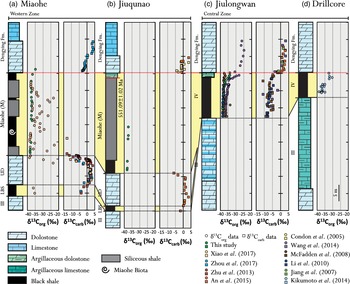
Sedimentary TOC values for the Miaohe section samples range from 0.10 to 2.69 wt% (mean of 1.19 wt%) (Table 1). With the exception of a calcareous sample at 26.4 m stratigraphic height, δ13Corg values range from −36.7 to −38.3‰ (Table 1; Fig. 5) and therefore occur within the DST IV domain (McFadden et al. Reference McFadden, Huang, Chu, Jiang, Kaufman, Zhou, Yuan and Xiao2008; Li et al. Reference Li, Love, Lyons, Fike, Sessions and Chu2010; Wang et al. Reference Wang, Shi, Jiang and Tang2014; Xiao et al. Reference Xiao, Bykova, Kovalick and Gill2017). Generally, a subtle c. 3‰ increase in δ13Corg values with increasing stratigraphic height is observed. At Jiuqunao, TOC values for the upper black shale range from 0.55 to 5.63 wt% (mean of 2.80 wt%). Similar to at Miaohe, δ13Corg values at Jiuqunao are between −37.3 and −38.1‰ and therefore consistently within the DST IV domain (Fig. 5). A slight increase in δ13Corg values with increasing stratigraphic height is also observed. The δ13Corg values at Jiulongwan range from −33.9 to −38.4‰ (Fig. 5). A trend of increasing δ13Corg values upwards is observed, with the lower 10 samples recording values of less than −35‰, and the highest values occurring close to the boundary with the overlying Dengying Formation.
Lithostratigraphy, δ13Ccarb and δ13Ccarb profiles for Miaohe, Jiuqunao (Western Zone), Jiulongwan and the drillcore site (Central Zone). The yellow zone indicates the correlation proposed in this study. UD – Upper Dolomite; LBS – Lower Black Shale; III – Doushantuo Member III; IV – Doushantuo Member IV. The location of the ash bed dated at 551.09 ± 1.02 Ma by Schmitz (Reference Schmitz, Gradstein, Ogg, Schmitz and Ogg2012) is indicated, as is the location of the Miaohe Biota (Xiao et al. Reference Xiao, Yuan, Steiner and Knoll2002).

In general, thermal maturation during catagenesis and/or metagenesis would lead to preferential removal of 12C and loss of organic matter, thereby creating a diagnostic negative correlation between TOC and δ13Corg values. In the Miaohe section, only a very weak covariation between TOC and δ13Corg values is observed (online Supplementary Material). This suggests that the organic carbon isotopes have not been significantly influenced by thermal maturation.
6. Discussion
6.a. Carbon isotopes: chemostratigraphy and regional placement
Constraining the link between the Miaohe Biota and δ13C data at Miaohe, relative to δ13C data at adjacent sites, is necessary to ensure that a stratigraphic framework is developed for the Doushantuo Formation that allows broader Ediacaran correlation. Recorded δ13Corg data for the Shibantan Member and DST IV at Jiulongwan are discrete; typically, Shibantan Member δ13Corg values are −25 to −30‰ (Wang et al. Reference Wang, Shi, Jiang and Tang2014), while DST IV δ13Corg values are constrained to −35 to −40‰ (McFadden et al. Reference McFadden, Huang, Chu, Jiang, Kaufman, Zhou, Yuan and Xiao2008; Li et al. Reference Li, Love, Lyons, Fike, Sessions and Chu2010; Wang et al. Reference Wang, Shi, Jiang and Tang2014; Xiao et al. Reference Xiao, Bykova, Kovalick and Gill2017). With the exception of a single calcareous sample at the Doushantuo–Dengying boundary, the δ13Corg data obtained from the Miaohe Member at Miaohe in this study are remarkably similar to δ13Corg data (this study; McFadden et al. Reference McFadden, Huang, Chu, Jiang, Kaufman, Zhou, Yuan and Xiao2008; Li et al. Reference Li, Love, Lyons, Fike, Sessions and Chu2010; Wang et al. Reference Wang, Shi, Jiang and Tang2014) from DST IV at Jiulongwan (Fig. 5). It is therefore simple to infer at least partial correlation between the Miaohe Member and DST IV, and reject the inferred partial correlation with the younger Shibantan Member as proposed by An et al. (Reference An, Jiang, Tong, Tian, Ye, Song and Song2015). In Xiao et al. (Reference Xiao, Bykova, Kovalick and Gill2017), the main objection to this correlation (referred to as the ‘Z’ correlation) was that several samples from the Miaohe Member at Miaohe record δ13Corg values within the ‘Shibantan Domain’. Interestingly, δ13Corg values from the same section in this study are significantly less variable, conforming to recorded values from DST IV at Jiulongwan (McFadden et al. Reference McFadden, Huang, Chu, Jiang, Kaufman, Zhou, Yuan and Xiao2008; Li et al. Reference Li, Love, Lyons, Fike, Sessions and Chu2010; Wang et al. Reference Wang, Shi, Jiang and Tang2014; this study) and Jiuqunao (this study).
Patterns of δ13Corg data also provide support for correlation of the Miaohe Member with DST IV (Fig. 5). At Jiulongwan, Jiuqunao, Miaohe and the drillcore site described by Kikumoto et al. (Reference Kikumoto, Tahata, Nishizawa, Sawaki, Maruyama, Shu, Han, Komiya, Takai and Ueno2014), δ13Corg data for the Miaohe Member (Miaohe, Jiuqunao) and DST IV (Jiulongwan, drillcore) behave similarly, with δ13Corg values for all sites and from all datasets increasing. Below the contact with the overlying Dengying Formation, several datasets also show an abrupt increase in δ13Corg values (Jiuqunao: this study; Li et al. Reference Li, Love, Lyons, Fike, Sessions and Chu2010; Kikumoto et al. Reference Kikumoto, Tahata, Nishizawa, Sawaki, Maruyama, Shu, Han, Komiya, Takai and Ueno2014; Wang et al. Reference Wang, Shi, Jiang and Tang2014). Although the increase at Miaohe is less pronounced, the uppermost sample from this study records a δ13Corg value of −34.82‰, a significant increase from −36.72‰ recorded 1.5 m deeper in the section. Interestingly, this sample is calcareous and, although originally interpreted as part of the basal Hamajing Member, may have been collected from a minor argillaceous carbonate bed, similar to those observed at Jiulongwan (An et al. Reference An, Jiang, Tong, Tian, Ye, Song and Song2015; Xiao et al. Reference Xiao, Bykova, Kovalick and Gill2017) and Jiuqunao (Condon et al. Reference Condon, Zhu, Bowring, Wang, Yang and Jin2005; Zhu et al. Reference Zhu, Zhang and Yang2007; Lu et al. Reference Lu, Zhu, Zhang, Shields-Zhou, Li, Zhao, Zhao and Zhao2013; An et al. Reference An, Jiang, Tong, Tian, Ye, Song and Song2015; Xiao et al. Reference Xiao, Bykova, Kovalick and Gill2017). Although considered in this study to form part of the upper Doushantuo Formation, placement of this > 1 m thick carbonate unit has proved difficult; at Jiuqunao, it has been variously regarded as part of the basal Dengying Formation (Lu et al. Reference Lu, Zhu, Zhang, Shields-Zhou, Li, Zhao, Zhao and Zhao2013) or upper Doushantuo Formation (Condon et al. Reference Condon, Zhu, Bowring, Wang, Yang and Jin2005; Zhu et al. Reference Zhu, Zhang and Yang2007; An et al. Reference An, Jiang, Tong, Tian, Ye, Song and Song2015; Xiao et al. Reference Xiao, Bykova, Kovalick and Gill2017). In addition to uncertainty over placement of this minor carbonate unit, it should be noted that the Dengying–Doushantuo contact is transitional, with variable expression depending on locality. It is therefore unlikely that the Dengying–Doushantuo contact has been consistently interpreted between sites. At Jiuqunao, an ash bed found underlying the minor argillaceous carbonate unit is used to date the uppermost Miaohe Member (550.55 ± 0.75 Ma, Condon et al. Reference Condon, Zhu, Bowring, Wang, Yang and Jin2005; 551.09 ± 1.02 Ma, Schmitz, Reference Schmitz, Gradstein, Ogg, Schmitz and Ogg2012) and the placement of the minor carbonate bed has implications for constraining the timing of deposition of the Miaohe Member.
At Jiulongwan, Jiuqunao and Miaohe, δ13Ccarb data further support correlation of the Miaohe Member with DST IV. For each site, multiple datasets record the same trend: an increase from negative δ13Ccarb values at the Dengying–Doushantuo contact, to positive values further up the section (Jiang et al. Reference Jiang, Kaufman, Christie-Blick, Zhang and Wu2007; Wang et al. Reference Wang, Shi, Jiang and Tang2014; An et al. Reference An, Jiang, Tong, Tian, Ye, Song and Song2015; Xiao et al. Reference Xiao, Bykova, Kovalick and Gill2017; Zhou et al. Reference Zhou, Xiao, Wang, Guan, Ouyang and Chen2017) (Fig. 5). This similarity between not only δ13Corg data, but δ13Ccarb data for Miaohe, Jiulongwan, Jiuqunao and the drillcore site is unlikely to be coincidental, and a potential third correlation – that the Miaohe Member cannot be correlated with either the Shibantan Member or DST IV as tentatively discussed in Xiao et al. (Reference Xiao, Bykova, Kovalick and Gill2017) – can be rejected.
The DST IV δ13Corg and δ13Ccarb data from Baiguoyuan, a site located along the northern flank of the Huangling anticline (Qian et al. Reference Qian, Zhensheng and Xinzhi1995; Zhuang et al. Reference Zhuang, Lu, Fu, Liu, Ren and Zou1999; Wallis, Reference Wallis2006; Zhu et al. Reference Zhu, Lu, Zhang, Zhao, Li, Aihua, Zhao and Zhao2013; Och et al. Reference Och, Cremonese, Shields-Zhou, Poulton, Struck, Ling, Li, Chen, Manning, Thirlwall, Strauss and Zhu2016), provides further support for correlation of DST IV with the Miaohe Member at Miaohe. For this section, the same upwards recovery of δ13Ccarb data (from −7.42‰ to +4.86‰) is recorded across the Dengying–Doushantuo contact, while δ13Corg data for DST IV remains within the ‘DST IV domain’ (see Xiao et al. Reference Xiao, Bykova, Kovalick and Gill2017) and shows a consistency similar to δ13Corg data from DST IV at Jiulongwan (this study; McFadden et al. Reference McFadden, Huang, Chu, Jiang, Kaufman, Zhou, Yuan and Xiao2008; Li et al. Reference Li, Love, Lyons, Fike, Sessions and Chu2010; Wang et al. Reference Wang, Shi, Jiang and Tang2014) and the Miaohe Member at Jiuqunao and Miaohe (this study).
Although δ13C data provide evidence for correlation of the Miaohe Member at Jiuqunao and Miaohe with DST IV, placement of the LBS unit is less clear. An et al. (Reference An, Jiang, Tong, Tian, Ye, Song and Song2015) correlate the LBS with DST IV, while Zhou et al. (Reference Zhou, Xiao, Wang, Guan, Ouyang and Chen2017) and Xiao et al. (Reference Xiao, Bykova, Kovalick and Gill2017) consider the sum of the LBS, intermediate dolostone and Miaohe Member to correlate with DST IV. Zhou et al. (Reference Zhou, Xiao, Wang, Guan, Ouyang and Chen2017) suggest that, in the latter scenario, an eastwards facies change would result in the disappearance of the intermediate dolostone in the Central Zone (Fig. 1b). Considering that basinal-scale rotational sliding occurred during deposition of the overlying lower Dengying/Liuchapo Formation (e.g. Vernhet et al. Reference Vernhet, Heubeck, Zhu and Zhang2007; Zhu et al. Reference Zhu, Lu, Zhang, Zhao, Li, Aihua, Zhao and Zhao2013), and the recognition that such a slide is present at Miaohe (Zhu et al. Reference Zhu, Lu, Zhang, Zhao, Li, Aihua, Zhao and Zhao2013), we consider it more likely that the LBS, when present, represents a portion of DST IV that has acted as a slip surface, carrying deformed dolostones of the Hamajing Member (the intermediate dolostone with positive δ13Ccarb values). This interpretation appears the most parsimonious explanation for the lack of such units, or related isotopic complexity at the relatively undisturbed Jiulongwan section in the east.
6.b. Palaeoredox proxies
Several studies indicate that the oceanic redox environment of southern China during the Ediacaran was spatially complex (e.g. Li et al. Reference Li, Love, Lyons, Fike, Sessions and Chu2010, Reference Li, Planavsky, Shi, Zhang, Zhou, Cheng, Tarhan, Luo and Xie2015; Och et al. Reference Och, Cremonese, Shields-Zhou, Poulton, Struck, Ling, Li, Chen, Manning, Thirlwall, Strauss and Zhu2016; Sahoo et al. Reference Sahoo, Planavsky, Jiang, Kendall, Owens, Wang, Shi, Anbar and Lyons2016; Zhu et al. 2018). Previous Fe speciation, trace metal and pyrite framboid analyses from the Miaohe Member at Miaohe indicate that deposition of the lower, Miaohe Biota-associated shales was in a suboxic to anoxic but non-sulphidic environment, while the uppermost shales were deposited under euxinic conditions (Li et al. Reference Li, Planavsky, Shi, Zhang, Zhou, Cheng, Tarhan, Luo and Xie2015). At the adjacent Jiulongwan and Jiuqunao sites, Fe speciation, trace metal and pyrite framboid data provide evidence for deposition in dominantly euxinic conditions (Li et al. Reference Li, Love, Lyons, Fike, Sessions and Chu2010, Reference Li, Planavsky, Shi, Zhang, Zhou, Cheng, Tarhan, Luo and Xie2015). New Fe speciation, trace metal and δ15N data are discussed below, providing additional redox information for the period of deposition of the Miaohe Member at Miaohe.
6.b.1. Iron speciation and redox-sensitive trace metals
In this study, FeHR/FeT values are all > 0.46 and therefore suggest persistent anoxia during deposition of the Miaohe Member (Fig. 4). Although Li et al. (Reference Li, Planavsky, Shi, Zhang, Zhou, Cheng, Tarhan, Luo and Xie2015) mainly record FeHR/FeT values greater than the anoxic threshold (0.38) for the same section, several values at 4.9–6.9 m occur within the ‘possibly anoxic’ and ‘oxic’ domains, roughly the same stratigraphic height as the preserved Miaohe Biota (Fig. 4). It should be noted, however, that Li et al. (Reference Li, Planavsky, Shi, Zhang, Zhou, Cheng, Tarhan, Luo and Xie2015) record a greater number of data points over the fossiliferous section, and that the FeHR/FeT data with the lowest values from this study occur over roughly the same interval.
Although most of the Miaohe Member at Miaohe was likely deposited in an anoxic water-column, distinguishing euxinic and anoxic-ferruginous conditions is more complex. The Fepy/FeHR ratios obtained in this study (0.00 ≤ Fepy/FeHR ≤ 0.41) cannot be relied upon due to secondary pyrite weathering (see Section 5.a.; Figs 2, 3, 6). Fepy/FeHR data obtained from rocks of the same site and stratigraphic setting by Li et al. (Reference Li, Planavsky, Shi, Zhang, Zhou, Cheng, Tarhan, Luo and Xie2015) are consistently higher (0.07 ≤ Fepy/FeHR ≤ 0.92) and, in the uppermost c. 10 m, indicative of euxinia (Fig. 4). In this current study, patterns of trace metal enrichment also support at least periodic euxinia, particularly in the uppermost Miaohe Member. For clarity, five discrete zones can be discerned using trace metals (Fig. 4): (1) euxinia at 2–3 m as indicated by moderate overall trace metal enrichment and an increased enrichment of Mo relative to Cr; (2) anoxic, non-sulphidic conditions between 3–6.5 m and 7.5–12 m, as indicated by an overall decrease in trace metal enrichment and the increased enrichment of Cr relative to Mo; (3) persistent euxinia at 12–21 m as indicated by a relatively rapid increase in trace metal enrichment, and an increased enrichment of Mo relative to Cr; (4) an anoxic, but not necessarily sulphidic environment, as indicated by decreasing trace metal concentrations and similar enrichments of Mo and Cr at 21–26.4 m; and (5) an anoxic to suboxic setting during deposition of the shales at 7–8 m, whereby enrichments in U and V are minor and Mo is depleted (Fig. 3). Trace metal data for the same section from Li et al. (Reference Li, Planavsky, Shi, Zhang, Zhou, Cheng, Tarhan, Luo and Xie2015) are indicative of suboxic to anoxic, but non-sulphidic conditions; notably, Mo concentrations are < 3 ppm and therefore close to crustal values. The Fepy/FeHR ratios from Li et al. (Reference Li, Planavsky, Shi, Zhang, Zhou, Cheng, Tarhan, Luo and Xie2015) for the lower Miaohe Biota-associated shales mostly fall within the ferruginous domain (Figs 4, 6), although it is important to note that the proportion of Feox found in some of these samples (e.g. MH-5 and MH-9; Li et al. Reference Li, Planavsky, Shi, Zhang, Zhou, Cheng, Tarhan, Luo and Xie2015) could indicate secondary pyrite weathering (Fig. 3). Li et al. (Reference Li, Planavsky, Shi, Zhang, Zhou, Cheng, Tarhan, Luo and Xie2015) suggest that any impact of weathering on their samples was limited; however, it remains possible that the ferruginous signal recorded by the lowermost shales is inaccurate.
FeHR/FeT versus Fepy/FeHR for this study (solid black points) and Li et al. (Reference Li, Planavsky, Shi, Zhang, Zhou, Cheng, Tarhan, Luo and Xie2015) (white points). Dotted red lines indicate thresholds: first, an FeHR/FeT value of > 0.38 indicates anoxia, while a value of > 0.22 indicates possible anoxia; and second, an Fepy/FeHR value of > 0.8 indicates euxinia, a value of > 0.6 indicates possible euxinia and a value of < 0.6 indicates ferruginous conditions.

6.b.2. Nitrogen isotopes
Nitrogen isotope (δ15Nsed) values from Miaohe Member samples are generally stable between 1.5 and 4‰, with the highest δ15Nsed values found in the lower half of the section (Fig. 4). Together with iron speciation and trace metal data, these δ15Nsed values imply redox stratification during deposition of the Miaohe Member. In a stratified water-column, nitrate is depleted by assimilation in the upper mixed layer and subsequently denitrified at the redox transition zone, below which ammonia accumulates and is quantitatively converted to N2 or N2O by coupled nitrification, denitrification and anammox (Ader et al. Reference Ader, Sansjofre, Halverson, Busigny, Trindade, Kunzmann and Nogueira2014). Because of the different processes operating vertically in a stratified water mass, sedimentary nitrogen isotope values relate to the positioning of the intermediate redox transition zone. Typically, δ15Nsed values of c. 0‰ can be expected in this setting due to nitrate limitation and productivity fuelled by N2-fixation (Quan & Falkowski, Reference Quan and Falkowski2009). Instead, δ15Nsed values of between 1.5 and 4‰ are recorded, implying partial nitrate availability and normal productivity. Additionally, a source of nitrate is necessary to sustain euxinia, and inferred nitrate availability during deposition of the Miaohe Member at Miaohe is consistent with the Fe speciation data from Li et al. (Reference Li, Planavsky, Shi, Zhang, Zhou, Cheng, Tarhan, Luo and Xie2015) and trace metal enrichments observed in this study. At Miaohe, it is possible that surface water carried nitrate from the open ocean across the sill of the otherwise restricted basin, thereby reducing the influence of N2-fixation on δ15Nsed values. Regardless, basin restriction would still have resulted in a nitrate-limited environment, with loss due to denitrification and assimilation. This is largely consistent with the hypothesis put forward by Kikumoto et al. (Reference Kikumoto, Tahata, Nishizawa, Sawaki, Maruyama, Shu, Han, Komiya, Takai and Ueno2014), where steadily decreasing δ15Nsed values upwards through the Doushantuo Formation are thought to be the result of oxygenation of the global ocean, oxidation of a dissolved organic carbon pool and a gradual increase in the nitrate reservoir. Evidence for this is also provided in the form of Mo and V concentrations (Scott et al. Reference Scott, Lyons, Bekker, Shen, Poulton, Chu and Anbar2008; Och et al. Reference Och, Cremonese, Shields-Zhou, Poulton, Struck, Ling, Li, Chen, Manning, Thirlwall, Strauss and Zhu2016; Sahoo et al. Reference Sahoo, Planavsky, Jiang, Kendall, Owens, Wang, Shi, Anbar and Lyons2016) and δ34Spy, δ98Mo and δ238U data (McFadden et al. Reference McFadden, Huang, Chu, Jiang, Kaufman, Zhou, Yuan and Xiao2008; Chen et al. Reference Chen, Ling, Vance, Shields-Zhou, Zhu, Poulton, Och, Jiang, Li, Cremonese and Archer2015; Kendall et al. Reference Kendall, Komiya, Lyons, Bates, Gordon, Romaniello, Jiang, Creaser, Xiao, McFadden, Sawaki, Tahata, Shu, Han, Li, Chu and Anbar2015; Och et al. Reference Och, Cremonese, Shields-Zhou, Poulton, Struck, Ling, Li, Chen, Manning, Thirlwall, Strauss and Zhu2016; Sahoo et al. Reference Sahoo, Planavsky, Jiang, Kendall, Owens, Wang, Shi, Anbar and Lyons2016; Shi et al. Reference Shi, Li, Luo, Huang, Algeo, Jin, Zhang and Cheng2018; Ostrander et al. Reference Ostrander, Sahoo, Kendall, Jiang, Planavsky, Lyons, Nielsen, Owens, Gordon, Romaniello and Anbar2019).
Nitrogen isotope data are also available for the Jiuqunao, Jiulongwan and the drillcore correlative sites (Kikumoto et al. Reference Kikumoto, Tahata, Nishizawa, Sawaki, Maruyama, Shu, Han, Komiya, Takai and Ueno2014; Och et al. Reference Och, Cremonese, Shields-Zhou, Poulton, Struck, Ling, Li, Chen, Manning, Thirlwall, Strauss and Zhu2016). For DST IV, δ15Nsed values at Jiulongwan are stable at c. 4‰, while those at the drillcore site are broadly similar to δ15Nsed data from Miaohe (2.3‰ < δ15Nsed < 4.2‰). A similar depositional setting to Miaohe can therefore be inferred, characterized by water-column stratification, partial nitrate availability and normal productivity. Lower values are found at Jiuqunao (0.5‰ < δ15Nsed < 2.5‰), implying nitrate limitation and productivity fuelled by nitrogen fixation. Because of the close proximity of these sites, the different δ15Nsed values indicate a structurally complex depositional basin, with isotopic nitrogen values relating to (1) sill depth and (2) access to the open ocean and dissolved nitrate inventory.
6.c. Palaeogeographic control on local redox conditions
As previously mentioned, the Miaohe Member at Miaohe and Jiuqunao, and DST IV at Jiulongwan are thought to have been deposited in an intra-shelf lagoon environment (Vernhet & Reijmer, Reference Vernhet and Reijmer2010; Jiang et al. Reference Jiang, Shi, Zhang, Wang and Xiao2011; Zhu et al. Reference Zhu, Lu, Zhang, Zhao, Li, Aihua, Zhao and Zhao2013). In this setting, intra-basinal water-column redox conditions would have related strongly to sill depth and communication with the open ocean. The trace metal/TOC proxy data examined in this study can be compared with data from modern anoxic systems to provide an insight into basin restriction and the palaeogeographic controls on redox conditions. For the Black Sea, typical renewal times and Mo/TOC values are c. 400–800 years and c. 4.5, respectively, while those for the Framvaren Fjord are c. 100–125 years and c. 9, respectively (Algeo & Rowe, Reference Algeo and Rowe2012). Trace metal/TOC proxy values for the Miaohe Member are lower than those of the Black Sea, therefore implying basin restriction and limited communication generally during deposition. However, two discrete trace metal/TOC zones can also be discerned (Fig. 4): (1) a period of moderate restriction at stratigraphic height 2–12 m (e.g. 0.27 < Mo/TOC < 1.40; 0.90 < U/TOC < 3.46); and (2) a period of extensive restriction at stratigraphic height 12–23 m (e.g. 0.35 < Mo/TOC < 1.01; 0.61 < U/TOC < 2.08). The section of the Miaohe Member from 12 to 23 m also records high Fepy/FeHR values and strong Mo, U, V and Cr enrichment, indicating that deposition of this unit occurred in a restricted basin characterized by poor ventilation, euxinia and extended water renewal times. Lastly, an abrupt increase in Mo/TOC, U/TOC and V/TOC values coincident with a lithological change from shale to dolostone occurs at stratigraphic height 23–25 m (Fig. 4).
Isotope data, including δ34Spy, δ98Mo and δ238U, indicate widespread oxygenation during late Ediacaran time (McFadden et al. Reference McFadden, Huang, Chu, Jiang, Kaufman, Zhou, Yuan and Xiao2008; Chen et al. Reference Chen, Ling, Vance, Shields-Zhou, Zhu, Poulton, Och, Jiang, Li, Cremonese and Archer2015; Kendall et al. Reference Kendall, Komiya, Lyons, Bates, Gordon, Romaniello, Jiang, Creaser, Xiao, McFadden, Sawaki, Tahata, Shu, Han, Li, Chu and Anbar2015; Och et al. Reference Och, Cremonese, Shields-Zhou, Poulton, Struck, Ling, Li, Chen, Manning, Thirlwall, Strauss and Zhu2016; Sahoo et al. Reference Sahoo, Planavsky, Jiang, Kendall, Owens, Wang, Shi, Anbar and Lyons2016; Shi et al. Reference Shi, Li, Luo, Huang, Algeo, Jin, Zhang and Cheng2018; Ostrander et al. Reference Ostrander, Sahoo, Kendall, Jiang, Planavsky, Lyons, Nielsen, Owens, Gordon, Romaniello and Anbar2019). Redox conditions during deposition of the Miaohe Member and DST IV can therefore be attributed to local basin configuration and restriction as indicated by trace metal/TOC proxy data. Several authors (e.g. Li et al. Reference Li, Planavsky, Shi, Zhang, Zhou, Cheng, Tarhan, Luo and Xie2015; Och et al. Reference Och, Cremonese, Shields-Zhou, Poulton, Struck, Ling, Li, Chen, Manning, Thirlwall, Strauss and Zhu2016; Bowyer et al. Reference Bowyer, Wood and Poulton2017) discuss the importance of partially conflicting redox data despite the acute geographical proximity of several of the intra-basinal study sites. Building on the ‘sulphidic-wedge’ model proposed by Li et al. (Reference Li, Love, Lyons, Fike, Sessions and Chu2010), Och et al. (Reference Och, Cremonese, Shields-Zhou, Poulton, Struck, Ling, Li, Chen, Manning, Thirlwall, Strauss and Zhu2016) and Bowyer et al. (Reference Bowyer, Wood and Poulton2017) propose a scenario where local redox conditions would have related to the movement of a stratified euxinic wedge over subsequent silled basins due to eustatic sea-level change. In this setting, the sustained trace metal enrichment and δ15Nsed levels at Miaohe can be explained by surface water flow across the sill from the open ocean, where redox-sensitive trace metals were likely abundant. Communication with a largely oxygenated open ocean would have also provided a mechanism for infiltration by the low-diversity Miaohe Biota assemblage, the preservation of which at c. 7 m stratigraphic height implies sporadic oxygenation and eustatic change, albeit in a generally oxygen stressed environment. Although sedimentary trace metal enrichments and sustained euxinia at Jiulongwan (Li et al. Reference Li, Love, Lyons, Fike, Sessions and Chu2010) similarly indicate access to the open ocean, low Mo enrichments (Li et al. Reference Li, Planavsky, Shi, Zhang, Zhou, Cheng, Tarhan, Luo and Xie2015; Och et al. Reference Och, Cremonese, Shields-Zhou, Poulton, Struck, Ling, Li, Chen, Manning, Thirlwall, Strauss and Zhu2016) and lower δ15Nsed values (Och et al. Reference Och, Cremonese, Shields-Zhou, Poulton, Struck, Ling, Li, Chen, Manning, Thirlwall, Strauss and Zhu2016) at Jiuqunao imply sustained restriction and limited access to the open-ocean nitrate and redox-sensitive trace metal inventories. Because of the close proximity of these sites, considerable basin complexity can be inferred.
To summarize, eustatic sea-level change would have controlled communication between the structurally complex intra-shelf basin and the open ocean. During a period of eustatic sea-level rise, increased nitrate availability would have fuelled productivity, enabling the development of euxinic bottom water. In this setting, trace metals from the open ocean would have been easily scavenged and sequestered by Miaohe Member sediments. At more proximal locations, access to the open ocean was reduced, euxinia was inhibited and trace metals were not easily scavenged.
6.d. Palaeoredox and evolution of the Miaohe Biota
Molecular evidence points to the emergence of complex metazoans, including crown-group demosponges and cnidarians prior to deposition of the Miaohe Member (Erwin et al. Reference Erwin, Laflamme, Tweedt, Sperling, Pisani and Peterson2011). Despite this, the Miaohe Biota comprises a simple, low-diversity assemblage. This lack of complexity is likely the result of quasi-continuous anoxic-stress within the intra-shelf lagoon environment; however, nutrient availability, water energy and temperature fluctuations could have also contributed (Li et al. Reference Li, Planavsky, Shi, Zhang, Zhou, Cheng, Tarhan, Luo and Xie2015). In this restricted setting, periodic access to the open ocean could have provided partial relief from these stresses, enabling simple metazoan communities to persist. This is consistent with their occurrence during a period of inferred eustatic sea-level rise. As previously noted by Li et al. (Reference Li, Planavsky, Shi, Zhang, Zhou, Cheng, Tarhan, Luo and Xie2015), the Miaohe Biota colonization is linked to spatially variable redox patterns. At Jiulongwan and in the overlying Miaohe Member at Miaohe, euxinia and toxic stress would have inhibited metazoan colonization, while the absence of the Miaohe Biota at Jiuqunao is likely due to isolation from the open ocean. If continental margins at other locations globally were similarly redox-stressed, then the suppression of evolution can be inferred for the late Ediacaran.
7. Conclusions
The Miaohe Member has previously been partially correlated with DST IV (Xiao et al. Reference Xiao, Bykova, Kovalick and Gill2017; Zhou et al. Reference Zhou, Xiao, Wang, Guan, Ouyang and Chen2017) or with the younger Shibantan Member of the Dengying Formation (An et al. Reference An, Jiang, Tong, Tian, Ye, Song and Song2015). New Miaohe Member δ13C data from Miaohe and Jiuqunao are remarkably similar to δ13C data from DST IV at Jiulongwan, and partial correlation with DST IV at Jiulongwan can therefore be inferred. Although Zhou et al. (Reference Zhou, Xiao, Wang, Guan, Ouyang and Chen2017) and Xiao et al. (Reference Xiao, Bykova, Kovalick and Gill2017) consider the sum of the LBS, intermediate dolostone and Miaohe Member to correlate with DST IV, it is likely that the LBS represents a portion of the Miaohe Member that has acted as a slip surface, carrying deformed dolostones of the Hamajing Member (the intermediate dolostone). This interpretation appears to be the most parsimonious explanation for the lack of such units, or related isotopic complexity at the relatively undisturbed Jiulongwan section in the east.
New FeHR/FeT data from the Miaohe Member at Miaohe is indicative of sustained anoxia, while patterns of redox-sensitive trace metal enrichment imply water-column euxinia during deposition of the uppermost Miaohe Member shales. Miaohe Biota-associated and over- and underlying shales record limited relative Mo enrichment and were likely deposited in a predominantly anoxic but non-euxinic setting. These conclusions are largely supported by Fepy/FeHR data from Li et al. (Reference Li, Planavsky, Shi, Zhang, Zhou, Cheng, Tarhan, Luo and Xie2015). Secondary oxidative weathering and Fepy depletion is recorded by the samples obtained for this study, and Fepy/FeHR ratios therefore cannot be interpreted.
Trace metal/TOC proxy values indicate that the Miaohe Member at Miaohe was deposited in a water-column characterized by restriction and limited renewal. Despite this, sustained trace metal concentrations and δ15Nsed values imply at least partial access to open-ocean inventories. As discussed in Och et al. (Reference Och, Cremonese, Shields-Zhou, Poulton, Struck, Ling, Li, Chen, Manning, Thirlwall, Strauss and Zhu2016) and Bowyer et al. (Reference Bowyer, Wood and Poulton2017), it is likely that communication with the open ocean at Miaohe, Jiuqunao, Jiulongwan and other intra-shelf basin sites was controlled by a sill; during periods of eustatic sea-level rise, nitrate and trace metal inventories would have been replenished, thereby facilitating the development of euxinic bottom water. The intra-shelf basin was also likely characterized by significant structural complexity, with limited communication between sites. At more proximal locations such as Jiuqunao, access to the open ocean would have been reduced, inhibiting water-column euxinia. This environmental stress could have influenced Ediacaran metazoan development in southern China and other similar sites globally.
Acknowledgements
This work was supported by funding from the joint NERC-NSFC Biosphere Evolution Transitions and Resilience (BETR) programme (NE/P013643/1). SWP acknowledges support from a Royal Society Wolfson Research Merit Award. CL was supported by the NSFC program (Grants # 41821001 and # 41825019). We would like to thank Gary Tarbuck and Dr Anne-Lise Jourdan (both UCL) for laboratory assistance.
Supplementary material
To view supplementary material for this article, please visit https://doi.org/10.1017/S0016756821000261