


Ever since Weber ([1921] Reference Weber, Gerth and Mills1958) distinguished rational bureaucracy staffed by impersonal, meritocratically selected technocrats from patriarchical management by loyal partisans, scholars have explored the underlying logics driving government organizations. Today Weber's distinction matters nowhere more than in China, where an authoritarian regime governs nearly a fifth of the world's people. Thirty years of spectacular economic performance has prompted a sizable political science and economics literature linking the bureaucracy of the Chinese Communist Party (CCP) to China's economic success. Though the link seems natural, there are good theoretical and empirical reasons to question whether yardstick competition among local officials really caused China's spectacular growth. Theoretically, a performance-based promotion system in the top echelon of the party requires a relatively unified and far-horizoned leadership that would systematically promote officials with the strongest performance (Olson Reference Olson1993; Olson and McGuire Reference Olson and McGuire1996). Yet theories of authoritarian politics and China scholarship suggest that the top leadership in China is as much preoccupied with internal struggle as with achieving regime-wide objectives like economic growth (Bueno de Mesquita et al. Reference Bueno de Mesquita, Smith, Siverson and Morrow2003; MacFarquhar and Schoenhals Reference MacFarquhar and Schoenhals2006; Nathan Reference Nathan1973; Svolik Reference Svolik2009; Tullock Reference Tullock1987). As such, it is far from clear that CCP cadre management institutions were directly responsible for China's economic performance.
Empirical work on the growth incentive embedded in CCP institutions shows cases where cadre evaluation appeared to encourage strong performance by county and township level officials (Edin Reference Edin2003; Whiting Reference Whiting, Yang and Naughton2004). Yet systematic tests of whether provincial administrators in high-growth regions were awarded with promotions look only at provincial officials, instead of the Central Committee power elite in the CCP, and measure only promotion in state bureaucratic ranks instead of the more important party ranking (Chen, Li, and Zhou Reference Chen, Li and Zhou2005; Li and Zhou Reference Li and Zhou2005; Maskin, Qian, and Xu Reference Maskin, Qian and Xu2000). And no qualitative or quantitative work addresses the potential selection bias that would arise if politically connected officials could influence the location of their next appointments to claim credit for preexisting growth trends.
This study departs from previous studies in five important ways. First, instead of providing yet another test of the growth impact of CCP institutions, we draw from the broader political economy literature on authoritarian regimes to derive a wider range of hypotheses on the factors that help cadres obtain higher positions in the party hierarchy. Second, instead of examining only the fortune of local administrators, we examine every full and alternate member of the CCP Central Committee through five party congresses from 1982 to 2002. Third, we make use of the CCP's own reports of elections to the Alternate Central Committee (ACC) and a new biographical database of Central Committee (CC) and ACC members to place the entire CCP power elite along a continuum in terms of their status within the ruling party. Fourth, we analyze the pattern of ranks within the Politburo Standing Committee (PSC), the Politburo, the CC, and the ACC using a novel Bayesian model of ranks that can estimate the individual-level correlates of rank even in rank data that are only partially observed. Finally, we purge the effects of any selection bias in appointment using a suite of estimates of preappointment expected provincial economic growth. In this manner, we are able to discern whether expected and unexpected economic performance had any impact on the party ranking of senior cadres throughout the reform period.
When we examine the entire CCP elite, we find no evidence that exceptional economic growth influenced ranking in the party hierarchy. This finding is robust even when we decompose economic performance into expected and unexpected growth and when we use broader measures of economic performance. We find that educational qualifications strongly (and provincial revenue collection and minority representation weakly) bolstered cadres’ ranking in some of the party congresses since 1982. Women faced significant disadvantages in three of the five congresses we examine. Most important, factional ties with various top leaders, as well as princeling status, boosted the chance of climbing higher in the CCP upper echelons through much of the reform period. In sum, CCP cadre management institutions were used by top leaders to maintain cadres’ human capital, coopt ethnic minorities, and raise revenue collection, all of which directly provided immediate payoffs to the regime. Our findings suggest that senior party leaders did not bolster public goods provision through yardstick competiton among provincial officials, but they did use promotion institutions to cultivate factions. These findings are consistent with the claim of Bueno de Mesquita et al. (Reference Bueno de Mesquita, Smith, Siverson and Morrow2003) that authoritarian regimes tend to deliver private goods to a relatively narrow winning coalition rather than to society at large.
MERITOCRATIC BUREAUCRACY AND ECONOMIC OUTCOMES
Since Weber made the distinction between bureaucracy and patrimonialism, political scientists have argued that government bureaucracies fall into either the meritocratic, impersonal type or the corrupt, clientelist type (Evans Reference Evans1995; Frye and Shleifer Reference Frye and Shleifer1997; Schneider Reference Schneider1993; Weber [1921] Reference Weber, Gerth and Mills1958). Explanations for why bureaucracies develop in disparate ways range from social capital (Putnam, Leonardi, and Nanetti Reference Putnam, Leonardi and Nanetti1993), to the level of external threat (Kang Reference Kang2002), to colonial legacies (Acemoglu, Johnson, and Robinson Reference Acemoglu, Johnson and Robinson2000). In turn, bureaucratic types are thought to explain complex economic outcomes. Thus, when market enhancing policies are implemented or when growth is high, some scholars attribute this to a meritocratic bureaucracy (Evans Reference Evans1995; Schneider and Maxfield Reference Schneider, Maxfield, Schneider and Maxfield1997).
In contemporary social science, the tendency to infer bureaucratic meritocracy from high growth is perhaps strongest in the study of China. Spectacular growth in the past three decades has motivated scholars to develop a variety of explanations of China's success, ranging from a proreform leadership (Fewsmith Reference Fewsmith1994; Shirk Reference Shirk1993), to de facto federalism (Qian, Weingast, and Montinola Reference Qian, Weingast and Montinola1995), to labor market mobility (Lin Reference Lin1992; Sachs et al. Reference Sachs, Woo, Fischer and Hughes1994).
Scholars have also looked to the efficiency or the institutional configuration of the Chinese bureaucracy as explanations of China's rapid growth. Unlike the Soviet Union, which had a unitary system of governance, the primary organizational principle in China was geography-based, thus giving rise to a multidivisional form (M-form) bureaucracy. Some claim the M-form bureaucracy, coupled with an extensive cadre evaluation system, provided strong incentives for regional administrators to compete with each other to generate high economic growth, in order to win promotion in the ruling CCP (Chen, Li, and Zhou Reference Chen, Li and Zhou2005; Li and Zhou Reference Li and Zhou2005; Maskin, Qian, and Xu Reference Maskin, Qian and Xu2000). This body of literature presents mixed evidence that the top two provincial officials (governors and party secretaries) in the reform period were typically rewarded with promotions for realizing better economic performance than their predecessors or their peers (Chen, Li, and Zhou Reference Chen, Li and Zhou2005; Li and Zhou Reference Li and Zhou2005; Tao et al. Reference Tao, Fubing, Lu and Zhu2010).
In addition to the quantitative findings, a larger qualitative literature on the evolution of the cadre evaluation system also seems to support the view of a performance-based elite promotion system in China. After the founding of the People's Republic of China, the CCP introduced formal methods of evaluating cadres, which were formally linked to their promotion. As Burns (Reference Burns1989) puts it, the cadre management system centered on “lists of leading positions, over which party units exercise the power to make appointments and dismissals; lists of reserves or candidates for these positions; and institutions and processes for making the appropriate personnel changes.” The Central Organization Department emerged as the key human resource manager of the CCP, although senior-level promotions were ultimately decided by members of the Politburo (Nathan and Gilley Reference Nathan and Gilley2002).
During his reign, Mao focused on ensuring the survival of the CCP regime according to his vision. Thus, he promoted cadres who shared or at least were willing to go along with his radical vision of society (Lee Reference Lee1991). After reform began in 1978, education credentials came to play a prominent role in the advancement of lower level cadres, and older cadres were strongly encouraged to retire (Cui Reference Cui2003; Landry Reference Landry2008; Manion Reference Manion1993; Walder, Li, and Treiman Reference Walder, Li and Treiman2000). Furthermore, the post-Mao leadership formalized a system of scoring junior and senior cadres, which served to keep track of their administrative performance on a series of “soft” and “hard” targets. Hard targets reflected core tasks crucial to the regime, including economic growth, fiscal collection, and maintaining stability, whereas soft targets included recruiting party members and propaganda work. Shortfalls on the soft targets could be outweighed by impressive performance in key areas. However, failing to fulfill hard targets led either to low overall scores or to mandatory administrative punishment (yipiao foujue), a powerful tool in the CCP's arsenal for political control (Edin Reference Edin2003). The existence of a comprehensive system for scoring officials on their policy performance seems to suggest that the Chinese elite was motivated by the scoring system to perform well (Edin Reference Edin2003; Landry Reference Landry2008; Whiting Reference Whiting, Yang and Naughton2004).
However, on both theoretical and empirical grounds, there are strong reasons to be skeptical of an easy linkage between a formal system of cadre evaluation and economic growth in China. Theoretically, linking a limited set of policy or economic outcomes with bureaucratic characteristics may result in a false causal inference. For one thing, bureaucratic characteristics tend to be time-invariant, whereas policy and growth outcomes change frequently over time. Moreover, seemingly reform policies can mask underlying corruption or inefficiencies. In Pinochet's Chile, for example, liberalization policies implemented by the “Chicago Boys” also allowed favored conglomerates to borrow heavily overseas to buy up prized financial assets, laying the groundwork for the financial crisis in the early 1980s (Haggard and Maxfield Reference Haggard, Maxfield, Keohane and Milner1996; Silva Reference Silva1996). The empirical findings on corruption also cast doubt on the linkage between bureaucratic characteristics and economic outcomes. Except in extreme cases, high growth generally is not harmed by a moderate degree of corruption (Svensson Reference Svensson2005).
Although meritocratic criteria may influence elite ranking in China, concluding that economic performance is the dominant criterion driving elite ranking goes too far. A merit or performance dominant bureaucracy assumes that the Chinese regime is unified and far-horizoned, and thus is motivated to maximize performance and long-term output (Olson and McGuire Reference Olson and McGuire1996). But leaders of nondemocratic regimes face constant threats of dethronement from mass uprisings or coups by regime insiders (Tullock Reference Tullock1987; Wintrobe Reference Wintrobe1998). Thus, autocratic rulers likely place a greater priority on maintaining short-term state capacity and buying the support of winning coalitions than on providing broadly encompassing goods such as economic growth (Bueno de Mesquita et al. Reference Bueno de Mesquita, Smith, Siverson and Morrow2003; Gandhi and Przeworski Reference Gandhi and Przeworski2006). China has witnessed its share of large-scale uprisings and intense political struggle at the top. Even after the chaotic Cultural Revolution, the top leader of the CCP was twice removed from power by irregular means.Footnote 1 Besides the Tiananmen protests in 1989, China also dealt with a series of large-scale protests motivated by ethnic and economic grievances in recent years (Pei Reference Pei2006). Huang (Reference Huang1996) and Sheng (Reference Sheng2007) argue that the conflict of interest between central and local governments compels the center to use its appointment control to obtain preferred outcomes, thus implicitly forgoing the appointment of the most capable officials. Because top Chinese leaders must address urgent concerns of stability and retaining office on a daily basis, we expect that the CCP often uses the personnel management system to promote these immediate goals, while neglecting more encompassing objectives like growth or fairness.
If political survival is a main concern, the top leader of a regime may shape policies, including the appointment of subordinates, to serve that end. One elite faction may pursue policies purely to undermine a rival faction, thus risking overall regime stability (Ramseyer and Rosenbluth Reference Ramseyer and Rosenbluth1998). Instead of expending resources to prevent a general uprising, leaders seeking to thwart an elite challenger may devote those resources to monitoring or cultivating the loyalty of senior officials (Svolik Reference Svolik2005). And instead of promoting officials with the strongest performance record, rival leaders may promote untalented but loyal followers to prevent a coup or to raise their relative standing (Easter Reference Easter1996; Egorov and Sonin Reference Egorov and Sonin2011; Nathan Reference Nathan1973). In other cases, an insecure leader may shuffle or promote officials simply to prevent an alliance between ambitious local officials and the populace (Debs Reference Debs2007).
Empirically, the literature linking China's cadre evaluation system and growth produces highly ambiguous and problematic results. First, the qualitative literature provides an in-depth description of the cadre evaluation system, which suggests a causal link between cadre evaluation and growth. However, the existence of an evaluation system as such does not prove a causal link. Furthermore, quantitative studies of city and county officials do not find much evidence for growth-based promotions (Guo Reference Guo2007; Landry Reference Landry2008). At the city level, for example, Landry (Reference Landry2008) finds that exceptional economic performance has almost no effect on the most likely internal promotion of mayors, to the position of party secretary.
Quantitative studies on provincial officials provide some evidence that exceptional economic growth in a province is correlated with the promotion of the top two officials in a province (Chen, Li, and Zhou Reference Chen, Li and Zhou2005; Li and Zhou Reference Li and Zhou2005; Maskin, Qian, and Xu Reference Maskin, Qian and Xu2000). These studies present a number of empirical shortcomings, however. First, they focus only on provincial officials, leaving out the majority of the party elite, who served in the central party apparatus, the army, and the central economic bureaucracy. A comprehensive analysis of elite incentive should include all full and alternate members of the CC, who make up the bulk of the power elite in the CCP (Kung and Chen Reference Kung and Chen2011; Shirk Reference Shirk1993). Measures of promotion are often poor: Li and Zhou (Reference Li and Zhou2005) define promotion as movement to a ministerial position or higher, but in the state bureaucracy, movement from provincial governorship to a ministerial position is horizontal, as provinces and ministries have the same bureaucratic rank. To measure whether such a rotation constituted a promotion, it is more useful to see whether a person's party rank improved, a clearer sign of advancement.
Methodologically, no previous study of elite promotion has taken into account the potential for selection bias (Chen, Li, and Zhou Reference Chen, Li and Zhou2005; Guo Reference Guo2007; Landry Reference Landry2008; Li and Zhou Reference Li and Zhou2005; Maskin, Qian, and Xu Reference Maskin, Qian and Xu2000). Aspiring provincial governors and party secretaries may perceive certain provinces as strong economic performers prior to a rotation, and may use political connections to engineer their appointments to claim credit. Under strategic appointment, observed correlation between exceptional growth and advancement might have been caused by strong political connections, rather than by economic performance per se.
HYPOTHESES
There are good theoretical and empirical reasons to doubt whether economic performance was the dominant factor driving elite advancement, despite China's geography-based administrative system and elaborate cadre evaluation system. Instead of only testing the impact of economic performance on elite ranking, we draw on the political economy literature on authoritarianism to derive two different sets of hypotheses. If we assumed that China was a unified regime with a long time horizon, we would expect performance, merit, and representation to play the dominant role in elite ranking. However, theories of elite power struggle in authoritarian regimes suggest that factional affiliation and princeling ties may play an important role in CCP elite ranking.
If the top leadership in China were unified and had a long time-horizon, it would have had a “sufficiently encompassing interest” in generating long-term growth and in developing tax collection capacity in an optimal way (Olson and McGuire Reference Olson and McGuire1996). Furthermore, to prevent large-scale collective action threatening the regime, a unified Chinese leadership would have combined repression with limited redistribution of its resources or greater representation for certain groups (Acemoglu and Robinson Reference Acemoglu and Robinson2006; Desai, Olofsgard, and Yousef Reference Desai, Olofsgard and Yousef2009; Gandhi and Przeworski Reference Gandhi and Przeworski2006; Olson and McGuire Reference Olson and McGuire1996; Wintrobe Reference Wintrobe1998). To accomplish these ends, a unified CCP regime would have promoted officials with a talent for generating growth, collecting taxes, and repressing dissent so that “no matter how strong a candidate's factional backing, he cannot be promoted without a record of administrative achievement” (Nathan and Gilley Reference Nathan and Gilley2002). From this understanding of elite ranking in China, we derive the following hypotheses:
Hypothesis R1.More educated cadres win higher rank than less educated cadres.
Hypothesis R2.Regional administrators who generate more economic growth or raise living standards are rewarded with high ranking in the Central Committee.
Hypothesis R3.Regional administrators who produce higher growth in fiscal revenue win higher rank.
Hypothesis R4.Officials with more experience in the CCP gain higher rank because they have accumulated more administrative experience.
Finally, ensuring female and minority representation in the higher reaches of the party may enhance the regime's legitimacy. Furthermore, minority representation may enhance stability by coopting potentially restive minority groups into the system (Dreyer Reference Dreyer1976, 113). Thus a unified authoritarian regime might systematically promote women and minorities.
Hypothesis R5.Being female or a member of an ethnic minority confers an advantage in the competition for high rank.
If a regime experiences concealed or overt power struggles at the top, faction-based promotion predominates. In factional politics, loyalty counts more than skills or performance on core tasks such as growth, revenue collection, and stability. Skills may even be a liability. Egorov and Sonin (Reference Egorov and Sonin2005) provide a convincing theoretical argument that dictators facing the threat of a coup will not always choose the most competent advisors: Clever subordinates may be too good at figuring out the expected payoffs of betraying the dictator; less capable officials are more loyal. Bueno de Mesquita et al. (Reference Bueno de Mesquita, Smith, Siverson and Morrow2003) also argue that autocrats find ways to channel resources to their supporters, including promoting them to senior regime positions. In a similar vein, China scholars long have postulated that Chinese leaders built networks of loyal followers to mitigate the fundamental uncertainty in elite politics (Dittmer Reference Dittmer1995; Nathan Reference Nathan1973; Pye Reference Pye1980, Reference Pye1992). These factional networks bound the interests of followers to their patrons through the distribution of economic resources and offices (Nathan Reference Nathan1973; Nathan and Tsai Reference Nathan and Tsai1995; Shih Reference Shih2008a).
When a factional patron comes under attack, followers remain loyal because they expect large payoffs for protecting the patron, who in turn promotes followers to the upper echelons of the regime. If elite political struggles loomed large in the minds of top CCP leaders, then followers’ records of loyalty would have been more important criteria for promotion than economic performance. When the factional logic dominates, individual leaders promote close allies rather than the most capable individuals, even if these appointments lead to the underprovision of regime-wide public goods such as economic growth. In this case, ambitious officials face incentives to signal their loyalty to factional patrons, instead of performing tasks for the regime (Shih Reference Shih2008b). However, even when confronted with intense elite struggle, authoritarian leaders may still prioritize tax collection capacity, to finance both private goods for regime supporters and the regime's repressive capacity (Acemoglu and Robinson Reference Acemoglu and Robinson2006; Bueno de Mesquita et al. Reference Bueno de Mesquita, Smith, Siverson and Morrow2003).
The main implication of the factional view of Chinese politics is the following factional hypothesis:
Hypothesis F1.Followers of the top leaders of the party, including the faction members of Mao Zedong, Deng Xiaoping, Zhao Ziyang, Hu Yaobang, Jiang Zemin, and Hu Jintao, are ranked higher than other officials when their respective patrons are in power.
In testing this hypothesis, we consider only the followers of the de facto or de jure leaders of the party because as the most powerful leaders, they had the strongest incentive to avoid factional politics and to ensure high regime performance. Thus, if factional politics was not pervasive, we would not expect the highest officials in the regime to rank CC members according to factional considerations.
A related hypothesis concerns the children of senior officials, or “princelings,” who entered the CCP elite. Although their parents were never their direct superiors, other senior officials might expect to win some advantage from the families of princelings by promoting them. But helping princelings does not make sense in the context of a unified leadership, because princeling status per se does not help further regime goals. To the extent that CCP elites were divided and were tempted to draw on princeling resources, we expect the following.
Hypothesis F2.Children of senior officials should be ranked higher than other officials.
DATA
We test our hypotheses on data measuring elite ranks within the CCP. Our dependent variable is the rank ordering of officials in the upper echelon of the Chinese Communist Party, for the 12th through 16th Party Congresses (1982–2007), a difficult quantity to measure. This (still imperfect) metric of pecking order improves on existing measures, which limit analysis to provincial officials. In this section we outline what we do know about these ranks; in the next, we explain how to use ranks we know well to infer ranks we observe imprecisely, a useful strategy for exploring the distribution of political power in authoritarian regimes.
The ranking of CCP elites in the CC took place roughly once every five years at the National Party Congress. Formally, this ranking comprised three different processes, but fundamentally, all three steps reflect a single ranking highly coordinated by the PSC. Starting at the 12th Party Congress in 1982, delegates received ballots with more names than there were seats in the Central Committee. Delegates then voted for the candidates by placing checks next to their names, and delegates could check as many names as there were seats in the Central Committee. Candidates were accepted into the CC in the order of their vote totals, with the lowest-vote receipients eliminated (Organizational Division of the Central Organization Department 2001). Alternate members of the CC were also elected in this way. The elected CC then voted the Politburo, the PSC, and the party secretary general into office. In this final round of voting, there were as many candidates as there were seats, and CC members without exception voted everyone on the ballot into offce.
Although congressional delegates ostensibly voted freely, all the party congresses were tightly monitored and controlled by the party secretary general and members of the Politburo. To begin, the chairman or the party secretary general sent early signals to the rest of the political elite on who should or should not be on the list of CC candidates (Li Reference Li2007). As the congresses approached, candidates for the CC, the ACC, and the Politburo were chosen by leadership groups, which included the serving PSC and a few powerful retired cadres handpicked by the party secretary general (Organizational Division of the Central Organization Department 2001).
The selected candidates then underwent a vetting procedure carried out by the Central Organization Department, which also took instructions from the party secretary general and other members of the Politburo (Cui Reference Cui2003; Nathan and Gilley Reference Nathan and Gilley2002). When the delegates finally arrived in Beijing to vote, they were isolated from each other and received strict voting instructions from the party secretary general and other members of the Politburo on how to vote (Deng Reference Deng2005; Li Reference Li2007). In the famous case of Deng Liqun's surprising elimination from the 13th CC, it turns out that the party secretary general at the time, Zhao Ziyang, sent cadres to the provinces prior to the congress to instruct delegates not to vote for him (Deng Reference Deng2005).
Because of extensive intervention from PSC members, where one landed on the party pecking order largely reflected the priorities of the top leadership, which could change dramatically over time. Periodic appearance of “helicopters,” or officials who obtained rapid promotion from the ACC to the Politburo, further suggests that elite ranking at the Party Congress was a single exercise of elite reshuffling closely guided by the party secretary general and the Politburo, rather than three autonomous processes. At the end of a congress, highly ranked officials typically enjoyed much more formal and informal power for the subsequent five years, whereas those who were not selected even as ACC members missed being in the power center of the CCP (Kung and Chen Reference Kung and Chen2011).
We note that there is broad agreement on a set of tiers, with the PSC and the Politburo at the top, followed by the full members of the CC, and then the alternate members of the CC (Kung and Chen Reference Kung and Chen2011; Lieberthal Reference Lieberthal2004). In particular, we treat as top-ranked the party secretary general (who sets the agenda in the PSC) and the chairman of the Central Military Commission (CMC), who were usually the same person. Next came the members of the PSC, who voted on every major issue confronting the regime—and whose relative political status was implied by the order of their names in public announcements.Footnote 2 Following in descending order of political power are the vice chairmen and members of the CMC (who controlled large segments of the armed forces), the Politburo (composed of regional party secretaries of major provinces, several vice premiers of the State Council, and senior military leaders), and a handful of alternate members of the Politburo. Next come the vast majority of the Central Committee who were not members of the higher party organs, whose members’ individual ranks were not precisely known, beyond the general importance of these tiers.
Finally, a key to our ranking strategy lies at the bottom of this hierarchy. Beneath full members of the CC lie the ACC members, who failed to win election to higher tiers at the party congress; for example, ACC members tended to be provincial governors rather than the more powerful regional party secretaries. Starting with the Eighth Party Congress, the official press announced ACC members in the order of votes received from delegates (the vote totals themselves remained secret). Because detailed instructions were given to delegates when they voted on the ACC slate, the votes received by ACC members should reflect the priorities of the top leadership in ranking cadres. This underexploited data on a large body of individuals contains a wealth of information about the factors influencing the ranking of all top officials. We will show in the next section how these data help us impute ranks for the entire hierarchy.
We combine our rank data with covariates measuring the characteristics of the members of the ACC, the CC, the Politburo, and the PSC. Most of these variables are drawn from a new biographical data set of Central Committee members developed by Shih, Shan, and Liu (Reference Shih, Shan and Liu2008). This database contains all CC and ACC members from the first party congress in 1921 to the sixteenth party congress in 2002, and follows the structure for political biographical data developed by Adolph (n.d.) in his work on the career trajectories of central bankers. Shih, Shan, and Liu collect and record nearly every state, party, and military position held by CC members throughout their careers, rather than just positions held by CC members at the time they served in the CC. Using start and end years for each position held, they reconstruct complete career histories for each member of the ACC, the CC, the Politburo, and the PSC as they stood at the start of each party congress.Footnote 3 They also collect demographic variables including birth year, gender, year of induction into the party, education, ethnicity, and princeling status.
These biographical data allow us to test whether education, performance, or factional affiliations are responsible for party rank. Basic demographic information captures merit criteria such as level of education, as well as representation criteria such as gender and minority status. We assume that factional ties occur between officials and leaders with shared birthplaces, as well as officials and leaders who overlapped in educational institutions or work units (Lieberthal and Oksenberg Reference Lieberthal and Oksenberg1988, 156).Footnote 4 If any such coincidence occur between a CC or ACC member and a top leader, we code that member as having a factional tie to that leader.
We also combine the CC database with provincial economic data to calculate the relative economic performance of provincial administrators (governors and party secretaries) who were also CC or ACC members (China Data Online 2005). In the five party congresses under consideration, provincial administrators made up between 14 and 20% of all CC members. We consider the fraction of provincial CC members to be both large from a substantive point of view, and sufficient to estimate whether provincial economic performance was rewarded with party advancement. Although we are only able to test the economic performance hypothesis on the provincial administrators in the pool, Maskin, Qian, and Xu (Reference Maskin, Qian and Xu2000) argue that China's success hinged on competition among provincial administrators, whose economic performance could be more readily observed than that of cadres in the central bureaucracy. If superior performance by provincial administrators did not lead to political rewards in the party, we doubt that nonprovincial officials received such rewards either.
We focus mainly on growth in GDP and fiscal revenue, but collect 22 other measures of performance for use in robustness analyses. We assume that each member of the CC hierarchy who was also a provincial party secretary or governor is judged based on the performance of his province in the five years between party congresses. In constructing our performance measures, we must solve two further problems. First, because competition for party rank is zero-sum, only officials who outperform their peers should advance. Thus we create relative performance scores that subtract rest-of-China performance from each province's growth rate. Second, provincial officials should not receive credit for growth trends determined before they took office. Thus, we subtract preappointment expected performance from each province's growth rate. The resulting variable measures the performance improvement in each province under its current leadership, relative to other provincial leaders. We create performance scores of this type for GDP growth, fiscal revenue growth, and other indicators of provincial performance. For example, the province of an official with a GDP growth score of +2 beat preappointment growth expectations by two percent more than the average province in China. Members of the ACC or CC who were not regional administrators in the five years prior to a party congress receive neutral performance scores of zero.Footnote 5
Estimating expected provincial performance is also the key to dealing with selection bias. Although high-flying officials might manuever themselves into provinces with strong growth prospects, or be sent to turn problem provinces around, we can purge these and other selection effects from our performance measures if we accurately model expectations of provincial performance on the eve of appointment. Party leaders doling out performance rewards share our problem of isolating the innovations in growth due to provincial leaders, rather than provincial trends or China-wide shocks. Because we cannot be certain how historical leaders solved this problem, we propose three strategies, and check whether any of them provide evidence of yardstick competition. The first strategy is the simplest: We subtract the growth rate in the preappointment year from growth during an official's tenure, attributing the change to the official's efforts. We use this performance measure in our baseline models. As an alternative, we employ standard time series methods to forecast growth over officials’ tenures using only preappointment data. We create forecasts using both the workhorse AR(1) model and the AIC-minimizing ARMA(p, q) model. We use these sharper estimates of expected growth in robustness checks that allow both sophisticated judgment of performance by party leaders and complex patterns of strategic appointment of provincial officials.Footnote 6 See the supplemental Online Appendix (available at http://www.journals.cambridge.org/psr2012004) for further details.
METHODS
Modeling the ranking of members of the CCP Central Committee—or any other partially observed ranking of political actors, whether the members of a legislature, a bureaucracy, or some other organization—challenges political scientists’ inferential toolkit. Despite the omnipresence of hierarchy in politics, these problem have not yet been noted or solved.
Rank Data Problems
Political rank data pose three problems for quantitative-analysis-as-usual: Rank data are interdependent, require context to interpret, and are typically incomplete.
Interdependence. Virtually all regression models in political science assume that observations are identically and independently distributed (iid). Rank observations are intrinsically interdependent: Only one member can rank first, only one can rank second, and so on. Direct inference on ranks using conventional methods will thus be invalid, giving incorrect standard errors.
Context. In general, observed and counterfactual ranks are meaningful only in context. Without context, the “first-ranked swimmer” could mean anything; the “first-ranked swimmer in the Olympics” and the “first-ranked swimmer in my neighborhood” usually represent very different levels of ability. Context matters even when we know the underlying strength of individuals giving rise to their ranking: The ranking boost provided by an increase in latent strength depends on the competition posed by higher-ranked individuals.
Contextual ranks complicate interpretation of estimated regression relationships. Frequentist inference (e.g., the use of t-tests and p-values to reject null hypotheses) assumes that estimated relationships are representative of a broader pattern that could be replicated in other random samples. The collection of these imagined datasets forms a “superpopulation” from which we construct confidence intervals and significance tests. Rank data constrain us to a finite population perspective: What we learn about the impact of a covariate on rank in one year's congress tells us little about its effect on rank within a different set of members in another year (Gelman et al. Reference Gelman, Carlin, Stern and Rubin2003).
Although conventional hypothesis testing makes little sense for a rank data model, Bayesian confidence intervals are still valid, as they do not depend on the existence of any data beyond the sample analyzed. Moreover, the confidence intervals we obtain for our results are the best we will ever get—because there will never again be another 14th Party Congress, there is no possibility of finding “more data” to produce more precise estimates of its hierachical structure.
Incomplete Ranks—Ties and Tiers. An ideal rank dataset records a unique rank for each member, but such detailed ranks are seldom available. Rank data may be incomplete, or partially observed, in two ways. First, there may be “ties,” defined as cases where the rankers’ measurements could not distinguish the (presumably different) latent strength of two or more consecutively-ranked individuals. In an ordered list of ranked objects that omits numerical ranks, such ties may hide anywhere in the dataset, leading to measurment error if rank is treated as identical to order. Our method of constructing ACC ranks is vulnerable to ties, and these potential ties must be accounted in our model.
A broader version of this problem arises when the ranks for a large “tier” of individuals are known to political actors, but concealed from the analyst. Figure 1 illustrates the relationship between tiers and ranks using a hypothetical dataset of eight individuals. Although the ranks of the three highest and two lowest members are known exactly, the fourth through sixth ranks form a tier within which individuals’ relative ranks are unknown. Discarding these cases altogether, however, would waste valuable information, because the upper and lower bounds of the tier tell us that these middle individuals rank below 1, 2, and 3 and above 7 and 8. Although we can only specify the exact rank of five out of eight observations, we can correctly identify the higher-ranking individual in 25 of the 28 possible pairwise comparisons. The best analytic strategies for rank data will find ways to include this relative rank information.
Observed Ranks, Missing Ranks, and Tiers

The observed ranks of members of the ACC, CC, Politburo, and PSC show essentially the same pattern as the smaller dataset shown in Figure 1. We know the ranks of ACC members and PSC members, but all we can say about the CC is that their ranks lie somewhere in the middle. Surprisingly, this simple observation about CC members unlocks essential information for inferring the relationship between the characteristics of party members and their political power, but we will not be able to examine this hidden trove of data using off-the-shelf quantitative methods.
Flawed Analytic Strategies
Three seemingly appropriate methods from the political science toolkit—linear regression, censored regression, and ordered probit—either assume properties that rank data clearly violate or ignore useful information contained in the ranks. Even though ranks take on unique and interdependent integer values, least-squares regression inappropriately assumes that ranks are iid Normal, computes incorrect standard errors, and predicts impossible ranks. Because linear regression requires us to listwise delete any observations with imprecisely observed ranks, we also lose information captured by the bounds on those ranks, which is statistically inefficient and a possible source of bias (King et al. Reference King, Honaker, Joseph and Scheve2001).
Censored regression (or tobit) models a Normally distributed outcome that is observed when it falls in certain ranges, but censored elsewhere (Schnedler Reference Schnedler2005). This avoids bias and inefficiency from deleting partially observed cases, but because censored regression also assumes ranks are iid Normal, its standard errors are still biased. And neither censored nor linear regression protects against measurement error from miscoding tied ranks.
If we abandoned our analysis of the rank-level data, we might focus on estimating the probability of an individual appearing in a given tier using ordered probit. Ordered probit does not assume ranks are Normal, and mitigates (but does not eliminate) the dependence of observations. But it exacts a large cost for these improvements, throwing out even more of the observed data than linear regression, and adding a new parameter to estimate for each uniquely identified tier, so that estimation becomes harder the more we know. To analyze partial ranks without violating model assumptions or discarding data, we look beyond the usual suspects, and develop statistical models calibrated to the unusual properties of rank data.
A Bayesian Model of Partially Observed Ranks
To understand the relative power of Chinese Communist officials, we propose and apply a Bayesian model of partially observed ranks with three advantages over conventional methods. First, we allow interdependence of ranks through the rank likelihood (Hoff Reference Hoff2008). Second, we generalize this approach to allow for partial observation of ranks, preserving all the information available in our data—a step we expect will be critical for most applications of the method to political data. Finally, we interpret our results in the context of each rank dataset: Rather than assume there is a “superpopulation” from which each party congress is a random sample, Bayesian methods let us treat each party congress as sui generis, thus quantifying the magnitude and uncertainty of effects of covariates on ranks in historical context.
We denote the rank of each individual i ∈ 1, . . ., n as a unique integer yi ∈ 1, . . ., n. Lower values of yi represent higher ranks; i.e., y = 1 indicates the highest-ranked individual, and y = N the lowest. Each individual lies within a tier, or range of ranks, which is known even if yi is missing. Our model of yi rests on three assumptions:
Assumption 1.Each ranked member has a unique latent strength y*i.
Assumption 2.Higher latent strength entails better expected rank:  .
Assumption 3.Latent strengths are iid Normal.
To examine the relationship between ranks and observable covariates, we parameterize the latent strength y*i using a linear model, which for identification has no constant and unit variance:

For convenience, we refer to the random component of latent strength as αi = y*i − μi; we interpret αi as representing the unmeasured political talent and good or bad fortune of official i.
The model relies on the notion that if we could only observe latent strength directly, a simple linear regression would be sufficient to understand its conditional expectation. We link partially observed ranks to latent strengths through a set of bounds around each rank, denoted {y loweri, y upperi}. For a given observation, there are three possible kinds of bounds. From most to least informative, these are
Bound Type 1.Rank known exactly: y loweri = yi = y upperi.
Bound Type 2.Rank known up to a potential tie with an adjacent ranked individual: y loweri = y upperi + d, where d + 1 indicates the number of ranks included in the tie.
Setting d = 1 discounts the observed difference in rank between any two immediately adjacent ranked individuals as potential measurement error, but assumes that two individuals separated by two ranks or more must have correspondingly ordered latent strengths.
Bound Type 3.Rank known up to a tier: y loweri < yi < y upperi, where y loweriis set to the lower bound of the tier, and y upperiis set to the upper bounds of the tier.
In our application, we treat the ranks of (most) members of the PSC as known exactly (Type 1), members of the CC as known only within the tier bounds of the CC (Type 3), and members of the ACC as known up to a potential tie, as a check on the possibility that two adjacently ranked members of the ACC actually won the same number of votes (Type 2).Footnote 7
With bounds in hand for each ranked individual, we form a rank likelihood model around Assumptions 1, 2, and 3. Rank likelihoods capture the probability, conditional on covariates, that a given individual falls between the next higher and next lower ranked observations, and make no distributional assumptions about the ranks themselves (Hoff Reference Hoff2008; Pettitt Reference Pettitt1982). Rank likelihood models do not require an independence assumption, accept even partially observed ranks, and require sophisticated Markov chain Monte Carlo (MCMC) methods to estimate. Full details regarding model parameterization, priors, and estimation procedures can be found in the Appendix.
Estimating and Fitting the Model
We estimated the model on the members of each party congress separately, without any pooling of parameter values across years, to allow the nature of political competition in each Party Congress to vary freely.Footnote 8 Each model controls for contemporaneous faction affilliations, relative changes in economic and revenue performance, educational attainment, gender, minority status, age, and party tenure. We report the goodness of fit for our baseline specifications in Table 1.Footnote 9 First, we compute the percentage of variance in latent political strength explained by the measured covariates (analogous to R 2 in linear regression). Second, we present the average error in percentiles when the fully observed ranks are predicted using only the measured covariates. Third, we calculate the percentage of all individuals classified in the correct tier based on their observed characteristics. Finally, we report the Bayesian information criterion (BIC) for each model (Spiegelhalter et al. Reference Spiegelhalter, Best, Carlin and van der Linde2002). As the BIC weighs the explanatory benefit of additional covariates against the cost of added model complexity, it serves as our preferred tie-breaker among substantively similar models, and it supported the set of controls employed here. Even though a majority of ranks were observed only partially in each party congress, the models fit well, explaining at least one-third and as much as one-half of the variance in latent strength, correctly predicting tiers for at least two-thirds of officials, and predicting members with exactly known ranks with as little as 25% error. Nevertheless, there remains a substantial chunk of variance left over, suggesting significant opportunities for further research.
Goodness of Fit

Interpretation of Results
As usual for a regression model, substantive interest centers on calculating conditional expectations and first differences for carefully chosen counterfactual values of the model covariates. Because the rank benefit of any covariate depends not only on a given individual's characteristics, but also on the competition, we must also supply the hypothetical rivals for our hypothetical ranked individual. Usually, it makes sense to insert our hypothetical individual into a historical ranked body. As an example of a properly formed conditional expectation, we might ask what rank to expect for an otherwise average official with a college degree in the 15th Party Congress. A proper first difference, on the other hand, would ask how many percentiles in rank an average official would gain in the 15th Party Congress by earning a college degree. The Appendix gives further details on calculating these quantities.
FINDINGS
Overall, our findings do not suggest any linkage between growth performance of regional administrators who were also ACC, CC, or Politburo members and their party ranking in the CCP. However, some regime-strengthening factors, such as education and, to a lesser extent, fiscal performance and minority status, had positive impacts on ranking in the party elite. At the same time, there is considerable evidence that factional affiliation played a large role in political advancement.
Because the raw parameters estimated in our models are on a latent scale of no direct interest, and because we estimate five separate models, each with numerous covariates, it is easiest to explore our results through graphical summaries. These graphics show either the expected ranks of members with differing characteristics (for the 16th Party Congress see Figure 2; for other years, see the supplemental Online Appendix), or the expected change in rank associated with a change in one covariate, all else equal (Figures 3 and 4). To guide readers through our results, we first explore how different factors affected expected elite ranking at the most recent party congress for which we had data, the 16th Party Congress (2002). Then we take a broader view, and examine how the impact of these factors has waxed or waned between the 12th Party Congress and the 16th. Finally, we consider a broad range of alternative specifications to confirm the robustness of our findings.
Formal Selection Criteria and Rank in the 16th Party Congress: Estimated Relationships

The Effects of Factional Ties, Performance, Demography, and Education on Political Rank: Estimated First Differences over Time

The Interactive Effect of Age and Party Tenure on Rank by Party Congress: Estimated First Differences

Getting Ahead at the 16th Party Congress (2002–07)
Figure 2 lists the correlates of CCP rank in the 16th Party Congress in order from the biggest hinderances to the greatest advantages. The dotted vertical line marks the expected rank of a member with average values of all covariates. Black circles show the expected rank of members with the characteristics listed at left. The thin horizontal lines give 95 percent Bayesian confidence intervals; the thicker horizontal lines are single standard error bars. Also plotted to the left and right of the main estimates are gray diamonds showing the expected rank of members with the given characteristics and a random effect (or unmeasured political ability) one standard deviation below or above the mean, respectively. Thus the right gray diamond shows the rank we expect for a particularly talented or fortunate politician who has a high value of the listed covariate and otherwise average observed characteristics. These gray diamonds show the magnitude of the unmeasured effects not captured by the model, and also reveal how our modeled covariates provide a crucial boost or barrier for even extremely powerful elites—note, for example, the plight of skilled or lucky politicians who lack an education (banished to the ACC), or extremely talented or fortunate observationally average older members (potential Politburo material).
So how do our hypotheses fare in the 16th Party Congress? We start with our meritocratic regime hypotheses, which held that education, growth, revenue performance, and experience should be favored, along with broad representation of women and ethnic minorities. On face, education had a strong effect, as college graduates and graduate degree holders outranked high school graduates and dropouts by as much as 25 percentiles in party rank. Of course, by the 16th Party Congress, education was such a necessary condition for advancement that only 2% of members lacked a college degree. Despite a scramble to obtain graduate degrees among Chinese officials, having a graduate degree did not provide any additional advantage for an official's ranking at the 16th Party Congress.
Contra Maskin, Qian, and Xu (Reference Maskin, Qian and Xu2000), Li, and Zhou (Reference Li and Zhou2005), and Chen, Li and Zhou (Reference Chen, Li and Zhou2005), we find little effect of growth performance on the prospects of local administrators who were ACC or CC members. At the 16th Party Congress, and controlling for revenue growth and political connections, relative provincial GDP growth provided no advantage to the expected ranking of an official. In this same party congress, collecting more taxes relative to the other provinces provided only a tiny, statistically uncertain boost to one's ranking [95% CI: −6.6, 11.5].
We find contrasting results for women and ethnic minorities. At the 16th Party Congress, a woman with otherwise average characteristics was expected to rank over 15 percentile points [95% CI: −1.3, −29.8] below a similar man. Even an exceptionally talented or fortunate woman with a high random effect was expected to rank more than a decile behind a similarly exceptional male official. Not surprisingly, in the 16th Party Congress only 4 of over 100 full CC members were women. Minorities, in contrast, appear to suffer no disadvantage, and may even have seen a slight benefit (3.9 percentiles) from a deliberate policy of promotion, though this effect was far from precisely estimated [95% CI: −9.8, 17.3]. A skilled or lucky minority official with a high random effect could reasonably expect to rise nearly to the 90th percentile, as did Hui Liangyu, an ethnic Hui in the Politburo.
Finally, years of experience in the CCP seemed to give elites an advantage in obtaining a higher rank. Here, we distinguish the effect of experience within the party from that of age itself. The model's estimates for the effect of age are ambiguous: No other variable had such a large average effect, but neither did any other variable have so imprecisely estimated an effect (indeed, no matter which specification we chose, the confidence interval for age remained stubbornly wide). First, age exerted the greatest positive impact on the expected rank of an official at the 16th Party Congress. Even controlling for age, however, we find that experience, measured as the share of an official's adult life spent in the party, also exerted a positive effect on one's ranking, albeit also with a wide confidence interval.
Did elite conflict and factionalism play a role in influencing elite ranking? For the 16th Party Congress, we examine the effect of being in the same faction as departing Party Secretary Jiang Zemin, incoming Party Secretary Hu Jintao, and deceased veteran Deng Xiaoping. Even in 2002, five years after Deng's passing, members of Deng's faction—some 12% of the CC and ACC who still had historical ties with Deng—had average ranks 14 percentile points higher [95% CI: 2.5, 25.8] than the average member, whereas members of Hu Jintao's Communist Youth League faction were expected to rank about seven percentiles above the average member [95% CI: −2.3, 17.7]. Surprisingly, CC and ACC members with ties to Jiang Zemin ranked the same as the average member, a pattern held over from the 14th and 15th Party Congresses. This puzzle can be explained, in part, by Jiang's vigorous promotion of close allies and supporters possessing little administrative experience or personal political resources. Even with Jiang's assistance, the best these individuals could do was to rank at the bottom among ACC members.Footnote 10 Finally, holding their educational advantages constant, princelings at the 16th Party Congress differed little from other Central Committee members [+2.2 rank percentiles; 95%: −16.9, 23.0]. All else being equal, the princeling advantage was not apparent at the 16th Party Congress.
In examining ranking at the 16th Party Congress, we find that economic performance did not matter. Obtaining a college education had become an unambiguous prerequisite for membership in the CC elite by 2002. Accumulating more experience in the CCP likewise may have provided officials with a boost in their ranking. However, performance-based criteria such as tax collection exerted only modestly positive effects on one's ranking. Departing from the expectations of a broadly representative regime, women faced distinct disadvantages in seeking high rank, although minorities enjoyed a slight advantage. Meanwhile, factional affiliation with Hu Jintao and Deng Xiaoping allowed connected officials who were average in other respects to rank significantly higher than their peers. In this core indicator, factional considerations continued to matter in 2002.
Getting Ahead in the Reform Era: Changes over Time
To understand how the struggle for power in the CCP has evolved over the reform period, we review our results for the 12th through 16th Party Congresses, covariate by covariate. We take up the results in three parts, first examining the performance and merit hypotheses, then focusing on how factional or princeling ties emerged as determinants of political rank, and concluding with a closer look at the interaction effects of age and party experience.
We start, in Figure 3, with the effects of education. These plots reveal that even at the beginning of the reform era, a college or graduate degree boosted party rank. At the 13th Party Congress in 1987, education continued to exert a positive effect on ranking. However, educational level beyond high school did not affect ranking at the 1992 14th Party Congress. In the aftermath of the 1989 Tiananmen Square Massacre, the party was preoccupied with punishing those who had failed to take a hard line and rewarding those who had helped the party survive the crisis. Over half of the CC was replaced at the 14th Party Congress (Gilley Reference Gilley1998). The benefits of education grew dramatically after 1992. By 2002, college was an unambiguous prerequisite for entry into the top of the elite, setting off a scramble for degrees that appears to have reached a point of diminishing returns, as graduate education produced no added advantage beyond a college degree at the 15th and 16th Party Congresses. All one can say is that the education advantage became more certain when one obtained a graduate degree relative to an official who only completed college, as shown by the narrower confidence interval for graduate degree holders in recent years.
Members of ethnic minorities held a steady but slight and imprecisely estimated advantage throughout the reform period, perhaps because of the party's “united front” policies, which sought to maintain stability and legitimacy through minority representation in the CCP elite (Mackerras Reference Mackerras2003, 21). Women faced no disadvantage versus men at the 12th Party Congress in 1982, but were systematically lower-ranked for most of the remaining party congresses. What explains the relatively fair treatment of women at the 12th Party Congress and its subsequent decline? Perhaps female Long March veterans, still politically active at the 12th Party Congress, worked to promote women in the ACC and CC. In 1982 Deng Yinchao (Zhou Enlai's wife), Deng Jinliu, Cai Chang, Li Zheng, and Kang Keqing all exerted considerable influence on CC ranks, either through the Central Advisory Commission or from behind the scenes. By the late 1980s and early 1990s, these veterans had retired from active politics, leaving few senior women officials to lobby for the promotion of new female cadres. In the 1990s, only a small handful of “strong women” emerged in the political scene, such as Chen Muhua and Wu Yi, but they were the exceptions to an increasingly male-dominated elite body. This trend suggests that fairness and representation considerations were low priorities in the ranking of high-level officials in the CCP.
Turning to performance measures, we find growth performance exerted a decisively negative influence on CC ranking from the beginning of the reform period until the 15th Party Congress in 1997. From 1982 to 1992, provincial officials with above average growth performance could expect to be ranked 3 to 10 percentiles lower than average performers. From 1997 onwards, officials from high-growth regions enjoyed neither an advantage nor a disadvantage vis-à-vis officials from average-growth regions. Relying on more detailed, party-based ranks, which do not treat lateral bureaucratic rotations as promotion, we thus cast doubt on the notion that regional growth was propelled by the prospect of promotion (Blanchard and Schleifer Reference Blanchard and Schleifer2000), and on the findings of Li and Zhou (Reference Li and Zhou2005), Maskin, Qian, and Xu (Reference Maskin, Qian and Xu2000), and Chen, Li, and Zhou (Reference Chen, Li and Zhou2005).
Indeed, the historical record suggests that party secretaries of provinces deemed politically important were automatically inducted into the Politburo, regardless of the province's economic performance. For example, at the 16th Party Congress, party secretaries from economic dynamos such as Guangdong and Shanghai won seats in the Politburo, but party secretaries of mediocre growth performers such as Hubei and Tianjin also gained entry into the body. At the same time, the serving party secretaries of Zhejiang and Jiangsu, which typically had high growth, were never inducted into the Politburo. Our findings also lend support to Huang (Reference Huang1996), who finds that highly ranked regional leaders had an incentive to stifle growth through reducing investment because they did not want to violate the center's macroeconomic control measures.
The picture for fiscal performance is more nuanced. In contrast to economic performance, which benefits society as a whole, tax collection delivers funds directly to Beijing, helping political leaders fulfill various objectives. In 1994, Beijing centralized China's fiscal system, and we see some benefit in rank from exceptional revenue collection over the period 1992–97 during the 15th Party Congress in 1997. As Beijing struggled to ensure that local officials complied with the new fiscal system (Chen Reference Chen2005), these new incentives were unsurprising. The need to reward local officials for tax collection seemed to have diminished somewhat by the 16th Party Congress in 2002.
Our findings on the effect of factional ties and princeling relationships throughout the reform period suggest that top Chinese leaders consistently sought to promote faction members already in the political elite to higher ranks. Although members of Chairman Mao's residual faction at first were not discriminated against in elite ranking, by the 13th Party Congress, after the demotion of Mao's designated successor Hua Guofeng, Maoists saw their standing fall by an average of 11.5 percentiles compared with non-Maoists, though the effect is very poorly estimated [95% CI: −39.0, 17.0]. Many Maoists were forced out of the CC and ACC in the 13th Party Congress, and their representation in the CC and ACC declined from 16% to 6% (see the Appendix).
ACC and CC members with historical ties to Deng Xiaoping enjoyed positive and substantial rank advantages through most of the reform period, even through the 15th Party Congress, immediately following Deng's death. This effect holds even controlling for a potential confounder, Deng's command of the Second Field Army during the Chinese Civil War (1945–1949), which produced many senior officials. Even when we partial out Deng allies from the Second Field Army, his other followers did well at the 12th and 13th Party Congress.
The two party secretaries of the 1980s, Hu Yaobang and Zhao Ziyang, exerted different effects on the ranks of faction followers. Hu Yaobang followers made up some 41% of the 12th Party Congress, which may explain why being a Hu follower did not produce extra rank advantages in 1982. At the 13th Party Congress in 1987, some of Hu's followers were forced to step down (like Hu before them), reducing the faction to 25% of the CC and ACC. The survivors enjoyed a 20% rank advantage over non-Hu Yaobang followers, perhaps as a result of a selection effect: With the weakest Hu followers weeded out, the stronger survivors may have been better suited to retain their rank.
In contrast, although Zhao followers made up roughly one-fourth of the CC and ACC body at both the 13th and 14th Party Congresses, they held no particular rank advantage in either. Jiang followers, who made up 17% and 20% of the CC and ACC at the 15th PC and 16th Party Congresses, are similarly neutrally ranked. This appears to contradict tales of Jiang forcefully filling the PSC and Central Committee with his own followers (Lam Reference Lam1994, Reference Lam1999; Zhang Reference Zhang2002). But just as Jiang tried to promote many of his key followers, including Huang Ju, Zeng Qinghong, and Jia Qinglin, into key positions in the Politburo Standing Committee, he also tried to appoint members of his household staff with little administrative experience into alternate central committee seats. These Jiang supporters were consistently among the lowest vote recipients on the ACC list. Indeed, we see Jiang's faction clustered into two types—one at the top of the elite rank hierarchy and one at the bottom. The net effect of a Jiang factional tie as zero is thus somewhat misleading. Without Jiang's help, many in his inner circle would not have been qualified to even enter the bottom of the Communist elite, so his influence arguably raised the rank of both clusters.
Factionalism persists in recent Chinese politics. We find that members of Hu Jintao's Communist Youth League (CYL) faction enjoyed a distinct rank advantage of 7 to 10 percentiles at both the 15th and 16th Party Congresses, all else equal. To be sure, Youth League members were cultivated in the 1980s to take high offices in the 1990s, and many of them indeed entered the elite CC/ACC bodies in the late 1990s. However, once they entered the ACC, ties with Hu Jintao, who had served as the party secretary of the Communist Youth League, pulled them further upward into the CC and higher.Footnote 11
Finally, children of senior officials, or “princelings,” held substantial rank advantages at the 13th and 14th Party Congress, all else equal, though the effect has declined since the 15th PC. Although in many cases the parents of these princelings have retired or died, political leaders in China still found it useful to promote these princelings over the average member. The princeling advantage stood out particularly in the 13th and 14th Congress, when Deng Pufang, Yu Zhengsheng, Li Peng, and Xi Jinping were propelled into the upper reaches of the CC or even into the Politburo over revolutionary veterans despite being notably young. From the late 1990s on, however, relatively young Communist Youth Leaguers were also getting promoted into the higher ranks, and the princeling advantage no longer seemed as strong. Nevertheless, future study of the 17th Party Congress may well find a revival of the princeling advantage, as the cohort of princelings who had entered high politics in the late 1980s and early 1990s reached the apex of the CCP.
We turn now to the important but complex interaction of each official's age and party tenure, which we control for using both a simple measure of the years an official spent in the CCP as a fraction of his total years lived, as well as dummy variables for specific revolution cohorts.Footnote 12 In each of our models, age—not party tenure—is the more potent determinant of rank. However, even though our estimates partial out the effects of age and tenure, in real data these concepts can never be fully separated (e.g., in 2002, there were no 40-year-olds who joined the CCP in the 1930s). To show how age and tenure reinforce one another, we calculate from the model posterior the expected rank for a range of observed combinations of age and date of party entry; we plot the results by party congress in Figure 4. The graphs trace out “cohort lines” showing the effect of age on rank for officials who joined the party in the same year; for each party congress, we plot a cohort line for members at the 25th, 50th, and 75th percentiles of party tenure. The upward slope of the lines reflects the strong, positive association between age and political rank and the degree of spread between the lines shows the effect of party experience.
Two main findings emerge from Figure 4. First, the rank benefits of age are strong—indeed, stronger than any other measured covariate—and have grown stronger in recent party congresses. To guard against selection bias (as only unusually powerful officials can maintain their positions in the CC past the mandatory retirement age of 65), we reran each model with a control for the retirement threshold, and the overall age effect persisted strongly. We conclude, then, that age mostly reflects the accumulation of political capital over time.
Second, the rank benefits of party tenure and revolutionary experience loom large in early reform party congresses, but diminished greatly over time. At the 12th Party Congress, CC members from the Long March cohort on average placed above the 60th percentile, much higher than the expected ranking of the later Anti-Japanese War and Civil War cohorts. Unique efforts in the 12th Party Congress to promote young officials meant that some members of the post-1950 cohort ranked higher than revolutionary veterans and even some Long Marchers. In all other party Congresses, greater party seniority brought about higher ranks. At the 13th and 14th Party Congresses, revolutionary veterans on average ranked around the 60th percentile, whereas at the 15th Party Congress, revolutionary veterans ranked around the 75th percentile, but by 2002, all revolutionaries had retired from the CC, and party experience diminished as a determinant of rank.
The overall impression of Figure 4 is that the significance of age has risen whereas the impact of years in the party has faded. Nevertheless, their large combined effect suggests an “up-or-out” system for the CCP elite, as officials who endured years of intraparty political struggle were very likely to accumulate the political experience and capital needed to advance through the party ranks.
Robustness of Results
We find no relationship between growth performance and party ranking, and a strong relationship between factional ties and rank. Because these findings are debated both for China and for the broader field of authoritarian politics, we conduct additional robustness tests to raise our confidence in the results. In particular, we drop the assumption that the order of votes received for the ACC measures political strength, consider more specific measures of factional affiliation to protect against measurement error, add controls for educational institutions and fields of study, add broader measures of economic performance in case political ranks are awarded holistically, and finally, exploit our provincial performance data to mitigate selection bias. Because the details of these tests could fill a second article, we relegate discussion of theory, measurement, design, and ancillary results to the supplemental Online Appendix. Here, we focus on the consistency of our estimated results for the impact of faction, performance, and education on expected party rank.
Figure 5 displays results for all robustness checks overlapped. The similarity of these results to each other and the baseline estimates is striking, and the few deviations worthy of note.
The Effects of Factional Ties, Performance, Demography, and Education on Political Rank: Robustness Checks
Note: As in Figure 3, each plot shows the estimated change in rank percentile for a member with otherwise average measured and unmeasured characteristics, but a higher value for the listed covariate. Estimates from nine different specifications join the original model. Shaded regions show 67% Bayesian confidence intervals for the original models. See the supplemental Online Appendix (available at http://www.journals.cambridge.org/psr2012004) for confidence intervals for other models.

Our first robustness check is the toughest, because it discards much potentially useful information. We now treat the ranks of ACC members as missing, and allow the rank data model to impute ACC ranks along with CC ranks and other parameters. Remarkably, there is enough information in the tier bounds on the ACC and CC to estimate our models, and for every party congress, the new, more conservative results agree remarkably well with the baseline models on the effects of factions, performance, and education (see the dotted lines in Figure 5). Our main conclusions no longer depend on whether ACC votes are informative, as they do not enter the model. The principal change in the results is that minorities and women both fare poorly, which we take as evidence of a glass ceiling. It is apparently easier for women and minorities to rise in the ACC ranks than it is for them to leave the ACC for higher tiers.
Our factional tie measures are also vulnerable to measurement error. Designed to be sensitive to affiliations hinted at by shared birthplaces, school ties, and shared work environments, our baseline measures may include false positives because of coincidences of birth and school attendance. A more specific measure counts only cases where an official worked closely with the faction leader in one of China's hundreds of ministerial and vice-ministerial work units or state-owned enterprises. Substituting these measures leaves most estimates of faction unchanged, and strengthens results for Mao and Deng, perhaps by zeroing in on core faction members or by excluding marginal members (see the dashed–dotted lines in Figure 5). As a further check against spurious factional results, we confirm that our factional measures also explain considerably more variance in rank than randomly generated factional variables do (see the supplemental Online Appendix for details).
As our remaining robustness checks all agree so closely with each other and with the original model as to be mostly indistinguishable, Figure 5 plots them all as dashed lines. The first such test allows for the possibility that not all college and graduate degrees are equal, and adds to the model controls for the origin of each official's highest university degree (whether from the Central Party School or abroad) and for fields of study (either natural science or social science/administration/law). The average effect of education is unchanged, as is the impact of faction and performance covariates, whereas the effects of degree origins and fields of study vary over time (see the supplemental Online Appendix).
We perform two tests of our findings on performance. In the first, we consider the possibility that GDP growth is too narrow a yardstick, and substitute a set of five orthogonal factors of performance summarizing 24 provincial performance variables. For this model, the quantity plotted under “GDP Growth” in Figure 5 is the effect on rank of the largest factor from our factor analysis, which loads heavily on growth in industrial output, retail sales, gross capital investment, and, of course, GDP itself. Even with this broader measure, we still find no evidence of incentives for growth. Nor do we see any correlation between higher party rank and improvement in the other factors: urban and rural standards of living, social service provision, and employment (see the supplemental Online Appendix for factor analysis details and full results).
In our final test, we return to the problem of selection bias. Our baseline measures of GDP growth provide some protection against selection effects by subtracting preappointment growth rates in each province. Still, better preappointment forecasts—such as AR(1) or ARMA(p, q) forecasts from historical data—should offer more protection against selection bias, and more closely capture the kind of performance most relevant for political rewards. In our remaining robustness checks, also shown as dashed lines in Figure 5, we isolate the surprising performance of provincial officials left over after removing expected growth, as forecast from preappointment data by either an AR(1) model or by the best available ARMA(p, q) model. We use the same forecasting techniques to isolate surprising performance on the five latent performance factors. Across all four of these robustness checks, the rewards to unexpected economic growth hover near zero, whereas the rank effects of factional ties, education, and demographics remain unchanged.
We consider the breadth and consistency of these results to be a strong refutation of the widespread claim that Chinese leaders advance based on yardstick competition. There is no hint that higher provincial growth leads to political advancement: not for officials who perform well compared to the past performance of their own province, not for officials who beat their peers’ performance in other provinces, not for officials who perform well on a broad range of factors, and not even for officials who beat the specific expectations one could form of their likely performance on appointment. Factional ties, on the other hand, appear to be strong predictors of party rank no matter what the specification of the model.
CONCLUSIONS
In this study, we use a novel Bayesian model of rank to estimate the impact of covariates on elite ranking within the ruling Chinese Communist Party. Guided by the literature on comparative authoritarianism, we derive hypotheses about covariates that may drive elite ranking in China. The empirical results show that the existing theoretical literature on authoritarian regimes predicts ideal types that, in reality, coexist in the same regime. Communist institutions in China worked well enough to make college education a prerequisite of entry into the upper echelon. The regime also systematically favored ethnic minorities, probably to enhance stability. Finally, when a centralized fiscal system was first implemented in the mid-1990s, the CCP used the cadre evaluation system to ensure that provincial leaders cooperated with central tax officials in maximizing revenue for the central government. Consistent with the predictions of Bueno de Mesquita et al. (Reference Bueno de Mesquita, Smith, Siverson and Morrow2003), the CCP regime deployed the cadre evaluation system to ensure basic state functions, stability, and fiscal income, all of which were necessary to deliver private goods to the ruling elite.
Chinese leaders, however, did not apply the cadre management system to encourage growth. To be sure, the system assigned scores to cadres’ growth performance, but we find no evidence that provincial officials who generated higher-than-average growth or higher than expected growth were rewarded with higher party ranks in any year and on any measure. Given our findings, one can no longer argue that China enjoyed spectacular growth because of promotion incentives embedded in the political system. To be sure, officials had some incentive to be educated, which increased human capital in the regime. After the beginning of the reform, provincial administrators certainly did not have an incentive to reduce growth in their jurisdictions and may even have seen growth performance as a way to earn promotion. However, there were other (formal and informal) paths upward that were more effective. In terms of formal performance criteria, raising revenue collection, at least in the 1990s, earned advancement. Chinese leaders also did not promote gender fairness at the elite level through the cadre management system, thus allowing systematic discrimination against women to persist.
CCP cadre management institutions also delivered promotions to followers of senior party leaders. First, ties with Deng Xiaoping, Hu Yaobang, or Hu Jintao while they were in power elevated officials in the party hierarchy. Even though these leaders were the nominal and de facto heads of the party, they still engaged in factional politics. In fact, the literature suggests that leaders were able to stay in power because they engaged in factional politics instead of selecting the most capable officials (Egorov and Sonin Reference Egorov and Sonin2011; MacFarquhar and Schoenhals Reference MacFarquhar and Schoenhals2006; Pye Reference Pye1992). Princelings also held distinct advantages in some party congresses, again suggesting that senior CCP leaders favored promoting members of their support coalitions.
China's growth in the past 30 years has been spectacular, but the precise source of this growth remains highly contested. The findings of this paper suggest that the CCP's cadre management system did not directly lead to China's growth. The findings, however, are consistent with the argument that crucial policies enacted in the 1980s, including the household responsibility system, labor mobility, price reform, and the welcoming of foreign direct investment, paved a strong foundation for three decades of growth (Huang Reference Huang2008; Naughton Reference Naughton1996; Sachs et al. Reference Sachs, Woo, Fischer and Hughes1994; Shirk Reference Shirk1993). Although Chinese leaders enacted them on an experimental basis, these early policies produced strong momentum for growth that lasted for decades. Furthermore, by encouraging cadres to deliver short-term benefits to the regime, party institutions delivered several crucial conditions for economic growth, including relatively low inflation, a well-financed central authority, and political stability (Huang Reference Huang1996; Shih Reference Shih2008a). Without these basic conditions, growth in China likely would have been much lower. The challenge for China going forward is to uncover institutional mechanisms that counteract the natural tendency of political institutions to deliver private goods in the form of rent-seeking opportunities to the support coalitions of senior leaders.
In future research, instead of static evaluation of regimes as “meritocratic” or “clientelistic,” scholars should focus on mechanisms that shift a regime's priorities toward public good provision, rather than delivering private goods to a small elite. Exogenous shocks, such as inter-state wars, worldwide depression, and exogenously driven inflation, may change the relative balance of power and degree of elite rivalry, which in turn may alter promotion incentives, and ultimately affect policy outcomes. Outside events may also shift the policy priority of top leaders, leading to adjustments in promotion criteria. For example, the collapse of the Soviet Union motivated China to centralize its fiscal system. Our findings suggest that when faced with the challenge of bolstering central fiscal resources, the leadership placed a heavier emphasis on tax collection when ranking officials at the 15th Party Congress. Following the research of Ramseyer and Rosenbluth (Reference Ramseyer and Rosenbluth1998) and Boix and Svolik (Reference Boix and Svolik2010), more work should inquire into the expected behavior of authoritarian regimes under different degrees and types of internal rivalry induced by external shocks.
APPENDIX
This Appendix provides details for the estimation and interpretation of the Bayesian model of partially observed rank data introduced in the main text.
Markov Chain Monte Carlo Rank Likelihood Estimation
Rank likelihood estimation is sometimes used to avoid the strong distributional assumptions used in maximum likelihood models, and is especially useful for inference in models where the response is only known up to a rank (Pettitt Reference Pettitt1982). Whereas the maximum likelihood estimate of β maximizes the probability of obtaining the observed response yi given its assumed probability distribution and the covariates, the rank likelihood estimate maximizes the probability that the observed response falls between the next higher and next lower ranked individuals, given the covariates, but without any assumption that yi follows a particular distribution (Hoff Reference Hoff2008). Rank likelihood allows us to directly include (even partial) rank information in the likelihood, but requires Markov chain Monte Carlo (MCMC) methods to estimate.
As usual with MCMC, our goal is to initiate a random walk through the parameter space which eventually converges to the correct posterior distribution, so that we can simply sample from the Markov chain to calculate estimates and confidence intervals of our quantities of interest (Gelman and Hill Reference Gelman and Hill2007). MCMC estimation of the Bayesian partial rank model proceeds using a combination of the Gibbs sampler and Metropolis–Hastings algorithms. We set diffuse Normal priors over the β parameters and then construct several Markov chains using the following four-step procedure, iterating over steps 3 and 4 m times to produce each chain:Footnote 13
1. Initialize the latent strengths, y*i0: Draw, for all members of the party congress, a random feasible rank. A set of feasible ranks must respect all tier bounds and tie restrictions, and use each possible rank only once.
2. Initializeβ0: Using the starting values y*i0 and the covariate data xi, compute the starting values of the parameters by least squares. Then compute μi0 = xiβ0.
3. Update the latent strengths, y*im: Using the μm − 1’s from the previous iteration, for a randomly chosen i, draw a new latent strength y*im somewhere above the highest latent strength of individuals known to rank below i, but below the lowest latent strength of individuals known to outrank i. Continue drawing until each individual has an updated latent strength.
Formally, draw y*im within [ℓ*im, u*im], where
(2)
By default, draw each new y*im using the Gibbs sampler. To perform a single Gibbs draw from y*im, sample a single probability wim from the interval implied by the tier bounds,
(3)Then y*im is simply the quantile of the standard Normal distribution corresponding to wim.The Gibbs sampler can run into computational difficulties when computing Normal cumulative distribution functions if, for a given observation i and MCMC iteration m, the expected value of the distribution of latent strengths μi,m − 1 lies far outside the bounds {ℓ*im, u*im}. In those cases, we employ instead the slower Metropolis–Hastings algorithm (of which Gibbs is a special case), for which we need only draw new candidate values of y*im from the appropriate proposal distribution:
(4)As usual, candidates for y*im replace the older values y*i,m − 1 based on a Metropolis–Hastings acceptance probability. To speed up convergence, tune σ2 to achieve an acceptance rate close to 40% (Gelman et al., Reference Gelman, Carlin, Stern and Rubin2003).
4. Updateβm: Using the updated latent strengths y*im and the covariate data xi, compute the updated parameters by least squares. Then compute μim = xiβm.
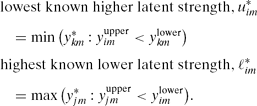
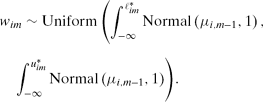

After an intial burn-in, iterate the Markov chains until all y*i’s and β’s appear to have converged to stable distributions, and then sample the posterior distributions of the latent stengths and parameters from the chains. For convenience, one can also sample the posterior distribution of each individual's unmeasured component of latent strength, αi.
Interpretation of Results
We interpret the model using conditional expectations and first differences for counterfactual scenarios as recommended by King, Tomz, and Wittenberg (Reference King, Tomz and Wittenberg2000), with the important caveat that we must also condition on the historical context against which any counterfactual individual is ranked:
Conditional Expectations. Conditional expectations in a rank model must condition not only on the hypothetical characteristics xc of a new member c, but also on the characteristics xi of all the observed members in the party congress the new member might outrank.Footnote 14 To calculate these conditional expected ranks, we draw sets of the parameters  from the converged MCMC chains. For each draw h, we calculate a single conditional expectation of the new member's rank,

where rank(a; b) indicates the rank of object a within the set b.Footnote 15 We summarize the posterior distribution of  using the mean and 95% interval of our h draws. Finally, to facilitate comparison across party congresses, we transform the expected ranks to a percentile scale.Footnote 16
First Differences. As in linear regression models, we are interested in how changing a covariate from xoldc to xnewc shifts the expected rank for a hypothetical individual. Although this “first difference” is simply β for linear regression, in the Bayesian partial rank model, as in many non-linear models, we must calculate it from the model parameters. To calculate a first difference for the Bayesian partial rank model, we draw a vector of  ’s from the model posterior, and subtract the rank for the baseline scenario from the rank for the new scenario:

As before, we summarize the distribution of first differences with their mean and 95% confidence interval, and convert these to a percentile scale for ease of comparison across years and covariates.
Summary Statistics for Model Covariates

Note: Entries are the observed means for each covariate in each model, by party congress. For continuous variables, the standard deviation is included in parentheses. aCCP since 1935, CCP since 1945, and CCP since 1949 are coded 1 for members who joined the CCP before 1935, between 1935 and 1945, and between 1945 and 1949, respectively. However, if CCP by 1935 is omitted from the model, CCP by 1945 then includes all members who joined before 1945, and so on. bRelative GDP growth and Relative revenue growth are measured as the difference between the average annual percent growth in GDP (or revenue) in the province governed by the individual and the corresponding population-weighted average annual percent growth in GDP (or revenue) across all other provinces. The GDP and revenue figures in this table reflect means and averages for members who were provincial governors or party secretaries only.
Implementation
A complete suite of tools for inference and interpretation of the Bayesian partial rank model is available in the R package partialrank.Footnote 17 Monte Carlo experiments across a range of hypothetical rank data sets of varied size and degrees of partial observation show that the model meets or exceeds the performance of linear regression, censored regression, and ordered probit in terms of bias, mean squared error, and coverage of confidence intervals (Adolph Reference Adolph2011).
 values were generally below 1.1.

 is a randomly chosen
 . The same algorithm can be used, mutatis mutandis, to create predicted first differences.
 .




Comments
No Comments have been published for this article.