


Introduction
Rain-on-snow events (winter rainfall on snowpack) are a major cause of wet snow avalanches (Reference Conway and RaymondConway and Raymond, 1993; Reference Stimberis and RubinStimberis and Rubin, 2011), owing to the increasing load of rainwater and decreasing snow strength or friction by lubrication at the internal or basal part of the snowpack (Reference McClung and SchaererMcClung and Schaerer, 2006). The subsurface snow loses strength over time as the rainwater penetrates the snowpack. This mechanism causes avalanche release after the onset of rain to be delayed and makes it difficult to predict the time of release.
Wet snow shows lower shear strength than dry snow with increasing water content (Reference Yamanoi and EndoYamanoi and Endo, 2002). This is probably because melt metamorphism reduces the grain bond radius (Reference Ohmae and WakahamaOhmae and Wakahama, 1980). The above results were obtained using wet snow samples when sufficient time had elapsed after moistening; however, the change in strength from the dry to the wet condition was little measured (Reference Techel, Pielmeier and SchneebeliTechel and others, 2008). Hence more knowledge of the snowpack strength during the wetting process is required to accurately predict wet snow avalanche activity.
Field measurement is the most reliable method for determining the change in snow strength during a rain-on-snow event; however, this can be difficult since not only the snow but also weather conditions can change rapidly. In this study, laboratory experiments were performed under controlled conditions to investigate the change in snow strength with increasing water content due to rainwater percolation.
Methods
Laboratory experiments were carried out at the Cryospheric Environment Simulator, Shinjo, Japan, from 17 to 21 January 2011. In this facility, snowfall and rainfall can be artificially reproduced by machines.
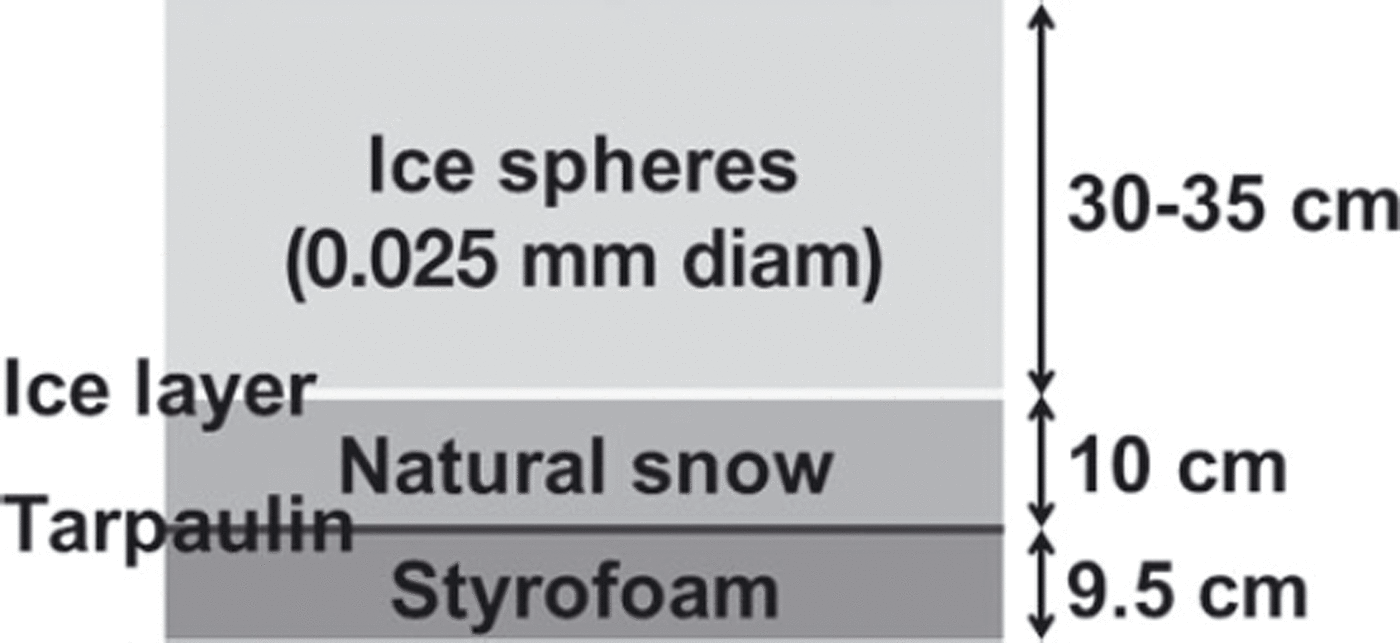
Snowpack was artificially prepared on a 3m×5m experimental table beneath the snowfall and rainfall machines. From bottom to top, the snowpack consists of insulation (9.5cm thick), a tarpaulin sheet, compacted natural snow (10cm thick), a thin ice layer, and ice spheres from the snowfall machine (0.025mm diameter and ∼30 cm thick) (Fig. 1). The ice layer was formed by water spray below freezing point, in order to increase water content above the ice layer.
Schematic of artificially prepared snowpack.
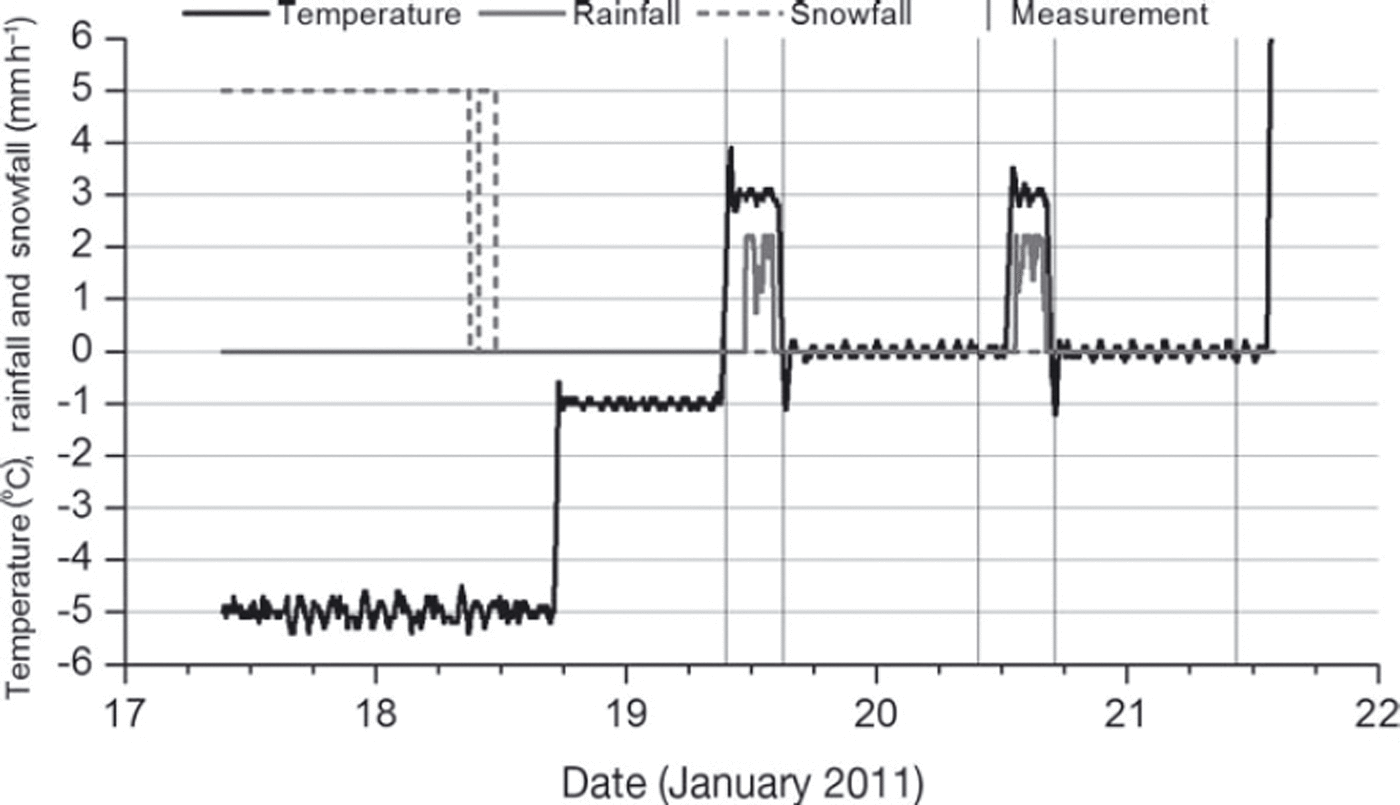
Rainfall was applied to the snowpack 22–25.5 and 49–52 hours after the snowpack was formed. The precipitation type was drizzle with an intensity of 2mmh–1. Part of the snowpack was covered to keep it dry so that it could be used as a comparative sample. Before and after each rainfall, snow temperature, density, hardness and weight water content were measured to observe the snow profile. The snow hardness was measured with a push–pull force gauge (Reference Takeuchi, Nohguchi, Kawashima and IzumiTakeuchi and others, 1998) to indicate the snow strength. The weight water content was measured with an Endo-type calorimeter (Reference Kawashima, Endo and TakeuchiKawashima and others, 1998). In addition, micrographs of the snow particles were constantly taken to observe wet snow metamorphism. The experimental room temperature was set to –5˚C during snowpack formation, 3˚C during the rainfall and 0˚C after the rainfall (Fig. 2).
Change in temperature and snowfall/rainfall intensity. Vertical lines show the time when snow profile observations were made.
Results
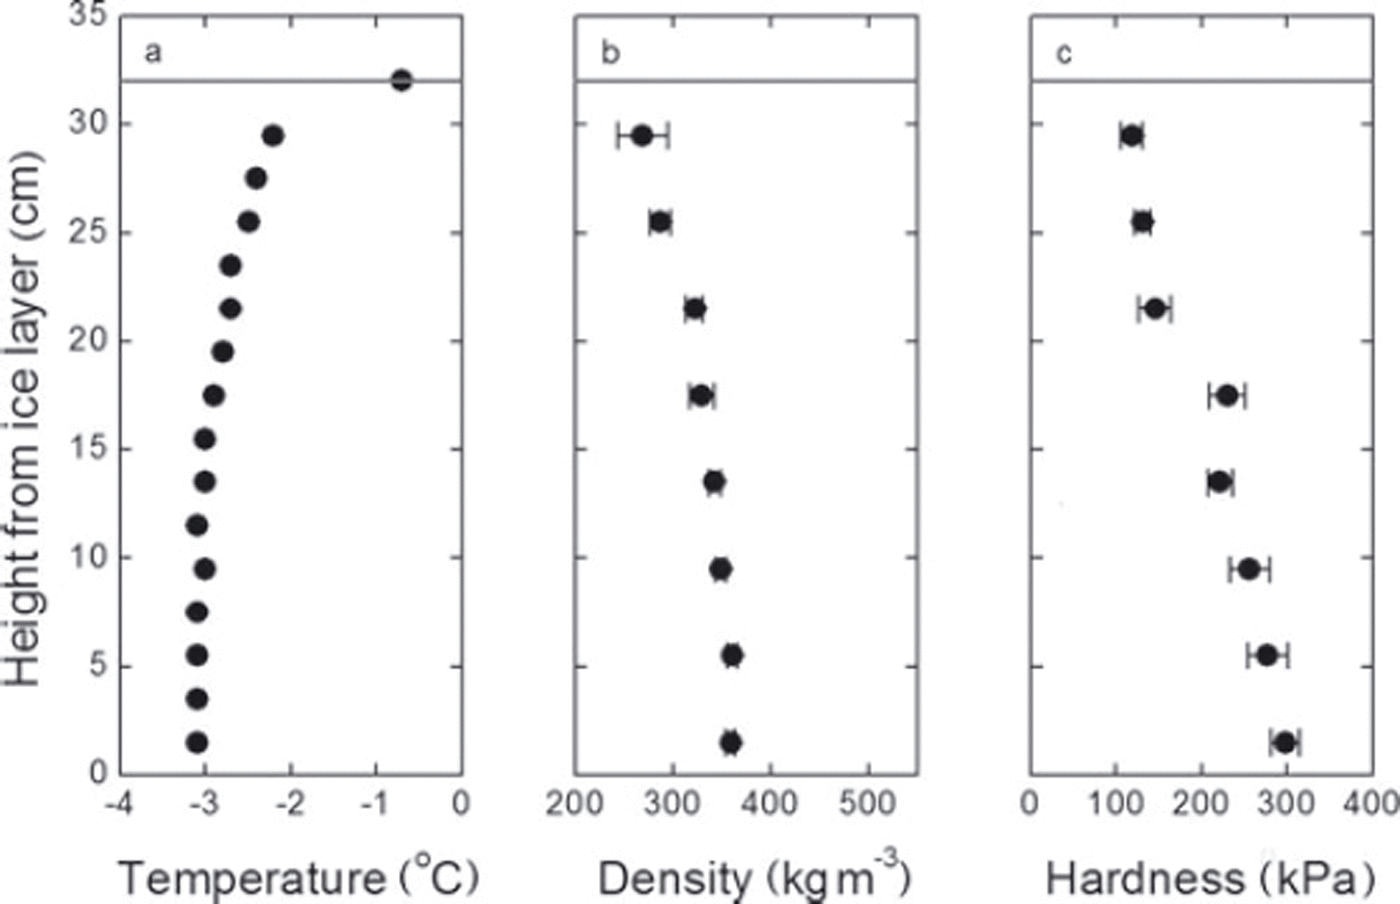
The snow profile was observed 21 hours after the snowpack was formed. Micrographs showed that the snow grains are very fine and well rounded (Fig. 3). The entire snowpack was well compacted and the profile showed high density (>300kgm–3) and hardness (>105Pa) with an almost linear increase from top to bottom (Fig. 4). In this observation, we attempted a shear-frame test to measure the shear strength of snow, but a clear shear plane was not observed at the fracture surface, probably because the snow was very hard. Hence, in the following, we adopt the snow hardness as an index of snow strength. Reference Yamanoi, Takeuchi and MurkamiYamanoi and others (2004) showed that shear strength, σ (Pa), can be estimated using snow hardness, H (Pa), regardless of types of snow and dry/wet conditions, as follows:

Micrograph of near-surface (2.5cm below the surface) snow particles before the first rainfall.

Snow profile 21 hours after the snowpack was formed: (a) temperature, (b) density and (c) hardness of snow, with error bars showing standard deviation. Horizontal line shows height of snow surface.
Equation (1) is derived by regression analysis and shows dimensional inconsistency. This suggests the hardness measured with the push–pull force gauge consists not only of the shear but also of the compressive components.
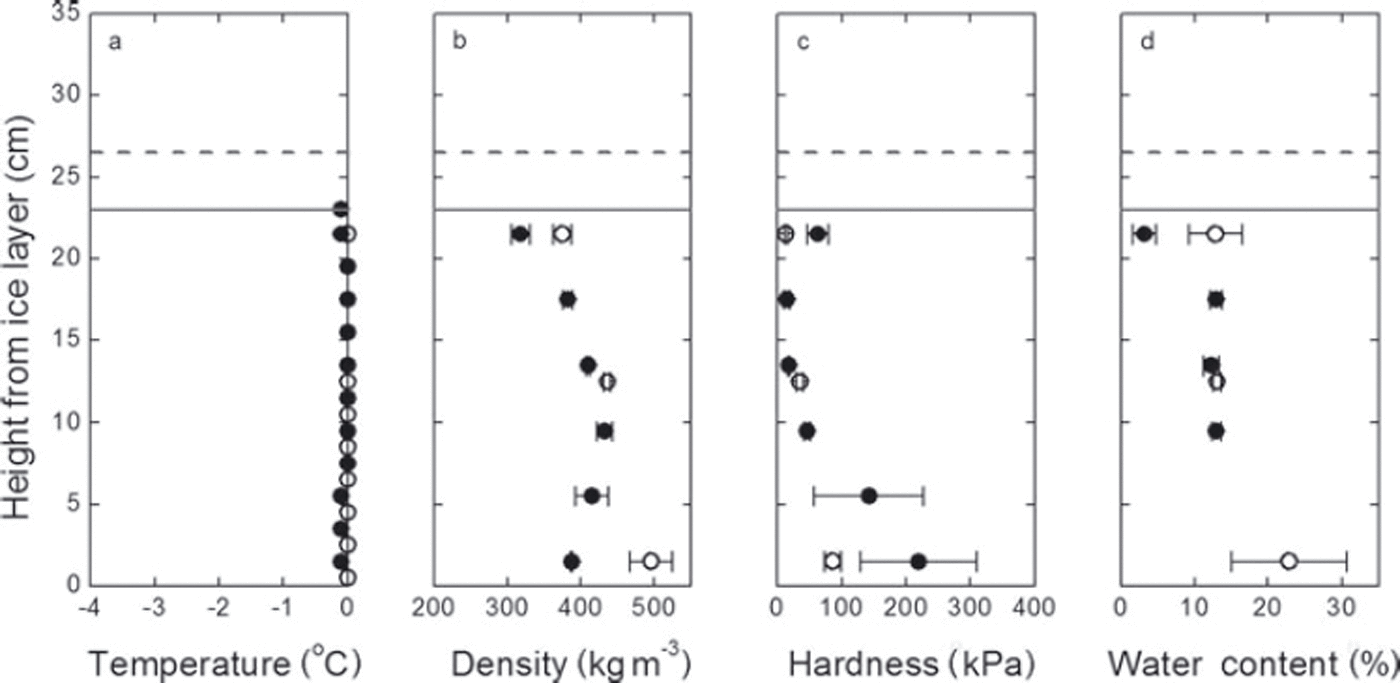
Figure 5 shows the change in the snow profile after the first rainfall. The upper part above 20 cm became wet; the water content increased to 15% and the temperature decreased to 0˚C. A significant decrease in snow hardness is also observed. The hardness near the snow surface decreased by an order of magnitude after 3.5 hours of rainfall.
Snow profile before and after the first rainfall: (a) temperature, (b) density, (c) hardness and (d) weight water content of the snow, with error bars showing standard deviation. Closed and open circles show the plots before and after the rain respectively; solid and dotted horizontal lines show height of snow surface before and after the rain respectively.
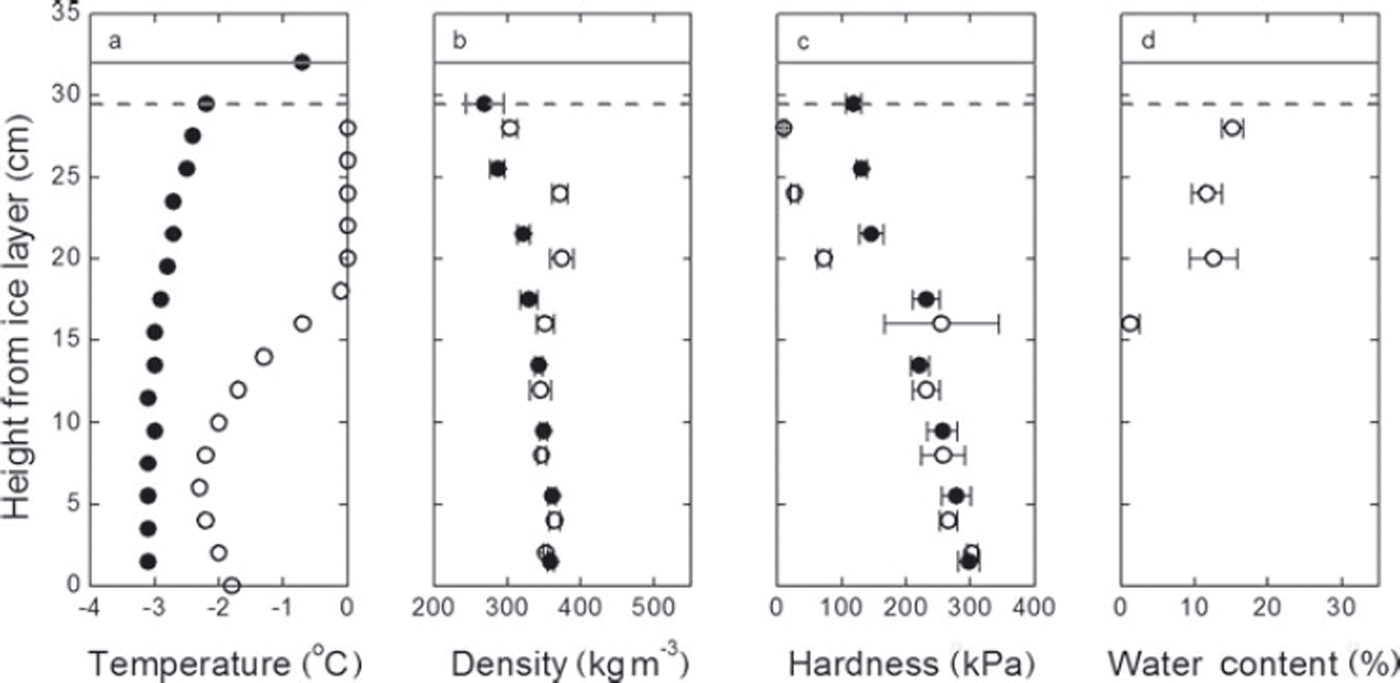
Figure 6 shows the change in the snow profile caused by the second rainfall. The rainwater finally penetrated to the ice layer, and the water content near the ice layer increased to ∼23%, due to a blocked drain by the ice layer. On the other hand, the water content of the upper part of the snow showed almost constant values of ∼13% both before and after the second rainfall. The density and hardness also showed a similar variation: values were almost constant in the upper part, while rapid changes were observed near the ice layer.
Same as Figure 5, but for the second rainfall.
Discussion
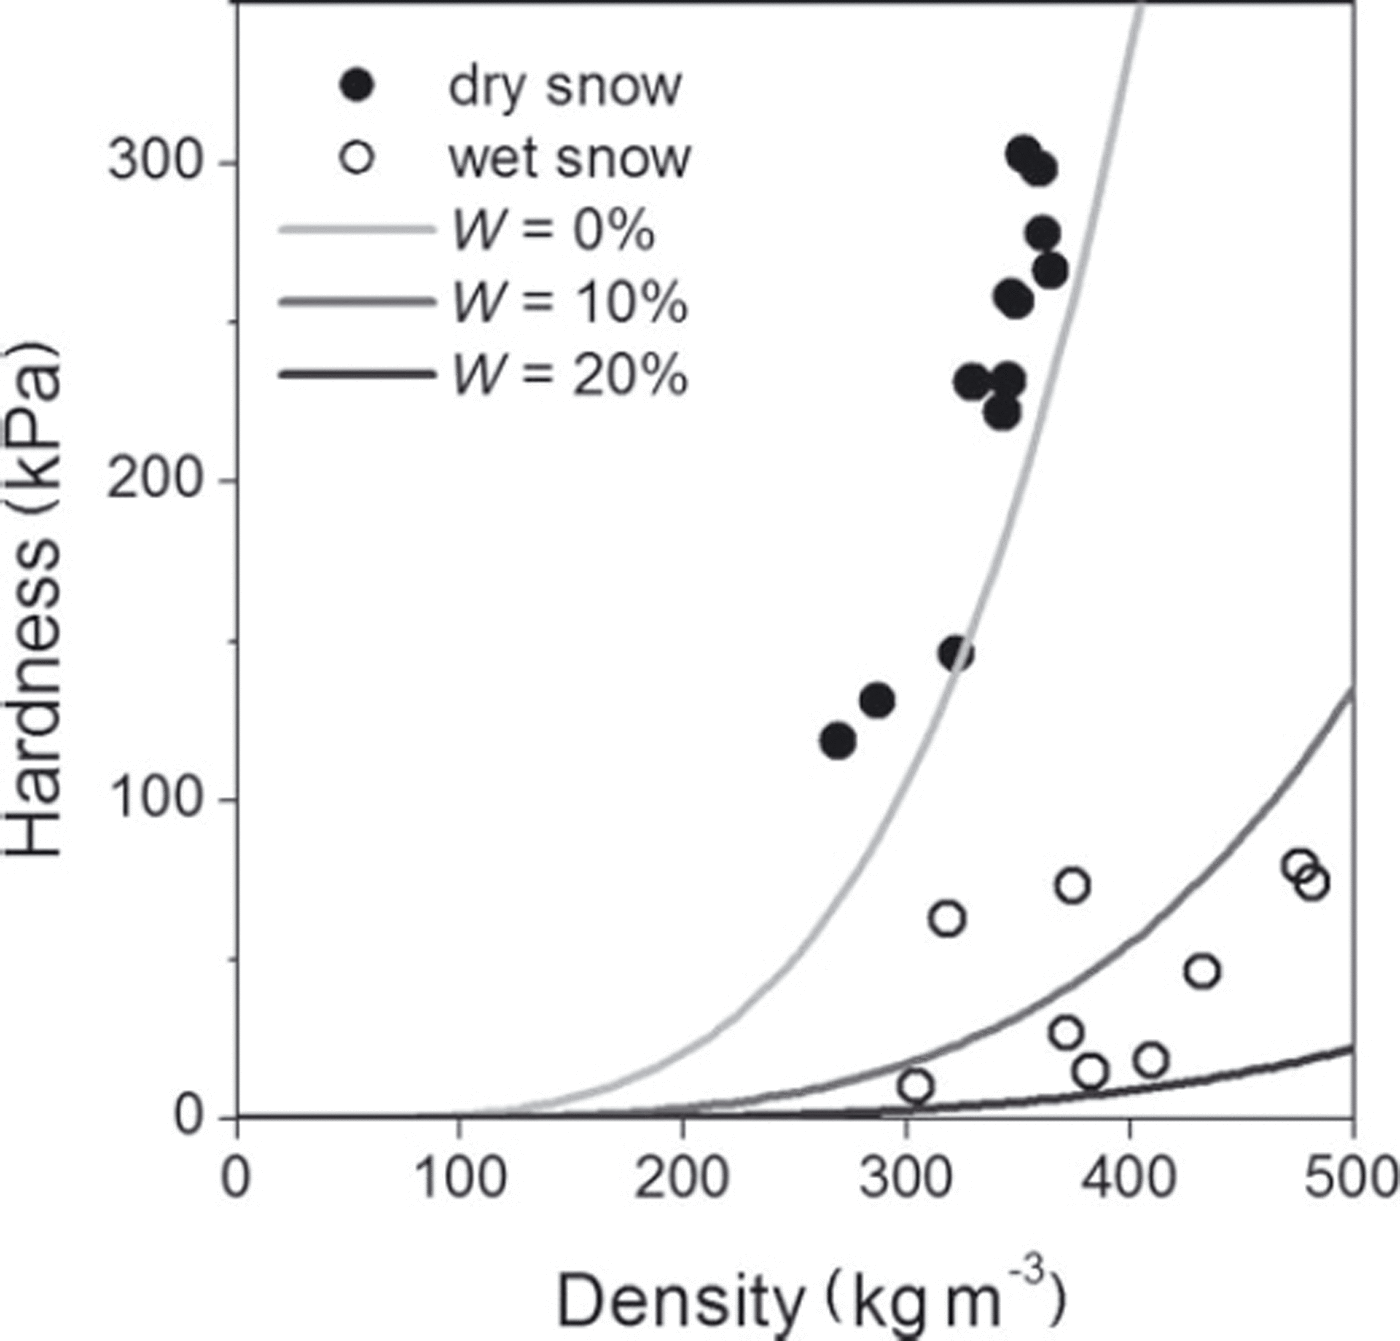
The hardness of snow, H (kPa), can be empirically estimated from the density, ρ (kgm–3), and water content, W (%), (Reference Takeuchi, Endo, Murakami and NiwanoTakeuchi and others, 2007) as follows:

Note that Eqn (2) is dimensionally inconsistent since it is derived from a regression analysis only adjusted for a numerical relationship between the parameters observed in natural snowpack. A similar empirical relationship was obtained by Reference GoldGold (1956), between the snow hardness and the density to the power of 3.92. Figure 7 shows the function above and plots of the relationship between the measured hardness and density. The hardness obtained in the experiments appears to be in good agreement with Eqn (2).
Relationship between hardness, density and water content. Closed and open circles show the observation results of dry and wet snow respectively; curves show the empirical function from Reference Takeuchi, Endo, Murakami and NiwanoTakeuchi and others (2007).
Next we calculated the difference between the measured hardness value and that estimated from Eqn (2) in order to verify the relationship precisely. Figure 8 shows the differences between measured and estimated hardness calculated using average values for each measurement. In the measurements immediately after the rain (1 hour after the first and second rainfalls), the hardness at the lower position was considerably larger than estimated (Fig. 8a and c).
Difference between measured and estimated hardness: (a) 1 hour after the first rainfall, (b) 20 hours after the first rainfall, (c) 1 hour after the second rainfall and (d) 19 hours after the second rainfall.
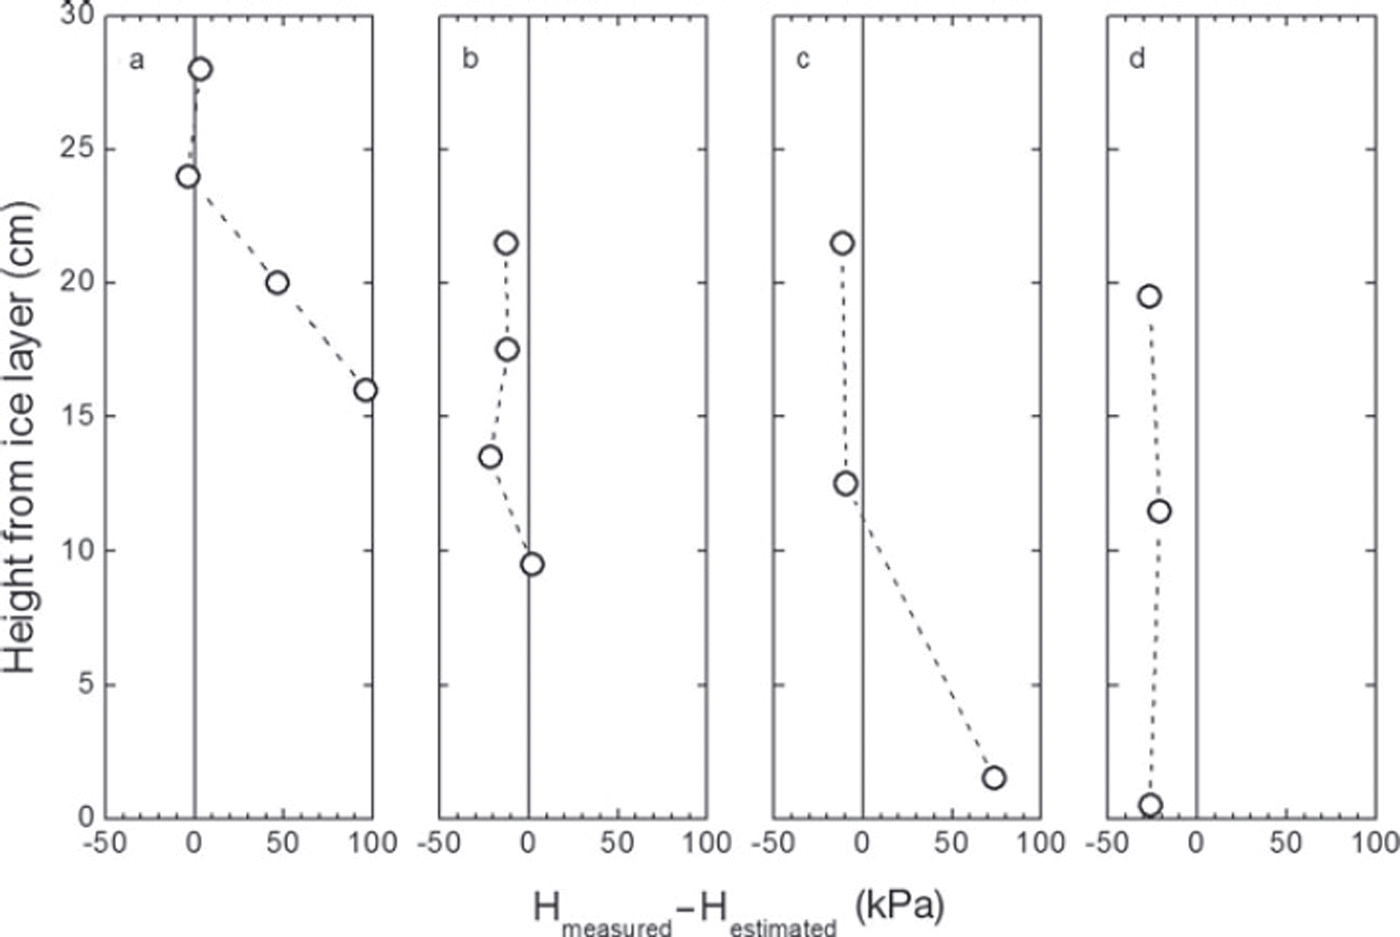
To check whether these differences are significant, we calculated the uncertainty of the measured and estimated hardness using the standard deviation, σ, instead of the t-test, because of the small sampling number. The variance, σ 2, of Eqn (2) can be calculated by the quadratic sum of the product of partial derivative and standard deviation with respect to each parameter (Reference TaylorTaylor, 1997). At the lowest position in Figure 8a (16 cm), the measured and the estimated hardness were 255.1±177.6 and 158.8±80.3 kPa, respectively. Note that the uncertainty shows twice the standard deviation (±2σ) for a 95% confidence interval. Hence the difference (96.3kPa) seems insignificant due to the large standard deviation of measured hardness probably caused by non-uniform penetration depth near the wetting front of the rainwater. On the other hand, at the lowest position in Figure 8c (1.5 cm), the measured and the estimated hardness were 86.6±24.0 and 12.8±36.8kPa, respectively. Hence the difference (73.8kPa) was considered significant since the sum of the uncertainty is smaller than the difference.
In contrast to the previous results, the difference decreases 19–20 hours after the rainfall events (Fig. 8b and d). The wetting front in the snowpack corresponds to the position where the hardness was higher than estimated, so this result indicates that the dry snowpack shows a delay in the decrease in snow strength after arrival of the wetting front.
We examined micrographs of the snow particles to investigate the relationship between the strength and metamorphism of the snow. Figure 9 shows micrographs both near and above the wetting front. Well-coarsened and -rounded particles were found above the wetting front (Fig. 9a and c) and the snowpack that was kept wet after the rainfall (Fig. 9e and f). However, the snow particles near the wetting front (Fig. 9b and d) were relatively small and still compacted. This result suggests that wet snow metamorphism is required for snow strength to decrease between dry and wet conditions since wet snow has fewer intergranular bonds.
Micrographs of snow particles: (a, b) 28 cm (a) and 20 cm (b) in height 1 hour after the first rainfall; (c, d) 12.5cm (c) and 1.5 cm (d) in height 1 hour after the second rainfall; and (e, f) 11.5cm (e) and 0.5 cm (f) in height 19 hours after the second rainfall.

Conclusion
We performed experiments to measure the change in snow hardness between dry conditions and wet conditions caused by rainwater percolation. Hardness decreased with increasing water content in the snowpack. However, the ratio of the decrease was sometimes lower than was estimated from natural snowpack observation. Micrographs revealed that the delay in grain coarsening near the wetting front induces a harder snow condition than estimated. This result suggests that rain on dry compacted snow can more easily cause a delayed avalanche than rain on wet snow. It also indicates that the elapsed time after the rain-on-dry-snow event plays a more crucial role in the decrease in snow hardness than in the water content. However, this is just one case of a rain-on-snow event, using hard snowpack consisting of very fine snow particles, and more experiments using other snow types will be required.
Acknowledgements
We thank S. Mochizuki and G. Okawa for operating the experimental facility and for technical support with the measurements.



