Natural scientists have no doubt that pollution and resource use by humans are transforming the earth in ways that are fundamentally unsustainable.Footnote 1 This is all the more tragic given that many such transformations are unnecessary: policy experts point to effective, low-cost solutions.Footnote 2 Above all, mainstream environmental economics recommends that governments attach a price to polluting activities, in order to discourage polluters from imposing (externalizing) the costs of their polluting activities onto others.Footnote 3 Correcting the price a polluter must pay to engage in a polluting activity using a tax or obligation to surrender a tradable emission permit should be a cost-effective means of protecting the environment and maximizing social well-being.Footnote 4 In practice, where such market-based mechanisms have been introduced, their record has generally been excellent.Footnote 5
Yet such mechanisms are seldom introduced. The environmental tax share of all public revenues in the European Union barely changed between 2006 and 2013, for example, and has generally been falling since the mid-1990s.Footnote 6 In the UK, revenue from environmental taxes peaked as a share of all taxes and social contributions in 1998, and has changed little since 2001.Footnote 7 Given the growing scientific consensus about the seriousness of many environmental problems, why are governments making so little use of market-based instruments for environmental protection?
One major reason is public scepticism, if not outright hostility. Public opposition has killed efforts to introduce market-based mechanisms in places such as Australia, Canada and Switzerland.Footnote 8 We therefore need to know more about the sources of public opinion with respect to environmental protection generally, and how to present problems and solutions such that public opinion will allow states to take action.Footnote 9 This article aims to expand our understanding of conditions under which people are less hostile, and more open, to proposals for environmental protection using the market-based mechanism that is environmental taxation. The results in the article should be of interest not only to scholars of environmental politics and public opinion, but also to policy makers and advocates seeking to foster public support.
The headline result of the experiments presented here is that offsetting new green taxes with cuts to other taxes substantially increases public support, but framing revenue neutrality as merely a government promise rather than a fact appears to undermine much of the positive effect of offsetting.Footnote 10 Stating that the new green tax revenues are to be spent on the environment has no impact on support. Making the increased taxation more real to people by pointing out that it would apply to goods and services they purchase also has no effect, unless reference is made to the taxation of petrol and electricity specifically, in which case support declines. And these effects do not differ much even for people with quite different baseline attitudes.
The impact of framing revenue neutrality as a promise rather than a fact strongly supports prior claims, based on observational data, that political distrust is an important reason for people’s scepticism of market-based measures for environmental protection. Green tax increases are typically implemented in tandem with offsetting tax reductions elsewhere, often with the objective of winning public acceptance.Footnote 11 The results here validate that revenue neutrality should indeed be a powerful means of building support. But majorities of citizens in all countries do not believe that politicians keep their promises,Footnote 12 and there appears to be widespread scepticism that revenue neutrality will materialize in practice. As such, convincing the public to trust that governments will keep their promises on revenue neutrality is a key challenge for environmental policy makers and advocates; seemingly, until voters are convinced, they will remain hostile.
More broadly, this study – the first to use experimental data to test for a causal relationship between political trust and policy attitudes – suggests the need for a change of emphasis in definitions of political trust. Prior research has generally considered political trust to be about people’s satisfaction with their governments’ overall performance.Footnote 13 In contrast, the present study isolates cynicism – the perception that public officials lack honesty and integrity – and finds that this sentiment by itself exercises considerable influence over people’s attitudes. Regardless of whether they are happy about government performance, then, expectations about whether politicians will keep their promises are clearly an important determinant of people’s policy preferences.
THE POLICY AND POLITICS OF ENVIRONMENTAL TAXATION
The European Union defines environmental taxes as those ‘whose base is a physical unit (for example, a litre of petrol or a passenger flight) that has a proven negative impact on the environment’.Footnote 14 By this definition, environmental taxes in the UK summed to £44.6 billion in 2014, representing 7.5 per cent of all public revenue from taxes and social contributions, and households paid an average of £765 each for environmental taxes in 2012.Footnote 15 Britain is fairly typical in the Organisation for Economic Co-operation and Development (OECD) in terms of the environmental tax share of all public revenues.Footnote 16
What would it take to increase this share? Prior studies have identified a variety of macro-level conditions that shape countries’ use of environmental taxes: Ward and Cao for example emphasize the power of the energy-producing sector.Footnote 17 Yet there is widespread agreement that public opinion also influences environmental policy, and therefore that social scientists need to better understand that influence.Footnote 18 Politically, the introduction of any new tax presumes a certain measure of public ‘support, consensus, or even merely passive tolerance’.Footnote 19 Unfortunately, taxes remain an unpopular way of addressing environmental problems, even if they are a relatively popular kind of tax.Footnote 20 Environmental taxes are unpopular because all taxes are unpopular.Footnote 21
There is a rapidly expanding research literature on environmental attitudes generally. A number of works in sociology, for example, have addressed the demographic correlates of environmental concern, defined as ‘concern about environmental problems and support for environmental protection’.Footnote 22 Such studies have focused largely on the importance of income (at both the national and individual/household levels), as well as underlying general values.Footnote 23 Beyond the demographic characteristics of individuals that correlate with different kinds of environmental attitudes, though, we still know little about the substance of the beliefs that lead people to hold the attitudes and preferences they do.
This article builds on a number of prior studies of environmental attitudes generally that have made good use of questions about taxation. Survey questions about a respondent’s ‘willingness’ to pay taxes admittedly leave somewhat implicit the scenario in question, but most respondents likely understand that the question is about a potential tax policy change, not about whether the respondent will choose individually to cheat on his/her taxes. As such, this is a different issue than tax compliance.Footnote 24 Questions about taxation are also useful insofar as they interrogate people’s valuation of environmental protection at some cost.Footnote 25 In the absence of any trade-off, supporting environmental protection would seem a given. What is more telling is whether people care enough about environmental quality such that they are willing to pay a price for it.
PUBLIC SUPPORT FOR ENVIRONMENTAL TAXES
Aside from studies of how preferences differ according to background demographic and attitudinal characteristics, a small number of studies have sought to illuminate conditions under which people are more supportive of environmental taxes.Footnote 26 Much of what we currently know also comes from public opinion polls that are only weakly connected to the academic research literature, such as those conducted by a self-styled ‘Green Fiscal Commission’ in Britain in the late 2000s.
Aside from prior empirical findings, some expectations can be derived theoretically.Footnote 27 The literature on public attitudes towards taxes in general suggests that people are at least partly rational,Footnote 28 in the basic sense that they seek to reduce the tax burden they have to pay, while seeking public benefits. With respect to the environment, then, while people are willing to pay a price for tackling problems like climate change, they are nonetheless sensitive to the costs.Footnote 29 At the same time, however, the public’s fiscal preferences are also far from rational, in that they are contradictory. As Schenk puts it: ‘Voters [send] conflicting signals to their representatives: they want programs but they do not want to pay for them’.Footnote 30 McCaffery and Baron agree: ‘The average person suffers from a wide range of heuristics and biases in thinking about tax and public finance, leading to inconsistent judgment and decision making’.Footnote 31 Most importantly, people appear to attach little weight to the benefits that potential new tax revenues might provide. Environmental tax policy preferences should therefore reflect the relative saliences of the direct costs and benefits that different proposals represent to survey respondents. Where people are made to think more about the costs to themselves, or made to think that those costs will be greater, their acceptance of environmental taxation should be lower. Conversely, people should be more accepting of tax proposals if they are made to think about ways in which such proposals might provide them with clear benefits.Footnote 32
From this basic theoretical premise, and in light of what empirical literature there is on attitudes towards environmental taxes, I derive five hypotheses.
First, people should be more accepting of new environmental taxes if those taxes are offset by reductions to other taxes, insofar as people should perceive substantially lower net costs to themselves than they would in the absence of such offsetting. Consistent with this expectation, the Green Fiscal Commission found much stronger support for revenue-neutral than for revenue-increasing green taxes.Footnote 33 Another study found that Americans’ support for carbon taxes rose when it was tied to offsetting reductions in income tax.Footnote 34 Still, questions remain about the robustness of this relationship, particularly as many people appear not to believe or understand that a revenue-neutral tax shift can be beneficial for the environment.Footnote 35
Hypothesis 1: Offsetting environmental tax increases with tax cuts elsewhere will increase people’s willingness to pay.
Secondly, people may not think that environmental taxes will cost them much money, insofar as they do not think of themselves as ‘polluters’. This is because people ‘externalize responsibility’ a great deal.Footnote 36 They seek to avoid blame for contributing to environmental problems, ascribing all responsibility to corporations and governments instead of accepting that individuals and families bear some responsibility for taking action.Footnote 37 It may then be the case that respondents respond more hostilely to proposals for environmental taxation the more they are confronted with suggestions that their own lifestyles have environmental impacts – not just because they resent being framed as ‘polluters’ but also because they understand that they should then expect to pay more in tax.
Hypothesis 2: Drawing people’s attention to the fact that environmental tax increases will apply to their consumption and spending will reduce their willingness to pay.
Thirdly, naming specific examples of goods that would be covered by potential new green taxes might make the likely costs of such taxes even more salient to people, and therefore objectionable. Consistent with this suggestion, some previous studies have found that support for environmental taxes is particularly low where the tax will apply specifically to domestic energy and vehicle fuels.Footnote 38 In two US states, for example, Shwom et al. found that taxes on petrol were the least popular environmental policy instrument, by far.Footnote 39 In the UK, the taxation of energy specifically is quite heavy (second highest in the EU), with most of the tax burden falling on households.Footnote 40 Yet transport fuels and home energy are generally quite polluting, and so are likely candidates for additional taxation.
Hypothesis 3: Naming specific goods to which new environmental tax increases would apply, such as petrol and electricity, will reduce people’s willingness to pay.
Fourthly, people should be more accepting if their attention is drawn to ways in which the money they pay in taxes is put to beneficial purposes. The literature suggests in particular that many people perceive environmental taxation as more legitimate if the associated revenues are also spent on the environment, possibly because they do not understand that a tax can be beneficial through its incentive effects. In the case of an energy tax change in Germany, for example, some members of the public specifically ‘demanded that energy taxes be used to promote energy savings and subsidize public transport’.Footnote 41 Many studies therefore find ‘that earmarking the revenues from environmental taxes for environmental purposes increases their popularity’.Footnote 42 From a policy perspective, both the Chartered Institute of Taxation and the House of Commons Environmental Audit Committee argue that hypothecating revenues for spending on environmental protection should increase public support.Footnote 43
Hypothesis 4: Hypothecating the revenues from increased environmental taxes for spending on environmental protection will increase willingness to pay.
Finally, if people’s acceptance depends on whether new environmental taxes are revenue neutral and/or on how revenues are spent, people may be hostile to proposals for new environmental taxes if that they do not believe governments will actually introduce the new taxes as promised – cutting other taxes and/or spending new revenues on the environment.Footnote 44 As the Chartered Institute of Taxation notes, ‘people do not trust governments to implement the environmental taxes in a fiscally neutral way’.Footnote 45 Instead, people regard taxes on energy for example as ‘stealth taxes’. A 2008 Ipsos MORI poll found that 59 per cent of Britons agreed that ‘climate change is being used by the Government as an excuse to raise taxes’.Footnote 46 And Harrison notes that even in British Columbia – where a carbon tax has proven politically sustainable – ‘voters simply did not believe the government’s reassurances that the tax was revenue neutral’.Footnote 47 Respondents could then distrust that governments will fulfil their promises to make new green taxes revenue neutral and/or to spend the revenues they generate on environmental protection.
Hypothesis 5a: Framing the dedication of revenues from environmental taxes to spending on environmental protection as a government promise will reduce willingness to pay relative to framing it as a fact.
Hypothesis 5b: Framing revenue-neutral offsetting as a government promise will reduce willingness to pay relative to framing it as a fact.
In testing these last two hypotheses, this study builds on prior research arguing that trust, including particularly political trust, shapes support for environmental protection.Footnote 48 Previous studies have all, however, been based on observational data. This limitation reflects that it is clearly not possible to randomly assign subjects to different levels of political trust, in the sense of perceptions of whether the government ‘is producing outcomes consistent with their expectations […] a pragmatic running tally of how people think the government is doing at a given point in time’, to quote Hetherington’s influential definition.Footnote 49 But the experiment here nevertheless investigates the impact of political distrust, by randomly assigning subjects to conditions under which political trust explicitly is (or is not) relevant. In some scenarios a key policy feature is presented as a government ‘promise’, meaning that respondents’ preferences should reflect their expectations about the probability that the people running the government will fulfil their promises. In other scenarios, the same feature is presented simply as a fact, making such expectations irrelevant.
Prior observational research has typically measured political trust using one or more broad questions about respondents’ overall confidence or trust in parliament, politicians, etc. and/or about how often they think the government ‘does what is right’.Footnote 50 The experiment here, in contrast, isolates and tests the specific impact of cynicism – ‘the integrity dimension of political trust’.Footnote 51 This is a somewhat different conception of political trust than is typical in the literature, with a different emphasis than Hetherington’s influential performance-focused view. The conception here instead focuses on people’s expectations about honesty and promise keeping,Footnote 52 and their beliefs about the trustworthiness of government promises.Footnote 53 This perspective echoes earlier work explicitly equating political distrust to cynicism,Footnote 54 and reflects that a decision to trust presumes ‘the expectation that [a] trustee will do X, framed in terms of a probability’.Footnote 55
The analyses below contrast how people’s willingness to pay new environmental taxes depends on their cynicism as measured using both (1) baseline questions about their generic views of ‘the people running the government’ and (2) the effect of framing policy features as government promises. These analyses contextualize prior studies’ findings about the consequences of political trust and test whether political cynicism is indeed, as some have it, ‘neither deeply felt nor behaviorally potent’.Footnote 56
The models presented below also investigate how the impacts of the randomly assigned treatments differ across respondents with a variety of characteristics that might shape their responses to the treatments. These characteristics are: belief versus scepticism in climate science; left versus right/liberal political views; political cynicism (as discussed above); interest in politics (a characteristic closely related to political dis/trust); and political party identification (Conservative versus Labour). First, Britons who do not believe in the seriousness of environmental problems might well fail to respond to any attempts to shift their willingness to pay new green taxes, insofar as they may lack a baseline reason to support protection efforts. Secondly, people subscribing to right-of-centre political views may resent the state regulatory intervention embodied by any kind of taxation, and so they too could be less sensitive to efforts to increase their willingness to pay.Footnote 57 Thirdly, people with low levels of baseline political cynicism as captured by standard attitudinal measures should be less bothered by suggestions that appealing features of green tax proposals are just government ‘promises’; testing whether this is indeed the case will help assess the value of those measures. Fourthly, people with little interest in politics would appear least likely to be knowledgeable about public policy, and so to appreciate how green taxes can incentivize behaviour change; they might therefore respond differently to key features of proposals for new green taxes. Fifthly, sympathizers of the main opposition political party might respond differently to some treatments, particularly as they may be less trusting of politicians in the current government.
RESEARCH DESIGN, DATA AND ANALYTICAL METHODS
Social scientists are making increasing use of survey experiments to understand the public’s attitudes towards environmental degradation and protection.Footnote 58 I designed an experiment in which each respondent to a nationally representative survey received one of several different versions of a commonly used opinion question about support for environmental protection. The question specifically investigated support for environmental protection in the form of taxation, the base version reading: ‘How willing would you be to pay higher taxes in order to protect the environment? Not at all willing, not very willing, fairly willing, or very willing?’ The International Social Survey Programme has previously used this question, across multiple waves, and a question similar to it has also been included in the World Values Surveys (WVS)/European Values Studies (EVS).Footnote 59
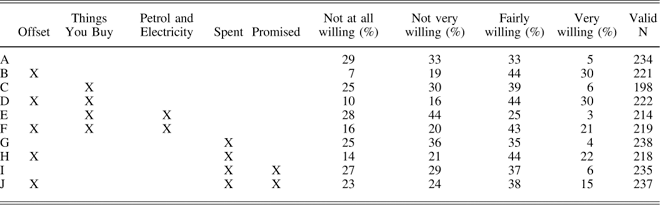
Respondents were randomly assigned to five treatments in ten different combinations – see Table 1 below (and Appendix A, for the complete wordings of the ten different versions of the question). The five experiments running simultaneously investigated the impact on people’s responses of:
1. Stating that new environmental taxes would be offset by cuts to other taxes. (According to Hypothesis 1, offsetting should increase support.)
2. Emphasizing that respondents themselves are polluters, specifically as consumers, with the implication that new environmental taxes would affect the cost of things they buy. (According to Hypothesis 2, making the personal costs of environmental taxes more salient should reduce support.)
3. Pointing out two specific products to which new environmental taxes would apply (petrol and electricity), and suggesting that the prices of these already heavily taxed products would rise. (According to Hypothesis 3, taxing petrol and electricity specifically should reduce support.)
4. Stating that new revenues from environmental taxes would be spent on (unspecified) programmes for environmental protection. (According to Hypothesis 4, hypothecating should increase support.)
5. Drawing respondents’ attention to the possibility that the government may not do what it says, in having only ‘promised’ to spend the tax revenue on the environment and offset the new taxes. (According to Hypothesis 5a, only promising hypothecation should reduce support compared to it being a fact. According to Hypothesis 5b, only promising to offset new taxes should reduce support compared to it being a fact.)
Models with Observational Data Only

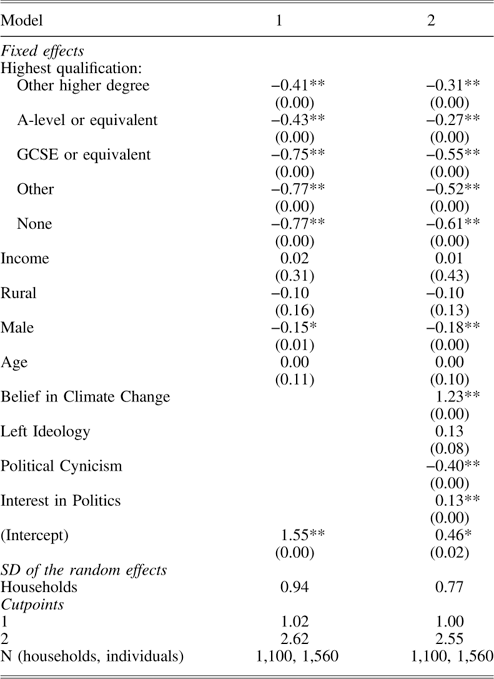
Note: random effects are presented on the standard deviation scale. Figures in parentheses are the modelled probabilities of the parameter having the opposite sign; coefficients are marked with * if the probability is less than 0.05, ** if less than 0.01. The reference category for highest qualification is possession of a degree.
The experiment was conducted as part of the UK Understanding Society Innovation Panel (IP), a longitudinal survey representative of households in Britain (excluding Northern Ireland and north of the Caledonian Canal). The first wave of the IP ran in 2008, and since then participants have been re-interviewed annually. The sample for the seventh wave (IP7), in 2014, consisted of households from the original 2008 sample as well as from refreshment samples added in 2011 and 2014. The data can be obtained from the UK Data Service.Footnote 60 IP7 generated interviews with 2,413 individual respondents, 2,236 of whom provided valid responses to one of the ten questions about environmental taxes.Footnote 61 The allocation into treatment groups was done at the household level, so all eligible adults in a household received the same treatment/question.Footnote 62
As explained earlier, the analyses below also use other baseline data collected as part of the IP. In particular, I investigate how the effects of the randomly assigned treatments may vary according to a number of non-experimentally manipulated, background attitudinal characteristics.
As a measure of people’s perceptions of the seriousness of environmental problems generally, I use an index comprising two questions about past and future climate change specifically:
∙ ‘As far as you know, would you say that average temperatures around the world have been higher in the last three years than before that, lower, or about the same?’ (AVTEMP)
∙ ‘Do you believe that people in the UK will be affected by climate change in the next 30 years?’ (OPECL30)
I interpret a response of ‘higher’ to AVTEMP as a stronger belief in climate change, since the scientific community agrees that the planet has been warming, with fifteen of the hottest sixteen years on record occurring since 2001.Footnote 63 Goodman-Kruskal’s G (a measure of association between two ordinal variables) for this index is 0.60, indicating an acceptably strong association between the two items. Disbelief in climate change is rare (20 per cent).
Secondly, I measure left as opposed to right/liberal political views with an index comprising two questions, JOBS and ADQHOUS, about economic policy (G=0.45):
∙ ‘Do you think the government should or should not see to it that every person has a job and a good standard of living?’
∙ ‘Some people feel the government should see to it that all people have adequate housing, while others feel each person should provide for his or her own housing. Which comes closest to how you feel about this?’
Since these two questions address support for the state’s active intervention in the economy, I also refer to them as measuring economic liberalism (in the European rather than American sense). This variable’s usefulness as a measure of left political ideology is demonstrated by its capturing meaningful partisan differences: its mean score for Conservative Party sympathizers is 0.45, 0.64 for Liberal Democrats and 0.77 for Labour.Footnote 64 Left ideology is prevalent by this measure – almost half of Conservatives subscribe to it – and it maps well onto the parties’ relative placements on an overall left–right index, judging by their platforms.Footnote 65
Thirdly, background political cynicism is measured as an index comprising answers to two questions that have long been used to measure generic political distrust (G=0.52):Footnote 66
∙ ‘Do you think that quite a few of the people running the government are corrupt, not very many are, hardly any of them are corrupt, or do you not have an opinion?’ (DCRKD)
∙ ‘Do you feel that almost all of the people running the government are smart people, or do you think that quite a few of them don’t seem to know what they are doing, or do you not have an opinion on that?’ (LDSMRT, reverse coded)
Cynicism as captured with these measures is widespread, with a mean score of 0.71 – consistent for example with an Ipsos MORI poll of British adults in 2009 that found only 13 per cent generally trusted politicians to tell the truth, the lowest proportion out of sixteen types of people.Footnote 67 Political cynicism is only minimally correlated with political ideology (G =0.09).
Fourthly, interest in politics, and potentially therefore people’s understanding of policy making, is captured by VOTE6 (with four ordered response options): ‘How interested would you say you are in politics?’Footnote 68
Finally, demographic covariates are education (highest qualification), age in years (less the sample minimum of sixteen), rural as opposed to urban residence, gender (female is the reference category) and income (FIHHMNGRS_DV, gross household income in the month prior to the interview, divided both by 1,000 and by the square root of the number of household members). Respondents were also asked to name the political party to which they feel closest. Many people did not identify a party, however, with only the Conservatives and Labour attracting more than just a few dozen sympathizers, so I limit the analysis of partisanship to just these two. At the time of the data collection, the Conservative Party was leading a coalition government, while Labour was the official opposition. Appendix B presents descriptive statistics for all these variables.
I present results below in the form of ordinal probit models fitted using the R package MCMCglmm.Footnote 69 Estimation was Bayesian, with flat priors. The probability of observing an outcome in category k is: Pr(y=k)=F N (γ k |w θ , σ e 2)−F N (γ k+1 |w θ , σ e 2), where F N is the normal distribution function, and σ e 2 is fixed at 1. The γ’s are cutpoints (with one γ equal to 0), w consists of fixed and random effects design matrices X and Z, and θ comprises vectors of regression coefficients β and random intercepts u. Because some households included multiple respondents to the individual survey (and all members of each household received the same treatment for the experiment), I include a random intercept for households in each model. This had the effect of slightly widening the credible intervals for the coefficient estimates. Given the Bayesian estimation of the models, instead of frequentist p values, the tables with the fitted models below include the modelled probability that the sign of each estimated beta coefficient was the opposite of the mean value. (The coefficient estimates presented are posterior means.) This Bayesian approach allows for more straightforward inferences and quantification of uncertainty, since it estimates the probability of a positive or negative relationship given the data, rather than the probability of the data given a null hypothesis that may or may not be true.Footnote 70
RESULTS
First, Table 1 presents models of willingness to pay as a function of only observational data. These models investigate the demographic and attitudinal correlates of being willing to pay taxes to protect the environment. Model 1 includes only demographics – education, income, gender, age and a dummy variable for rural rather than urban residence. Model 2 includes those demographics, plus a number of attitudinal covariates: belief in climate change, left ideology (versus economic liberalism), political cynicism and interest in politics.
Model 1 shows that higher- versus lower-income earners are no different in their willingness, and nor are rural versus urban residents, or older rather than younger Britons. But men and women, and even more so education groups, differ significantly: women are more willing to pay to protect the environment, and so are more educated people.
Adding attitudinal covariates makes little difference to these demographic relationships.Footnote 71 Model 2 shows that, not surprisingly, respondents who believe in climate change are more willing to pay taxes. The politically cynical are less willing, and those with left political ideologies are more so (though there is an 8 per cent chance they are less so). Ceteris paribus, those more interested in politics are also more willing.
Next, Table 2 presents the results of the five experiments, in the form of the raw percentages of respondents who provided each of the four possible answers, under ten different combinations of the five experimental conditions. Table 2 shows that, among respondents who received the base version of the question (A), about a third provided each of the three less supportive responses, and only a small number (5 per cent) gave the most supportive response (‘very willing’). The distribution of responses varied substantially across the other nine scenarios, indicating that differences in question wording made a meaningful difference.Footnote 72
Raw Percentages of Each Response, by Combination of Conditions

Note: raw percentages of respondents giving each answer, depending on the combination of treatments they were assigned.
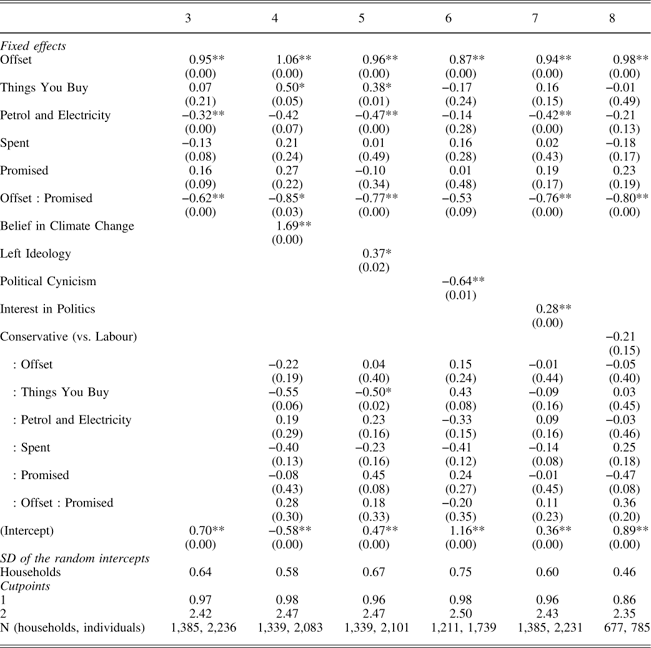
Table 3 presents the results of the experiments as analysed using multilevel models (such models are appropriate given the nesting of respondents within households). The first model in Table 3, with only dummies for the various experimental treatments on the right-hand side, presents the core findings of this article.Footnote 73 First, revenue neutrality is a strong means of increasing acceptance of environmental taxes: the coefficient on Offset is large. People are much more willing to pay if new environmental taxes are offset by tax cuts elsewhere. Hypothesis 1 is therefore supported.
Models including Randomly Assigned Treatments

Note: figures in parentheses are the probabilities of the parameter having the opposite sign; coefficients are marked with * if the probability is less than 0.05, ** if less than 0.01.
Secondly, making the likely costs of increased environmental taxation more salient to respondents, by framing respondents themselves as polluters, makes no notable difference. Hypothesis 2 is therefore not supported. Thirdly, however, naming petrol and electricity specifically as goods that would be subject to the hypothetical new tax substantially undermines support. Hypothesis 3 is therefore supported.
Fourthly, and somewhat surprisingly, the evidence here suggests people are not more enthusiastic if green tax revenue is Spent on the environment. If anything, people are marginally less willing to pay new environmental taxes if told that the revenues will also be spent specifically on programmes for environmental protection. Hypothesis 4 is therefore not supported.
Fifthly, it seems few people trust government promises. The coefficient on Promise is not statistically significant by itself, but that is because (as per the previous paragraph) people appear not to want the revenues from green taxes to be spent on the environment. They therefore are not concerned about the risk of governments failing to follow through on this promise, and Hypothesis 5a is not supported. People do, however, care about how much tax they pay. Where the government’s promise is not only to spend revenues on the environment, but also to offset new green taxes, then people have reason to worry about the risk that promised outcomes will never materialize. The coefficient on the interaction effect Offset : Promised, capturing how the effect of Offset changes if it is a government promise rather than a fait accompli, is negative and significant. Hypothesis 5b is therefore supported. While revenue neutrality makes environmental protection much more appealing to the public, political cynicism appears to reduce the positive effects of framing new environmental taxes as such. Considering the relatively minor difference in the wording between versions H and J, the magnitude of the impact on the responses is surprisingly large.Footnote 74
Models 4 through 8 in Table 3 are similar to Model 3, except that each one includes a series of interaction effects. In each model, one attitudinal covariate is interacted with each of the randomly assigned treatments. For each model, then, the first six rows in Table 3 present the effect of the treatment on the reference category: people who do not believe in climate change, who subscribe to economically liberal ideology, who are politically trusting, who are uninterested in politics, and who feel closest to the Labour Party, respectively. The next coefficient in each model indicates the difference between people holding the alternative and reference values for these attitudinal covariates – belief in climate change, etc. Then the next six coefficients capture the difference between the randomly assigned treatments’ effects on people with the alternative and reference values for each of these attitudinal covariates. In other words, each of these models treats a different kind of person as the baseline against which another kind of person is compared, in order to test whether the effects of the treatments differ significantly across the two types.
As in Table 2 above, belief in climate change, subscribing to left/anti-liberal political ideology, being politically trusting and being interested in politics all predict greater willingness to pay. The difference between Labour and Conservative voters is, however, marginal; there is even a 15 per cent chance that Conservatives are more willing to pay. The important question to be asked of Models 5 through 8, however, is whether the effects of the various randomly assigned treatments differ substantially across different types of people. At first glance, the answer is generally that they do not, insofar as only one interaction effect is statistically significant, in Model 5.
In Model 6, unlike in the other models, the probability that the effect of Offset : Promised is negative is less than 95 per cent for people in the reference category (not politically cynical). Yet the effect of this treatment is not much different for people who are politically cynical, judging by the coefficient on the interaction effect Cynical : Offset : Promised, which is estimated to be negative, but has a 35 per cent chance of actually being positive. The fact that the effect of Promised is smaller for people who are not politically cynical reflects logically that they are less sceptical about politicians keeping their promises, as does the negative sign on the triple interaction.Footnote 75
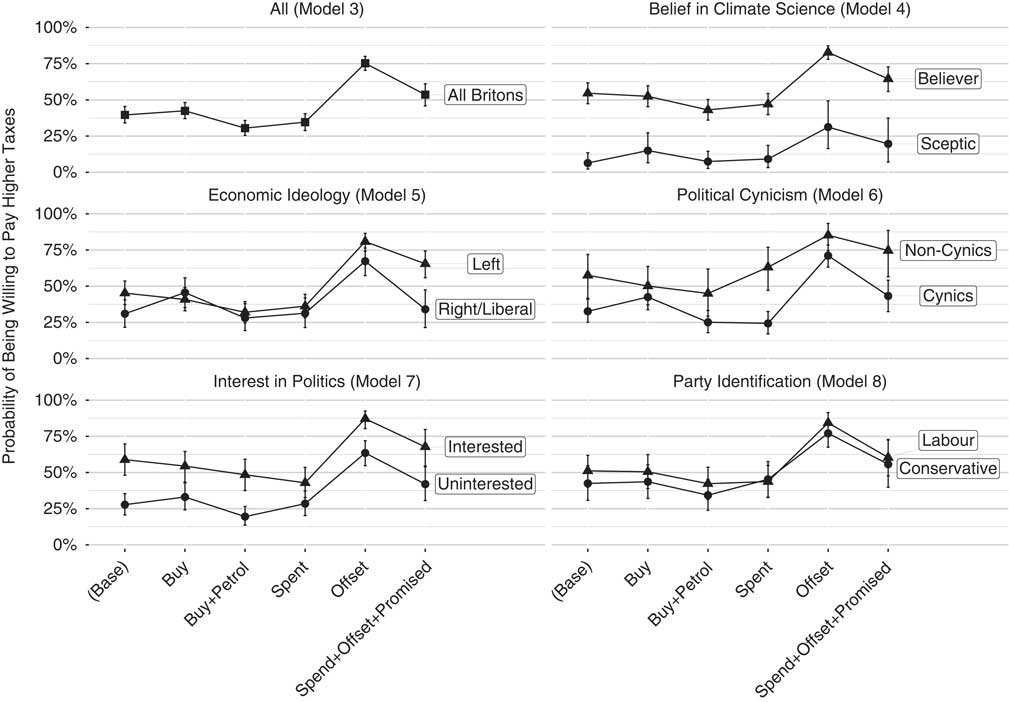
Since interpreting such interaction effects and their uncertainties is challenging, and to provide a sense of the magnitudes of all the effects, Figure 1 presents the expected responses by different types of people in six of the ten randomly assigned scenarios. The expected proportions of respondents who are at least fairly willing to pay new environmental taxes are derived from the models appearing in Table 3. The six panels present the results for Britons as a whole in the top left and contrasting types of people in the other panels, where the contrasts are between people with the minimal and maximal values for each variable.
Modelled probabilities of being willing to pay higher taxes to protect the environment, by experimental condition Note: expected proportions of various types of respondents being at least fairly willing to pay higher taxes, under six different scenarios (A, C, E, G, B and J from Table 2, in order from left to right), derived from Models 3 through 8. The vertical lines represent 95 per cent Bayesian credible intervals.

Out of all the different types of people presented in Figure 1, climate sceptics (who are a small minority) are clearly the most hostile to proposals for new environmental taxes: almost none are willing to pay for new taxes in the base scenario. Yet even climate sceptics respond positively to revenue neutrality, and indeed they respond to all the treatments in much the same ways as people who do believe in climate science. It would seem then that even people who are not very convinced about the seriousness of environmental problems can, to a degree, be won over.
In the rest of the panels, the pairs of groups are less divided. People subscribing to right/liberal economic views are not much different from those subscribing to left views, suggesting that at least in Britain there is no great political divide with respect to willingness to pay new environmental taxes. These two groups also respond similarly to most of the various randomly assigned treatments, though their responses differ somewhat to the Things You Buy and Offset : Promised scenarios.Footnote 76
Two greater divides, which appear in the next two panels, are instead between the cynical and the non-cynical and between the politically interested and uninterested.Footnote 77 The politically interested and uninterested respond very similarly to the different treatments, while cynics and non-cynics are distinct in their responses to some treatments. As noted earlier in the discussion of Model 6, while the effect of Promised differs for respondents who report different background levels of political cynicism, the difference is not statistically significant. And Figure 1 makes clear that even people who report the lowest baseline levels of background cynicism are still somewhat sceptical of government promises – even if they are not as sceptical as cynics.Footnote 78
There is also little distinction between people who feel closest to the Conservative Party and those who feel closest to Labour. If anything, Conservatives (who might seem more sanguine about the honesty of people in government, since the British Government was being run at the time of the survey by the Conservatives) evidence a more negative response to government promises. So it would seem that partisanship has little impact.
In sum, every type of respondent is most willing to pay new environmental taxes where the new taxes are offset by tax reductions elsewhere. Every type is also, however, less willing where offsetting cuts to other taxes are only a government promise, rather than a fact. That framing revenue neutrality as a government promise rather than a fact has such a marked effect suggests that few people regard government promises as credible. This result appears to validate the importance of the specific form of political distrust that is political cynicism.
There are two caveats about this finding, however. First, the number of respondents being compared here is modest – 441, as shown in Appendix D. Nevertheless, a direct test of the statistical significance of the difference between the responses under conditions J and H shows that the difference is indeed significant. Secondly, it is a limitation of the experimental design that there is no condition under which just revenue neutrality, not hypothecation, is a government promise. The difference between the responses under conditions H and J could be due merely to the greater complexity of the latter. Yet the difference between the two question versions is not large: J is just three words (or seventeen characters) longer. There are therefore some reasons to remain circumspect about the evidence for a causal relationship, but not especially strong reasons.
DISCUSSION AND CONCLUSIONS
The survey experiments described in this article suggest reasons why the public is so often hostile to what policy experts generally consider the most effective means of protecting the natural environment. Consistent with results from qualitative focus groups, the public’s hostility to environmental taxation appears to be due in large part to political distrust; people want new green taxes introduced in tandem with offsetting cuts to other taxes, but they do not believe governments when they promise to make such cuts.Footnote 79 Even in positive cases outside Britain, where a substantial new environmental tax has proven politically sustainable and the public has been accepting, there has been substantial scepticism about revenue neutrality (as for example in British Columbia).Footnote 80
Further research would benefit from exploring how the relationship between political trust and willingness to pay environmental taxes may differ across different kinds of political/cultural contexts – such as low- rather than high-trust societies. Britain is middling in this regard, among high-income nations. Especially given the hugely US-focused character of the literature, we need more systematic comparisons of cross-national differences. More broadly, we also need to know more about the effects of different kinds of framing, and how such framing relates to attitudes towards taxation generally.
If the results here have pointed to revenue neutrality as a potentially useful tool for making environmental taxes more acceptable to the public, the findings about the effects of hypothecation are more cautionary. Given that a number of other studies have found positive effects of earmarking green tax revenues for spending on environmental protection, it may be that the question wording used here was too vague. Other studies have investigated the impact of naming very specific forms of environmental protection to which revenues could be devoted; perhaps such specificity is important. Future experiments could investigate this possibility as well.
More broadly, this study implies the need for a shift in emphasis in existing definitions of political trust. Most of the literature on the consequences for public opinion defines political trust as people’s satisfaction with government performance. That definition de-emphasizes the importance of honesty and truthfulness and people’s perceptions of whether politicians and public administrations possess these kinds of integrity. The experiments here show that most Britons do not trust their government to do what it says. Supporters of the governing party, who are presumably more satisfied with the government’s actions, are just as sceptical as supporters of the opposition. Expectations about promise keeping, not just satisfaction with performance, can therefore shape public opinion about public policies. With respect to environmental taxes specifically, even if the public were more satisfied with government performance, that would not appear to be enough to build greater public acceptance. Instead, the results presented here suggest that advocates of green taxation would still need to overcome a deficit of public confidence in the trustworthiness of government promises.
Finally, the results presented in this article suggest that conventional measures of political trust do not perform as well as researchers might hope. Survey questions used to capture cynicism – itself only one facet of political trust – are not working to capture all of people’s cynicism. Even people who do not appear to be cynical, judging by the conventional measures, evidence substantial cynicism when revealing their true feelings about government promises.