INTRODUCTION
The space–time dynamics of phytoplankton populations has been widely investigated with a special focus on the impact of hydrological conditions on spatial distribution and succession patterns (e.g. Chang et al., Reference Chang, Zeldis, Gall and Hall2003; Badylak & Phlips, Reference Badylak and Phlips2004; Estrada et al., Reference Estrada, Henriksen, Gasol, Casamayor and Pedros-Alio2004, and references therein). Large diatoms (>30 μm) typically dominate phytoplankton spring blooms due to their high ability to use winter nutrient stocks and increasing irradiance (Harris, Reference Harris1978; Chang, Reference Chang1980). The late spring collapse of the diatom bloom coincides with decreasing nutrient levels and is followed by a drastic shift in phytoplankton composition towards pico- and nanophytoplankton (Sin et al., Reference Sin, Wetzel and Anderson2000; Tadonléké & Sime-Ngando, Reference Tadonléké and Sime-Ngando2000) and motile microphytoplankton cells (i.e. flagellates and dinoflagellates; Chang et al., Reference Chang, Zeldis, Gall and Hall2003; Bode et al., Reference Bode, Alvarez-Ossorio, Gonzalez, Lorenzo, Rodriguez, Varela and Varela2005) which prevail during the summer. This generally fuels the microbial loop and short-circuits the classical herbivorous food chain (Azam et al., Reference Azam, Fenchel, Field, Gray, Meyer-Reil and Thingstad1983), thus profoundly affecting the food-web structure. However, the qualitative and quantitative nature and the potential consequences of this shift have barely been investigated in most marine ecosystems. In particular, we are not aware of any study investigating the dynamics of species diversity and succession in relation to the wane of a nearly monospecific bloom occurring in hydrologically contrasted coastal waters.
In the coastal waters of the eastern English Channel, the phytoplankton spring bloom is characterized by the recurrent proliferation of Phaeocystis globosa (e.g. Seuront et al., Reference Seuront, Vincent and Mitchell2006). This algal species is known to form massive blooms in many environments, often resulting in a distortion of the pelagic ecosystem (Hamm, Reference Hamm2000). In the eastern English Channel, P. globosa blooms typically follow and precede two distinct diatom assemblages and abruptly collapse at the end of spring (Breton et al., Reference Breton, Brunet, Sautour and Brylinski2000; Seuront et al., Reference Seuront, Vincent and Mitchell2006). In the Southern Bight of the North Sea, where the phytoplankton spring bloom is also dominated by P. globosa (Lancelot et al., Reference Lancelot, Wassemann and Barth1994; Rousseau et al., Reference Rousseau, Vaulot, Casotti, Cariou, Lenz, Gunkel and Baumann1994; Lancelot, Reference Lancelot, Anderson, Cembella and Hallegraeff1998), similar spring phytoplankton community successions have been observed (Gieskes & Kraay, Reference Gieskes and Kraay1975; Cadée & Hegeman, Reference Cadée and Hegeman1986; Rousseau et al., Reference Rousseau, Leynaert, Daoud and Lancelot2002; Stelfox-Widdicombe et al., Reference Stelfox-Widdicombe, Archer, Burkill and Stefels2004). Phytoplankton seasonal production and its relation to nutrient cycles have previously been investigated in the eastern English Channel (Brunet et al., Reference Brunet, Brylinski and Frontier1992, Reference Brunet, Davoult and Casotti1996; Gentilhomme & Lizon, Reference Gentilhomme and Lizon1998; Breton et al., Reference Breton, Brunet, Sautour and Brylinski2000; Seuront et al., Reference Seuront, Vincent and Mitchell2006). However, to our knowledge, the size-structure and diversity of phytoplankton assemblages still need to be documented, especially in relation with the decline of the P. globosa spring bloom.
The objective of the present study was to provide further insights into the consequence of the P. globosa spring bloom on the dynamics of phytoplankton succession in the eastern English Channel. In particular, this area is characterized by strong hydrological inshore/offshore and north/south gradients respectively linked to: (i) the residual circulation of nearshore water masses parallel to the coast drifting from the English Channel to the North Sea; and (ii) to the significant decrease in riverine inputs from the Bay of Somme to the Strait of Dover. Under the hypothesis that different P. globosa bloom magnitude will be associated with distinct hydrological sub-systems, we investigated the temporal dynamics of phytoplankton composition, diversity and size-structure during the late phase (April–July) of a P. globosa bloom in the inshore and offshore waters of the Bay of Somme and the Strait of Dover.
MATERIALS AND METHODS
Study area
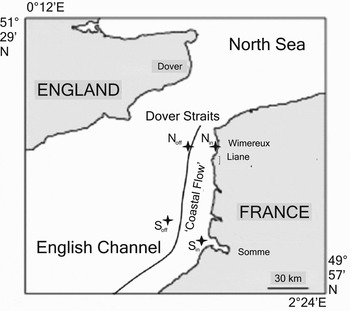
The eastern English Channel is characterized by a large tidal range, between 3 to 9 m. The tidal regime generates a residual circulation parallel to the coast, referred to as the ‘coastal flow’ (Brylinski et al., Reference Brylinski, Lagadeuc, Gentilhomme, Dupont, Lafite, Dupeuple, Huault, Auger, Puskaric, Wartel and Cabioch1991) with nearshore coastal waters drifting from the English Channel into the North Sea. This coastal flow generates a tidally controlled frontal zone (Brylinski & Lagadeuc, Reference Brylinski and Lagadeuc1990; Lagadeuc et al., Reference Lagadeuc, Brylinski and Aelbrecht1997) that separates inshore and offshore water masses. Inshore water masses are characterized by their low salinity, high turbidity, high phytoplankton richness (Brylinski et al., Reference Brylinski, Dupont and Bentley1984) and high productivity (Brunet et al., Reference Brunet, Brylinski and Frontier1992, Reference Brunet, Brylinski and Lemoine1993) compared to the oceanic offshore waters. The eastern English Channel is also hydrologically structured along a north/south gradient, in relation to the differential riverine inputs from the Bay of Somme to the Strait of Dover (Figure 1). The south of the eastern English Channel and the Bay of Somme are protected from the northerly winds and strongly influenced by high freshwater discharge from the Somme River (mean annual flow: 35 m3 s−1; Brylinski et al., Reference Brylinski, Dupont and Bentley1984) and its related nutrient enrichment. In contrast, the Strait of Dover is characterized by higher hydrodynamic conditions than the Bay of Somme related to its shallow waters and strong tidal currents (Seuront, Reference Seuront2005) and comparatively weakly influenced by the small run-off of the Liane and Wimereux rivers (mean annual flow: 0.6 and 0.1 m3 s−1, respectively; national data bank for hydrometry and hydrology of the French Ministry of the Environment; http://hydro.rnde.tm.fr/accueil.html).
Study area and location of the sampling stations ( ), Sin (50°48′N–1°34′E), Soff (50°48′N–1°27′8″E), Nin (50°14′39″N–1°26′47″E) and Noff (50°20′33″N–1°1′053″E).

Sampling strategy
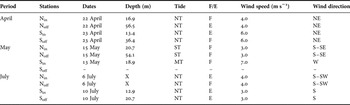
Three cruises were conducted in 2003 during late spring (22–23 April), early summer (13–15 May) and summer (6–10 July) aboard NO ‘Côtes de la Manche’ (CNRS, INSU). Two sampling areas, located in the northern and southern part of the eastern English Channel, were specifically chosen because of the significant differences in their physical and hydrological properties, especially their nutritive status which is likely to affect phytoplankton growth and hence phytoplankton stocks and composition. Inshore and offshore waters of each site were sampled over the same day and both sites were studied within 1 to 4 days (Table 1). No sampling was conducted in the southern offshore station in May (Table 1). Hereafter sampling stations are referred to as Ni and Si, where ‘N’ and ‘S’ are the north and south of the eastern English Channel, and the subscript ‘in’ and ‘off’ represent the sampling location, inshore and offshore respectively.
In situ conditions at the sampling periods: locations, dates, depths, tidal and wind conditions.

MT, mid-tide; ST, spring tide; NT, neap-tide; F, flood tide; E, ebb tide. (–) no sampling could be conducted due to weather conditions. X, data not available.
For each sampling date wind speed (m s−1) and direction were obtained from the Météo France Centre of Boulogne-sur-Mer. Temperature and salinity profiles were collected at each sampling station with a SBE 25 Sealogger CTD. Water samples for hydrological (nutrients) and biological parameters (chlorophyll-a, protists' biomass, standing stocks and composition) were taken from sub-surface (1 m) using 5-l Niskin bottles. Only sub-surface samples were considered because previous surveys conducted in the eastern English Channel showed the water column to be vertically well mixed (e.g. Gentilhomme & Lizon, Reference Gentilhomme and Lizon1998; Seuront et al., Reference Seuront, Vincent and Mitchell2006) in accordance with recent estimates of turbulent energy dissipation rates ranging from 10−7 to 10−4 m2 s−3 (Seuront, Reference Seuront2005). In addition, sub-surface sampling allowed to avoid any contamination of our samples by benthic and tychoplanktonic phytoplankton. The latter are resuspended in the bottom layer of the water column (Dupont et al., Reference Dupont, Lafite, Huault, Lamboy, Brylinski and Guéguéniat1991; Huaut et al., Reference Huault, Lafite and Dupont1994) and their proportion being highly variable at different time scales (Wolfstein et al., Reference Wolfstein, Colijn and Doerffer2000) and strongly depending on the energy dissipation rates of the environment (e.g. spring–neap cycle, season, wind stress; Grabemann & Krause, Reference Grabemann and Krause2001).
Nutrient analysis
For dissolved inorganic nutrients (NO2− NO3−, Si(OH)4, HPO42−) 10-ml water samples were immediately frozen (−20°C) after field collection, and analysed in the laboratory with an auto-analyser (Alliance Integral Futura) following standard protocols (Bendschneider & Robinson, Reference Bendschneider and Robinson1952; Mullin & Riley, Reference Mullin and Riley1955; Murphy & Riley, Reference Murphy and Riley1962; Woods et al., Reference Woods, Armstrong and Richards1967). Ammonium (NH4+) concentrations were determined manually in 100-ml water samples following Koroleff (Koroleff, Reference Koroleff1969).
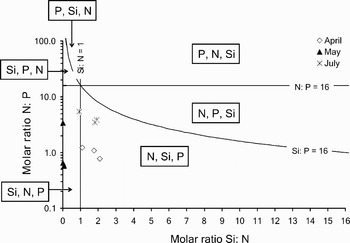
The potential limitation of phytoplankton growth by nutrient availability was investigated through the comparison between N:P:Si ratios of water masses and standard Redfield ratio (Redfield et al., Reference Redfield, Ketchum and Richards1963; Brzezinski, Reference Brzezinski1985). Data points obtained during the survey were plotted in a synthetic graph of Si:N:P molar ratios, where the conditions Si:N = 1, N:P = 16 and Si:P = 16 define 6 areas, each of them being characterized by the potentially limiting nutrient in order of priority.
Phytoplankton analysis
Water samples (200 to 1000-ml) were filtered through glass-fibre filters (Wahtman GF/C) and immediately frozen (−20°C) until analysis. Chlorophyll pigments were subsequently extracted in 5-ml of 90% acetone in the dark at 4°C during 24 hours, assayed in a spectrophotometer (UVIKON 940, Kontron instruments®) and Chl a concentrations calculated following UNESCO standard calculation (UNESCO, 1966).
The study of auto- and hetero/mixotrophic protists was carried out on organisms ranging in size from 5 to >200 μm. 100-ml water samples were fixed with acid Lugol solution (2% final concentration) and stored in the dark at 4 °C. In the laboratory, 10 to 20-ml sub-samples were settled for >24 h in Hydro-Bios counting chambers (Utermöhl, Reference Utermöhl1958). An average of 860 ± 250 cells was counted (Venrick, Reference Venrick and Sournia1978). Phytoplankton identification was performed by inverted microscopy under contrast illumination (e.g. Hasle et al., Reference Hasle, Syversten, Steidinger, Throndsen and Heimdal1997; Paulmier, Reference Paulmier1997) using a Leitz Diavert microscope (×200, ×400 and ×630). Cells were measured with an eyepiece micrometer and corresponding biovolumes were calculated by relating the shape of organisms to a standard geometric form (Hillebrand et al., Reference Hillebrand, Dürselen, Kirschtel, Pollingher and Zohary1999; Sun & Liu, Reference Sun and Liu2003). Biovolumes were converted to carbon biomass following Menden-Deuer & Lessard (Reference Menden-Deuer and Lessard2000) & Menden-Deuer et al. (Reference Menden-Deuer, Lessard and Satterberg2001). Phaeocystis globosa biomass was estimated from total cell counts (Van Rijssel et al., Reference Van Rijssel, Hamm and Gieskes1997). The year 2003 was characterized by an early and short-term P. globosa bloom which peaked in early March 2003 (Lamy et al., Reference Lamy, Artigas, Jauzein, Lizon and Cornille2006; Muylaert et al., Reference Muylaert, Gonzales, Franck, Lionard, Van der Zee, Cattrijsse, Sabbe, Chou and Vyverman2006) and disappeared rapidly by the end of April. Thus no or few colonies were observed in our samples. We therefore assumed that their contribution to carbon biomass was negligible. In addition, as P. globosa flagellate cells outnumbered other flagellate species throughout the survey (e.g. Chrysomonas and Cryptomonas) the latter were pooled in a common group hereafter referred to as PgF. The settlement method presented above (10 to 20-ml sub-samples) is not reliable for the quantitative study of ciliated protozoans. However, the observation of these organisms, namely Acineta sp., Tintinnids and Aloricate ciliates, allowed us to estimate their relative contribution to the protist pool. Some of the dinoflagellates counted during the survey (Gyrodinium sp. and Gyrodinium lachryma) appeared to be heterotrophic and cannot be thought of as phytoplankters sensu stricto. Subsequently and for the sake of simplicity they will be hereafter analysed separately from true phytoplankters.
Phytoplankton size-structure was studied through five major size-categories within which the smallest and largest forms were respectively dominated by Cryptophyta sp. and P. globosa (5 μm in length), and the diatoms Rhizosolenia setigera and Rhizosolenia imbricata (300–400 μm in length). Two different size-categories were set for nanophytoplankton (≤10 μm, 10–20 μm) and 3 for microphytoplankton (20–100 μm, 100–200 μm, >200 μm).
Data analysis
As the distribution of temperature and salinity data were significantly not normal, non-parametric statistics were used in this study. For each sampling period, multiple comparisons between the four sampling stations were conducted using the Kruskal–Wallis test (KW test hereafter). When the KW test identified a significant difference (P < 0.05), a post-hoc comparison, conceptually similar to the Tukey's HSD procedure (Zar, Reference Zar1996) was performed to identify significant differences.
Multivariate analysis was carried out to identify phytoplankton species assemblages and to describe their spatial and temporal variability. A factor analysis (Legendre & Legendre, Reference Legendre and Legendre1998) was applied to the whole data set of phytoplankton (38 taxa matrix) to assess the global distribution of phytoplankton communities within the four sub-systems.
Species richness (i.e. the number of different species in a given station at a given date, S), diversity (H′) and evenness (J′) were calculated on autotrophic protists following Shannon & Weaver (Reference Shannon and Weaver1963) and Pielou (Reference Pielou1966):
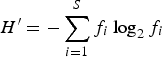

where f i is the relative frequency of species i in the sample. Potential changes in the structure of phytoplankton communities were further investigated through rank–frequency diagrams (RFDs; Frontier, Reference Frontier1976). This technique relies on plotting species frequencies against their ranks organized in decreasing order, and with both axes in logarithmic scale (Frontier, Reference Frontier1985; Legendre & Legendre, Reference Legendre and Legendre1998). Changes in the shape of the RFDs characterize temporal changes in the community structure (Frontier, Reference Frontier1985). More specifically, a linear–concave curve (or S-shaped curve) indicates the dominance of 1 or 2 species in a low species richness assemblage (stage 1, pioneer community). In contrast, a more convex shape among the first ranked species indicates a more even distribution among dominant species (stage 2, mature community), and a linear RFD is observed at the end of an ecological succession when the first ranked species become more dominant and the species richness is also lower (stage 3, senescent community). After a disturbance, few species can quickly develop (i.e. ‘r strategists’ and ‘opportunists’) and the RFD appears coarsely rectilinear with successive steps (stage 1', intermediate stage between stages 1 and 2; Frontier, Reference Frontier1985; Legendre & Legendre, Reference Legendre and Legendre1998). In addition, the occurrence of assemblages exhibiting the same diversity, evenness and RFD shape, was investigated by calculating the average distance between rank distributions. A distance is here defined as a quantitative measure of the difference in rank distribution of given species between 2 distinct samples. For a given phytoplankton species, (P1), the distance (d) between its rank in samples 1 and 2 can thus be given by (Seymour et al., Reference Seymour, Mitchell and Seuront2004):

where, r 1 (P 1) is the rank of species P 1 in sample 1 and r 2 (P 1) is the rank of the same species in sample 2. The total distance between the two samples, incorporating all phytoplankton species, (P i), is defined as the mean square root distance between the ranks of all common species (Seymour et al., Reference Seymour, Mitchell and Seuront2004):

where N is the total number of common species, (P i), observed in both samples. This quantification of distances between rank distributions was employed as an indication of differences in community structure between the four sampling sites over the survey period.
RESULTS
Physical environment
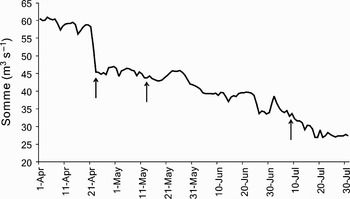
The study period was characterized by excess insulation (30% higher than the monthly mean insulation calculated over a decade) and punctual storm events in May and July (11–24 May; 16 July). The wind regime is congruent with Pingree & Griffiths (Reference Pingree and Griffiths1980) and Salomon & Breton (Reference Salomon and Breton1991), and was characterized by the dominance of south-westerly winds during much of the study period (May to July). April was characterized by north-eastern winds enhancing the continental influence on water masses. Wind speed did not show any specific pattern with values ranging from 3 to 7 m s−1 during May storm events (Table 1). After a sharp decrease from 58.2 to 45.4 m3 s−1 on 21 April, River Somme inputs followed a decreasing trend throughout the study period (from 60.5 to 27.3 m3 s−1) characterized by small fluctuations (±6 m3 s−1; Figure 2).
Daily Somme river inputs (m3 s−1) recorded on the study site from April to July 2003. Black arrows correspond to sampling periods.

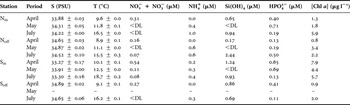
No vertical stratification was observed over the course of the survey. Vertically averaged salinity did not exhibit any temporal pattern, and slightly fluctuated between 33.27 ± 0.17 (Sin-April) and 34.89 ± 0.02 (Soff-April; Table 2). In contrast, vertically averaged temperature exhibited a clear seasonal cycle, increasing gradually from 8.9 ± 0.1°C (Noff-April) to 18.7 ± 0.2°C (Sin-July; Table 2). These temperature and salinity values were consistent with previous measurements performed at the seasonal scale in this area (Brunet et al., Reference Brunet, Brylinski and Frontier1992; Brylinski et al., Reference Brylinski, Brunet, Bentley, Thoumelin and Hilde1996; Breton et al., Reference Breton, Brunet, Sautour and Brylinski2000; Schapira, Reference Schapira2005; Seuront et al., Reference Seuront, Vincent and Mitchell2006).
Vertically averaged (±SE) salinity (S) and temperature (T). Nitrite + nitrate (NO2− + NO3−), ammonium (NH4+), silicic acid (Si(OH)4), phosphate (HPO42−) concentrations (μM) and chlorophyll-a ([Chl a]) surface concentrations (μg l−1) recorded on the sampling stations Nin, Noff, Sin and Soff during the survey. No data were available for Soff in May. DL, detection limit.

The four sampling stations exhibited significantly different temperatures and salinities (KW test; P < 0.05) over the study period. The highest temperatures (P < 0.001) and lowest salinities (P < 0.001) were recorded in Sin throughout the survey. Although the influence of riverine inputs is less important in the Strait of Dover, coastal water masses (N1) were consistently significantly different (higher temperature and lower salinity; P < 0.001) from the offshore ones. No significant differences were observed between Noff and Soff in terms of temperature and salinity.
Chemical environment
The highest NO2− + NO3− concentrations were recorded in April and ranged from 0.16 to 0.31 μM and from 0.27 to 0.54 μM in the Strait of Dover and the Bay of Somme, respectively (Table 2). Concentrations then decreased to levels close to the detection limit, i.e. <0.05 μM, in July. Ammonium concentrations were always lower than 1 μM, but increased gradually from April to July (Table 2). Si(OH)4 concentrations always remained lower than 2.5 μM and decreased below the detection limit from April to May in all locations. They subsequently increased in July and ranged between 0.94 and 2.44 μM in the Strait of Dover and between 0.69 and 0.93 μM in the Bay of Somme. HPO42− concentrations remained lower than 0.8 μM and did not exhibit any specific pattern throughout the sampling period. The lowest concentrations were recorded in July in the Bay of Somme with 0.13 and 0.11 μM in inshore (Sin) and offshore (Soff) waters, respectively. The highest concentrations were observed in coastal waters Sin (0.69 μM) and Nin (0.71 μM) in May.
Molar ratios for silicic acid, DIN (NO2− + NO3− + NH4+) and phosphate (Figure 3) showed distinct patterns of potential nutrient limitation during each sampling cruise. In April, DIN was the potentially limiting nutrient in the whole area, followed by silicate (Si:P ratios: 1.3–2.1). In May, the decrease in Si:N ratios (values close to 0) and the low N:P ratios (0.6–3.0) illustrated a potential limitation of primary production by Si(OH)4 and DIN. As observed in April, both DIN and silicate were potentially limiting summer phytoplankton growth although higher N:P and Si:P ratios observed at that time indicated a potentially weaker summer limitation.
Si:N:P molar ratios in April (◊), May (▴) and July (★). In each area delimited by the Brzezinski (Reference Brzezinski1985) ratio and the Redfield et al. (Reference Redfield, Ketchum and Richards1963) ratio (Si:N:P = 16:16:1), the potential limiting nutrients are reported in order of priority. No data were available for Soff in May.

Phytoplankton standing stocks
Chl a concentrations were highly variable between sites in April and May, ranging from 0.8 μg l−1 in Noff to 7.9 μg l−1 in Sin in April, and from 1.8 μg l−1 in Nin to 4.4 μg l−1 in Sin in May (Table 2). However, in July, inshore water masses exhibited similar concentrations reaching 5.9 μg l−1 in Nin and 5.7 μg l−1 in Sin. In offshore waters a 2-fold decrease in Chl a concentrations was observed with 2.0 μg l−1 in Soff and 2.2 μg l−1 in Noff.
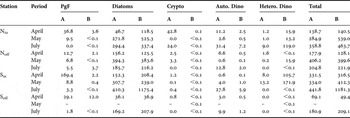
Thirty-eight taxa were identified throughout the survey and distributed in four taxonomic classes: diatoms (28), dinoflagellates (8), cryptophyceans (1) and prymnesiophyceans (1). Total phytoplankton abundance and biomass ranged from 69.1 × 10³ to 441.8 × 10³ cell l−1 and from 49.4 to 1181.3 μgC l−1, respectively (Table 3). However, no common temporal pattern could be identified for the four sampling stations. Diatoms constituted the bulk of phytoplankton assemblages (34–97% of total abundance) with abundance ranging between 36.1 × 10³ and 410.3 × 10³ cell l−1 and relative biomass accounting for 58 to 99% of total phytoplankton carbon. Although PgF was the second dominant group ranging between 0.0 and 169.4 × 10³ cell l−1 (i.e. <1 to 51.1% of total abundance), these small sized cells only had a small and punctual contribution to total carbon biomass (<1–25%). Microscopic observations only revealed few colonial stages and most of P. globosa cells were at that time isolated flagellate cells. In addition, qualitative observation of ciliated protozoans showed an increase in total ciliates per sample in April, and coincided with the end of the P. globosa bloom. Despite their poor contribution to total phytoplankton carbon (≤0.1 μgC l−1), cryptophyceans were numerically the third dominant group with abundance values of 0.0 to 42.8 × 10³ cell l−1 (i.e. <1 to 31% of total abundance). Dinoflagellates were far the least abundant with values ranging between 0.8 × 10³ and 40.4 × 10³ cell l−1, representing only 1 to 11% of total phytoplankton abundance (Table 3). Two heterotrophic forms of dinoflagellates were observed, Gyrodinium sp. and G. lachryma. Both forms were particularly abundant in Sin, reaching 8.0 × 10³ and 13.2 × 10³ cell l−1 in April and May, respectively. Due to their large size, G. lachryma (160 μm) and other heterotrophic dinoflagellates (60 μm) accounted for 33 and 42% of total carbon biomass during these periods.
Abundance ‘A’ (103 cell l−1) and biomass ‘B’ (μg C l−1) of major auto- and hetero/mixotrophic protists identified from Lugol's iodine-preserved samples collected on the four sampling stations Nin, Noff, Sin and Soff during the survey. No data were available for Soff in May.

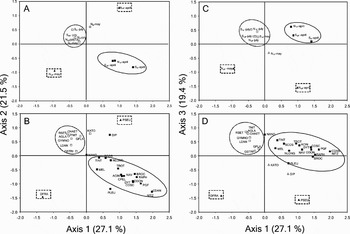
The first three axes of the factor analysis described 68.1% of the total inertia (the fourth axis only explained 9% of the total inertia) and the distribution of species (Figure 4B, D) and stations (Figure 4A, C) showed the space–time dynamic of phytoplankton assemblages over the survey. The first two axes showed the succession of two characteristic phytoplankton assemblages as well as a strong spatial heterogeneity in late spring (Figure 4A, B). The first axis was structured by the opposition between the stations sampled in April characterized by PgF (37% of total inertia) along with small diatoms (e.g. Melosira sp., Diploneis sp. and N. transitans) and the stations sampled in May and July characterized by large diatoms (G. striata and R. setigera). The second axis was mainly driven by the opposition between Noff-April and Noff-May (25% and 18% of total inertia, respectively) characterized by P. pseudodelicatessima (28%) and D. fragilissimus (32%), respectively. The third axis was mainly structured by the opposition between Noff-April and Noff-May exhibiting specific assemblages and stations showing characteristic spring/summer assemblages (Figure 4C, D). The factor analysis thus highlighted a strong heterogeneity of phytoplankton assemblages in late spring (April) evolving towards a common pattern in early summer (July).
Results of the factorial correspondence analysis conducted on phytoplankton taxa. Observations (stations) and variables (phytoplankton taxa; see Table 4 for details of the species codes) are presented separately. The plan on the first 3 axes described 68.1% of the total inertia. Projections of observations (A) and variables (B) in the two-dimensional plan defined by axes 1 and 2. Projections of observations (C) and variables (D) in the two-dimensional plan defined by axes 1 and 3. (█) Characteristic spring (April) and (□) summer (May/July) community. Specific taxa of Noff -April and Noff -May (▴).

Phytoplankton size spectra and composition
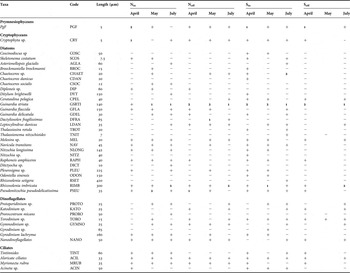
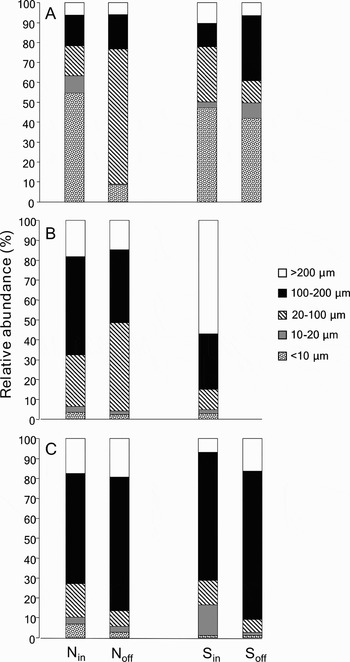
April showed the strongest heterogeneity between northern and southern waters as well as between inshore and offshore waters (Figures 4A, C & 5A). With the exception of Noff, small nanophytoplankton (<10 μm, PgF and cryptophyceans, Table 4) outnumbered phytoplankton taxa and represented 42 to 55% of total abundance. 20–100 μm microphytoplankters were the second dominant group (15–68%) comprising the potentially toxic diatom P. pseudodelicatissima in Noff (112.4 × 10³ cell l−1; 63% relative abundance) and Melosira sp., Diploneis sp. and N. transitans in the three other locations (0.2–12.7 × 10³ cell l−1). Larger diatoms (100–200 μm) were responsible for the spatial heterogeneity observed in southern waters. Sin was characterized by a typical shallow coastal assemblage dominated by G. striata and accompanied by C. pelagica, R. amphiceros and N. longissima (Table 4). In contrast, Soff had a more neritic pattern as G. striata was accompanied here by the large centric chain forming diatoms D. brightwelli and O. sinensis (100–200 μm; Table 4).
Code (used to identify species in factorial correspondence analysis), length (μm), presence (+)/absence (−), first (1)/secondary (2) dominant phytoplankton taxa identified from Lugol's iodine-preserved samples collected on the four sampling stations Nin, Noff, Sin and Soff during the survey. No data were available for Soff in May.

April to May transition was marked by a strong change in phytoplankton assemblages (Figure 4) characterized by a decrease in nanophytoplankton abundance (<6%) and an increase in the 20–100 μm (10–44%) and larger size fractions (100–200 μm and >200 μm; 15–57%; Figure 5B). Gyrodinium striata still dominated phytoplankton assemblages and was associated either to D. fragilissimus offshore (Noff) or P. pseudodelicatissima and G. delicatula inshore (Nin). Southern waters of the Bay of Somme (Sin) were characterized by the dominance of large diatoms (>200 μm; 57% of total phytoplankton), particularly R. imbricata. Intermediate (L. danicus) and large sized diatoms (G. striata and O. sinensis) identical to those observed in the north were also present (Table 4; Figure 4B, D).
Summer phytoplankton assemblages distribution and composition were relatively homogeneous (Figure 6) and dominated by large sized cells (100–200 μm and >200 μm), in particular G. striata (55–75%) and R. imbricata (17–19%; Table 4; Figure 5C). These two diatoms coexisted with intermediate sized diatoms (G. delicatula and L. danicus) and nanophytoplankton taxa such as cryptophyceans and small unidentified dinoflagellates. While this pattern of distribution was common to all locations, the 10–20 μm size fraction and particularly the small Chaetoceros sp. showed a markedly high contribution (16%) to the summer phytoplankton composition of Station Sin (Table 4; Figure 4B, D).
Time course evolution of relative phytoplankton abundance (%) on the four sampling stations (Nin, Noff, Sin and Soff) in April (A), May (B) and July (C), through five major size-categories: ≤10 μm, 10–20 μm, 20–100 μm, 100–200 μm, >200 μm. No data were available for Soff in May.

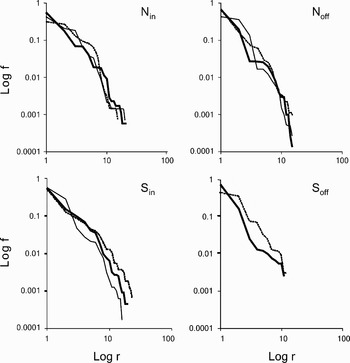
Rank–frequency diagrams of phytoplankton species for the four sampling stations (Nin, Noff, Sin and Soff) in April (dotted line), May (continuous line) and July (bold line). No data were available for Soff in May.

Phytoplankton diversity
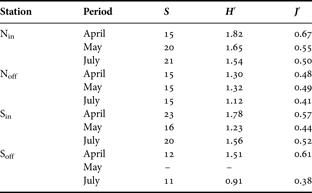
Phytoplankton diversity (H′) and evenness (J′) ranged from 0.91 (Soff-July) to 1.82 (Nin-April) and from 0.38 (Soff-July) to 0.67 (Nin-April), respectively. With the exception of Station Sin, both indices followed a decreasing temporal pattern during the spring to summer transition (Table 5).
Species richness (S), diversity index (H′) and evenness (J′) of phytoplankton community, on the four sampling stations Nin, Noff, Sin and Soff during the survey. No data were available for Soff in May.
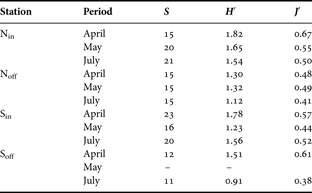
Both temporal changes and spatial variability in the structure of phytoplankton assemblages clearly appeared on RFD diagrams (Figure 6). In April, RFDs exhibited distinct shape within each studied station highlighting the strong spatial heterogeneity of phytoplankton assemblages at the end of the P. globosa bloom (Figure 6). RFDs of northern coastal (Nin) and southern offshore (Soff) assemblages exhibited convex shapes over the first ranks. This indicated an even distribution of individuals among dominant species with high diversity index (1.51–1.82) and evenness (0.61–0.67) despite rather low species richness (12–15). In contrast, the RFDs in Noff and Sin respectively showed the dominance of P. pseudodelicatissima and P. globosa. This was related to lower diversity (1.30 to 1.78), lower evenness (0.48–0.57) and higher richness (15–23). From May to July, the structure of the phytoplankton assemblages evolved via intermediate distinct stages towards a similar RFD pattern, illustrating a shift in phytoplankton assemblage structure from four distinct spring structures to a common late spring–summer composition. In particular, the shape of the four RFDs illustrated the dominance of G. striata related to lower diversity and evenness in the entire area compared to April. In coastal waters (Nin and Sin), July RFDs were also characterized by a series of successive steps illustrating the presence of a more diversified diatom community (H′: 1.54–1.56; S′: 20–21) in inshore waters compared to offshore ones (H′: 0.91–1.12; S′:11–15).
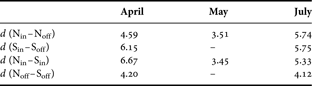
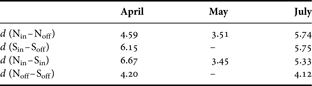
Distances values (d) identified strong differences in the rank structure of phytoplankton assemblages between sampling sites throughout the survey (Table 6). In April, the highest distance was observed between Nin and Sin (d = 6.67), revealing distinct rank distribution among common species between northern and southern coastal assemblages. In contrast, the lowest d value was observed between Noff and Soff (d = 4.20), illustrating a more common pattern between offshore assemblages. In July, with the exception of the value calculated between Noff and Soff (d = 4.12) distances were relatively high between sampling sites (5.33–5.75) showing strong differences among common species distribution. The highest d values were observed between inshore and offshore assemblages on both studied zones, 5.74 in the Strait of Dover and 5.75 in the Bay of Somme (Table 6).
Distance (d) between rank distributions of phytoplankton species identified on 2 distinct sampling sites during the survey. d(Nin–Noff) and d(Sin–Soff): distances between inshore and offshore waters within the same studied site; d(Nin–Sin) and d(Noff–Soff): distances between inshore/offshore waters of both studied sites. No data were available for Soff in May.
DISCUSSION
Phytoplankton succession during the wane of a P. globosa bloom
The Chl a concentrations (<8 μg l−1), P. globosa abundance (16.9 × 10⁴ cell l−1) and its contribution to phytoplankton biomass (<25%) were low when compared to previous observation in the eastern English Channel in spring bloom conditions; i.e. Chl a = 60 μg l−1, abundance = 106−107 cell l−1 and 80% of total phytoplankton biomass (Breton et al., Reference Breton, Brunet, Sautour and Brylinski2000; Seuront et al., Reference Seuront, Vincent and Mitchell2006). The year 2003 was characterized by an early and short-term P. globosa bloom which peaked in early March 2003 (Lamy et al., Reference Lamy, Artigas, Jauzein, Lizon and Cornille2006; Muylaert et al., Reference Muylaert, Gonzales, Franck, Lionard, Van der Zee, Cattrijsse, Sabbe, Chou and Vyverman2006) and disappeared rapidly by the end of April. This suggests, together with previous observations conducted in the Southern Bight of the North Sea (Lancelot, Reference Lancelot1995; Rousseau et al., Reference Rousseau, Leynaert, Daoud and Lancelot2002; Tungaraza et al., Reference Tungaraza, Rousseau, Brion, Lancelot, Gichuki, Baeyens and Goeyens2003), that our April sampling occurred at the end of the P. globosa bloom. Microscopic observations also showed the development of hetero/mixotrophic ciliated protozoans within the samples, suggesting the existence of a potentially active microbial loop.
The main features of the wane of the P. globosa bloom observed during this survey are the occurrence of two consecutive diatom assemblages respectively dominated by: (i) small colonial species (<100 μm; namely Melosira sp., Diploneis sp. and N. transitans) co-occurring with P. globosa in April; and (ii) large fine-walled species (>200 μm; G. striata and R. imbricata) in May and July (Table 4; Figure 5). Similar patterns of diatom succession have been previously reported at the seasonal scale in the eastern English Channel (Breton et al., Reference Breton, Brunet, Sautour and Brylinski2000; Seuront et al., Reference Seuront, Vincent and Mitchell2006) and the coastal waters of the North Sea (Gieskes & Kraay, Reference Gieskes and Kraay1975; Cadée & Hegeman, Reference Cadée and Hegeman1986; Rousseau et al., Reference Rousseau, Becquevort, Parent, Gasparini, Daro, Tackx and Lancelot2000, Reference Rousseau, Leynaert, Daoud and Lancelot2002; Tungaraza et al., Reference Tungaraza, Rousseau, Brion, Lancelot, Gichuki, Baeyens and Goeyens2003; Stelfox-Widdicombe et al., Reference Stelfox-Widdicombe, Archer, Burkill and Stefels2004; Muylaert et al., Reference Muylaert, Gonzales, Franck, Lionard, Van der Zee, Cattrijsse, Sabbe, Chou and Vyverman2006). The key feature of these two consecutive diatom assemblages relies on their different nutrient conditions (Table 2) and the related potential nutrient limitation (Figure 3).
The assemblage of small diatoms co-occurring with P. globosa in April was potentially limited by nitrate. This is congruent with previous hydrological surveys conducted in the eastern English Channel showing nitrate depletion during the late phase of the P. globosa bloom (Brunet et al., Reference Brunet, Brylinski and Frontier1992; Gentilhomme & Lizon, Reference Gentilhomme and Lizon1998). This may have favoured the development of small cells over larger forms in accordance with theoretical (Irwin et al., Reference Irwin, Finkel, Schofield and Falkowski2006) and field observations (Chisholm, Reference Chisholm, Falkowski and Woodhead1992; Li, Reference Li2002). Resource limitation has been shown to alter size scaling metabolic rates, resulting in a decrease in the size scaling exponent (Finkel, Reference Finkel2001; Finkel et al., Reference Finkel, Irwin and Schofield2004). Several other factors may, however, have also contributed to the observed size structure of the diatom community in April, e.g. size dependent grazing (Armstrong, Reference Armstrong2003), particles sinking and coagulation dynamics (Burd & Jackson, Reference Burd and Jackson2002; Stemman et al., Reference Stemmann, Jackson and Ianson2004), size dependent physiological strategies such as surge uptake or storage capacities (Stolte et al., Reference Stolte, McCollin, Noordeloos and Riegman1994; Stolte & Riegman, Reference Stolte and Riegman1995).
The growth of the small chain-forming diatoms in April is also likely to lead to a potential silicic acid limitation through silicate depletion in May. This is consistent with the observed shift towards larger fine-walled diatoms (e.g. G. striata and R. imbricata), known to have lower silicate requirements (0.05 ≤ Si:C ≤ 0.10) than the small diatoms (0.17 ≤ Si:C ≤ 0.30) co-occurring with the P. globosa during spring in the North Sea (Rousseau et al., Reference Rousseau, Leynaert, Daoud and Lancelot2002). These genera appear to be particularly well adapted to low silicate concentrations as they have been reported to form large blooms in different coastal areas under silicate limitation (Sournia, et al., Reference Sournia, Birrien, Douvillé, Klein and Viollier1987; Del Amo et al., Reference Del Amo, Le Pape, Tréguer, Quéguiner, Ménesguen and Aminot1997a, Reference Del Amo, Quéguiner, Tréguer, Breton and Lampertb; Rousseau et al., Reference Rousseau, Leynaert, Daoud and Lancelot2002).
Finally, the increase in nutrient concentrations observed between May and July allowed the growth of the second diatom assemblage, leading to the relatively high phytoplankton biomass observed in coastal waters in July (Table 2). The increase in nutrient concentrations observed in July might be related to a combination of: (i) run-off inputs following rainfall events; (ii) high remineralization processes following the wane of the P. globosa bloom; (iii) sedimentary mineralization of silicate (Del-Amo et al., 1997b), phosphate (Auby et al., Reference Auby, Trut, D'Amico and Beliaeff1999) and nitrogen (Riou, Reference Riou1999); or (iv) zooplankton excretion (Le Borgne, Reference Le Borgne, Corner and O'Hara1986).
From distinct spring structures to a common summer pattern
The eastern English Channel is characterized by two hydrological systems located in the Strait of Dover and the Bay of Somme, the former and the latter including hydrologically distinct inshore and offshore water masses (Table 2; Brylinski et al., Reference Brylinski, Lagadeuc, Gentilhomme, Dupont, Lafite, Dupeuple, Huault, Auger, Puskaric, Wartel and Cabioch1991). Whilst these hydrological differences were clearly observed throughout the survey, phytoplankton assemblages only exhibited a strong spatial heterogeneity in April, and evolved towards a relative homogeneous structure in July.
Specific phytoplankton communities were identified in April in each of the four investigated water masses. This spatial heterogeneity led to a strong community gradient in terms of abundance, composition and distribution (Tables 3–4; Figures 4–6). In particular, P. globosa and flagellates dominated the community in Sin, but occurred in very low abundance in Noff, while co-dominance with either cryptophyceans or the diatom G. striata was observed in Nin and Soff, respectively. The control of P. globosa blooms magnitude by nitrate remaining after the early diatom bloom (Lancelot, Reference Lancelot1995; Lancelot et al., 1998) and the relatively high nitrate concentrations recorded when P. globosa dominated the phytoplankton pool (0.54 μM; Table 2) suggest that differential nitrate concentrations could have driven the observed spatial patterns. Alternatively, limited nutrient supplies as well as strong turbulent conditions prevailing in the Strait of Dover (Seuront, Reference Seuront2005; Seuront & Schmitt, Reference Seuront and Schmitt2005) may have supported cryptophycean growth, which are typical ‘stress-tolerant’ species (Margalef, Reference Margalef and Buzzati-Traverso1958) and known to occur after disturbances (Barbiero et al., Reference Barbiero, James and Barko1999). In addition, high distances between rank distributions among common species revealed that this spatial heterogeneity was not only restricted to dominant species. This spatial heterogeneity illustrates the concept of life forms adaptation to specific pelagic habitats (i.e. ecological niches) defined along gradients of turbulence intensity and nutrient concentrations (Margalef, Reference Margalef1978; Cullen et al., Reference Cullen, Franks, Karl, Longhurst, Robinson, McCarthy and Rothschild2002). Within a given location, phytoplankton assemblages are thus dominated and composed of species that are best adapted to the local environmental forcing.
In contrast, early summer was characterized by the dominance of ‘generalist’ taxa (sensu Margalef, Reference Margalef1978), G. striata and R. imbricata. These taxa are intrinsically not constrained to defined niches and therefore dominated phytoplankton assemblages in the whole area. The high distances observed between rank organizations nevertheless suggest a strong heterogeneity among small (<100 μm) secondary species distribution, particularly between inshore and offshore waters. The co-existence of large and small diatoms within a given phytoplankton assemblage is not rare (Dupuy et al., Reference Dupuy, Vaquer, Lam-Hoai, Rougier, Mazouni, Lautier, Collos and Le Gall2000; Vincent et al., Reference Vincent, Luczak and Sautour2002) and often results from punctual nutrient inputs following climatic events (e.g. stormy events; Vincent et al., Reference Vincent, Luczak and Sautour2002) as observed in May and July. Local hydrological properties prevailing in each area may thus have led to the establishment of specific small secondary species as illustrated by the small Chaetoceros sp. and dinoflagellates restricted to the warmer waters of the Bay of Somme in July.
From mature/senescent communities to a pioneer community
The shape of the RFDs, and more specifically their changes in space and/or time, reveals the degree of organization and complexity of the ecosystem and thus is related to its degree of maturity. At the end of the P. globosa bloom (April), the shape of the RFDs obtained in Nin and Soff indicated an even distribution of individuals among dominant species which is characteristic of mature assemblages (Frontier, Reference Frontier1985). The RFDs obtained in Sin and Noff exhibited a more rectilinear shape, suggesting a senescent stage of the community. This is expected at the end of an ecological succession, when one species (here P. globosa in Sin/P. pseudodelicatessima in Noff) is in exceptionally favourable conditions and escapes the demographic control exerted by others (Frontier, Reference Frontier1985). The April mature/senescent communities were followed by the establishment of a pioneer community characterized by the generalist taxa G. striata and R. imbricata. This is illustrated by a decrease in diversity and evenness as well as the vertical shape of RFDs observed on the entire area in July. This kind of community typically occurs after disturbances or fast changes of the environment (Frontier, Reference Frontier1985).
The P. globosa bloom may have induced strong changes in the pelagic environment leading to a new colonization, after the loss of some of the previous sets of species (Frontier, Reference Frontier1985). After a transition stage (May), a few species (G. striata and R. imbricata) may have imposed their dominance through their highest tolerance to the more drastic conditions (i.e. silicate limitation) prevailing on the entire studied area after the collapse of the bloom. Although nutrients concentration is often considered as a key factor controlling phytoplankton succession and species success (Rees et al., Reference Rees, Joint and Donald1999), nutritive status alone is not a totally satisfactory explanation for the observed evolution of phytoplankton assemblages. During our survey, micro- and mesozooplankton consumers may have also played a pivotal role in controlling phytoplankton diversity through grazing and nutrient regeneration. Various critical processes shaping the structure and function of the microbial loop developed in April (e.g. excretion and bacterial degradation) may have led to massive and local inorganic nitrogen release (particularly NH4+). The nutrient enrichment related to high grazing activity within the microbial loop (Stelfox-Widdicombe et al., Reference Stelfox-Widdicombe, Archer, Burkill and Stefels2004) and lagged time response of metazoan consumers (Malone, Reference Malone, Smith, Leffler and Mackiernan1992), may also have enhanced large-diatom production in early summer as previously shown by Duarte et al. (Reference Duarte, Agusti and Kalff2000). Finally, the accumulation of dissolved polymeric materials during the collapse of the P. globosa bloom, believed to induce foam formation in the surf zone (Lancelot, Reference Lancelot1987; Rousseau, Reference Rousseau2000; Peperzak, Reference Peperzak2002), may have influenced phytoplankton diversity. In the coastal waters of the Bay of Somme (Sin) where highest densities of P. globosa were recorded in April, species richness strongly decreased between April and May (from 23 to 16). While highly speculative, it is suggested that this may be related to the loss of biomass entrained within the foam following the release of dissolved polymeric materials by senescent colonies (Seuront et al., Reference Seuront, Vincent and Mitchell2006). The decrease in competition following this non-negligible loss of phytoplankton population, may then have allowed remaining species such as R. imbricata and G. striata to grow quickly and thus colonize this new environment.
Concluding remarks
Previous studies have investigated the seasonal succession of phytoplankton communities in the eastern English Channel (Breton et al., Reference Breton, Brunet, Sautour and Brylinski2000; Seuront et al., Reference Seuront, Vincent and Mitchell2006) and the North Sea (Rousseau et al., Reference Rousseau, Leynaert, Daoud and Lancelot2002). We specifically focused here on the collapse of the P. globosa bloom and followed the evolution of phytoplankton assemblages in four distinct hydrological sub-systems. Specific phytoplankton assemblages identified in distinct water masses during the late phase of the bloom (April), have evolved from a mature/senescent community towards a relatively homogeneous summer structure. This suggests the establishment of a pioneer community on the entire studied area as a result of complex interactions between different hydrological and biological processes. In particular, low silicic acid is suggested to be an essential factor favouring the establishment of a summer pioneer community dominated by large fine-walled diatoms (G. striata and R. imbricata). Although the same evolution was observed over the entire study area, suggesting similar dynamics in distinct hydrological sub-systems, the magnitude of the observed patterns is intrinsically related to the hydrological properties prevailing in each sub-system.
Finally, it is stressed that additional field and laboratory experiments are still needed: (i) to assess the role played by micro- and mesozooplankton consumers; and (ii) to confirm the potential effect of foam formation following the wane of a P. globosa bloom on the seasonal evolution of phytoplankton assemblages in the eastern English Channel. As the pathways and efficiencies of energy transfer from primary producers to consumers and ultimately the production of higher trophic levels are determined by phytoplankton composition (Cloern & Dufford, Reference Cloern and Dufford2005), the establishment of a poorly diversified pioneer community following the wane of a P. globosa bloom may have strong consequences on food web dynamics and the carbon cycle in coastal ecosystems. The genus Phaeocystis may thus play a key role in the ocean–atmosphere transfers especially considering this occurrence in very contrasted marine systems from the northern (Lancelot, Reference Lancelot, Anderson, Cembella and Hallegraeff1998) to the southern hemisphere (LeRoi & Hallegraeff, Reference LeRoi and Hallegraeff2006).
ACKNOWLEDGEMENTS
We thank the captain and the crew of the NO ‘Côtes de la Manche’ for their assistance during the survey. E. Lecuyer is acknowledged for his contribution to the sampling survey. The authors thank 2 anonymous referees for their constructive criticisms and comments on an earlier version of this work. This work has been financially and infrastructurally supported by the CPER ‘Phaeocystis’, PNEC ‘Chantier Manche Orientale-sud Mer du Nord’, the Centre National de la Recherche Scientifique (CNRS), the Université des Sciences et Technologies de Lille (France), Flinders University (Australia) and the Australian Research Council.