I. INTRODUCTION
β-Ca3(PO4)2-type phosphates and vanadates [Me′8 Me″R(EO4)7 and Сa9 MeM(EO4)7 (E = P and V; R = rare earths, Y3+, Sc3+, and Al3+; Me′ = Ca2+ and Sr2+; Me″ = Ca2+, Sr2+, Mg2+, Ni2+, Cd2+, and Zn2+; M = Li+, Na+, and K+)] were found to be promising as LED (Huang et al., Reference Huang, Jiang, Cao, Shi and Seo2009; Du et al., Reference Du, Nakai, Tsuboi, Huang and Seo2011; Huang and Chen, Reference Huang and Chen2011; Ji et al., Reference Ji, Huang, Xia, Molokeev and Atuchin2014) and non-linear optical materials (Chen et al., Reference Chen, Zhuang, Hu, Zhuang and Chen2007; Lin et al., Reference Lin, Yuan, Sun, Zhao, Zhang, Huang and Wang2013; Loiko et al., Reference Loiko, Yasukevich, Gulevich, Demesh, Kosmyna, Nazarenko, Puzikov, Shekhovtsov, Kornienko, Dunina, Kuleshov and Yumashev2013; Sun et al., Reference Sun, Lin, Zhang, Huang and Wang2013) and also shows anti-ferroelectric properties (Deyneko et al., Reference Deyneko, Morozov, Stefanovich, Belik, Lazoryak and Lebedev2016).
β-Ca3(PO4)2 (space group R3c, Z = 21, or Ca10.5(PO4)7 with Z = 6) (Dickens et al., Reference Dickens, Schroeder and Brown1974; Henning et al., Reference Henning, Adolfsson and Grins2000; Yashima et al., Reference Yashima, Sakai, Kamiyama and Hoshikawa2003) belongs to the family of mineral-whitlockite-related materials [whitlockite – Ca18.19(Mg1.17Fe0.83)H1.62(PO4)14] (Calvo and Gopal, Reference Calvo and Gopal1975). The β-Ca3(PO4)2-type structure consists of isolated PO4 tetrahedra that connect the MO n polyhedra into a three-dimensional framework via common vertices.
Size variations of the CaO n polyhedra in the β-Ca3(PO4)2 structure allow a large variety of isovalent and aliovalent substitutions for Ca2+ cations. Depending on the ionic radius, replacing cations substitute for Ca2+ in different sites. In particular, rare earths cations are distributed very similarly among the M1–M5 sites in Сa9 R(PO4)7 (Bessiere et al., Reference Bessiere, Benhamou, Wallez, Lecointre and Viana2012).
Recently we have studied the formation of Ca9.5−x Pb x Me(PO4)7 (Me = Ca2+, Mg2+, Zn2+, and Cd2+) and Ca9−x Pb x R(PO4)7 (R = Sc3+, Cr3+, Fe3+, Ga3+, and In3+) solid solutions (0 ≤ x ≤ 1.5) and clarified the influence of the substitution of Ca2+ by Pb2+ on the structure, non-linear optical properties, temperature, and types of phase transitions (Deineko et al., Reference Deineko, Stefanovich, Mosunov, Baryshnikova and Lazoryak2013; Deyneko et al., Reference Deyneko, Stefanovich, Mosunov, Baryshnikova and Lazoryak2013). The introduction of larger Pb2+ cations with a lone electron pair and high electronic polarizability into a Сa9Eu(PO4)7 phosphor could cause changes in the Eu3+ distribution among different sites and, as a result, modify its luminescent properties (Deyneko et al., Reference Deyneko, Morozov, Hadermann, Savon, Spassky, Stefanovich, Belik and Lazoryak2015).
Therefore, in this work, we performed detailed studies of structural and non-linear optical Ca9 −x Pb x Ho(PO4)7 (0 ≤ x ≤ 1) phosphors.
II. EXPERIMENTAL
A. Sample preparation
The new phosphates Ca9 −x Pb x Ho(PO4)7 were synthesized by solid-state reaction from stoichiometric amounts of Ho2O3, CaCO3, CaHPO4·2H2O, and PbO at 1223–1273 K for 120 h. The mixture was heated progressively with intermittent grinding at 473 K (12 h), 773 K (12 h), 973 K (12 h), 1173 K (24 h) and 1253, 1233, 1213 K (24 h) (for x = 0.2, 0.5, and 1, respectively) in air atmosphere. All solid solutions were checked for absence of impurity phases. It was found that compounds with x > 1 were not single phase.
B. Powder diffraction data collection and reduction
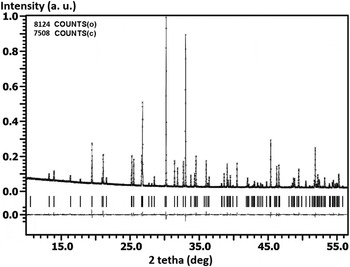
The room temperature PXRD (powder X-ray diffraction) patterns of the Ca9 −x Pb x Ho(PO4)7 were collected on a Termo ARL diffractometer (CuK α1+α2 radiation, reflection geometry, angular range 2θ = 5°–85°, scan step of 0.02. The experimental powder diffraction pattern is shown in Figure 1. The main details of the data collection are given in Table I. To determine the lattice parameters, Le Bail decomposition (Le Bail et al., Reference Le Bail, Duroy and Fourquet1988) was applied using the JANA2006 software (Dusek et al., Reference Dusek, Petrícek, Wunschel, Dinnebier and Van Smaalen2001; Petrícek et al., Reference Petricek, Dusek and Palatinus2014). Initially, the structure refined by the Rietveld method carried out starting from data (Yashima et al., Reference Yashima, Sakai, Kamiyama and Hoshikawa2003). Further, the population of the cation positions was refined. Phase analysis revealed that single-phase solid solutions exist up to x = 1.
Rietveld plot for Ca8.5Pb0.5Ho(PO4)7 observed (crosses), calculated (solid) and angular positions of possible Bragg reflections (bars). Lower plot: (I c–I o) difference curve.

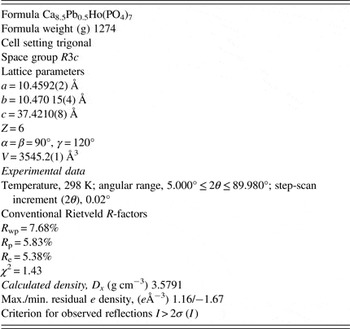
Crystallographic data and details in the data collection and refinement parameters for the Ca8.5Pb0.5Ho(PO4)7.

The JANA2006 program was ran using the pseudo-Voigt profile function to refined atomic coordinates and distances. According to obtained data, Ho3+ ions preferentially occupy M1 and M2 sites with calcium. M5 site is also occupied by Ho3+ and Ca2+. Pb2+ ions primary enters into the M3 site and only then shares positions M1, M2 with calcium or Ho3+ ions.
Second-harmonic generation (SHG) responses of powder samples were measured with a Q-switched YAG:Nd laser at λ ω = 1064 nm in a reflection mode. The experimental setup was described elsewhere (Belik et al., Reference Belik, Izumi, Ikeda, Morozov, Dilanian, Torii, Kopnin, Lebedev, Van Tendeloo and Lazoryak2002). SHG signals (I 2ω ) were measured as a function of temperature at wavelength 532 nm in a reflection geometry for thin powder and ceramic samples. The optical non-linearity of the materials was evaluated relative to an α-quartz reference (polycrystalline α-SiO2 with 3–5 µm particles size), I 2ω /I 2ω (SiO2). In fine powders, I 2ω /I 2ω (SiO2) is a quadratic function of spatially averaged components of the optical non-linearity tensor (Kurtz and Perry, Reference Kurtz and Perry1968). Taking into account that I 2ω /I 2ω (SiO2) should be zero in centrosymmetric media, we used it as an indicator of non-centrosymmetry of a material.
In electrical measurements, the samples in the form of ceramic discs 20–60 mm2 in area, 1–5 mm in thickness, and 2–4 mm in height were used. Electrical contacts to the faces of the samples were made by firing colloidal platinum paste (750 °С, 1 h). The electrical conductivity and capacitance of the samples were measured by a two probe method at frequencies from 10 Hz to 1 MHz and temperatures from 298 to 1273 K using an Agilent 4284A LCR meter.
III. RESULTS AND DISCUSSION
The experimental powder diffraction pattern is shown in Figure 1. Structural parameters are given in Table I.
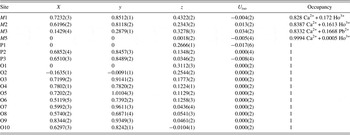
The unit-cell parameters are for Ca8.5Pb0.5Ho(PO4)7 are listed in Table I. All solid solution in system Ca9−x Pb x Ho(PO4)7 crystallizes in polar space group R3c, Z = 6. Initially, the structure refined by the Rietveld method carried out starting from data (Lecointre et al., Reference Lecointre, Bessière, Viana, Benhamou and Gourier2010). Further, the population of the cation positions was refined. The JANA2006 program was ran using the pseudo-Voigt profile function to refined atomic coordinates and distances. The atomic site coordinates are given in Table II.
The atomic site coordinates (xyz) and occupancy for Ca8.5Pb0.5Ho(PO4)7.

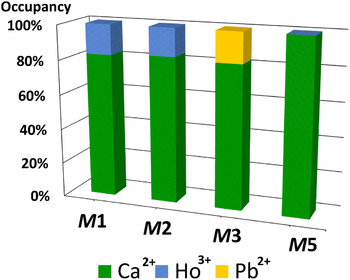
At first, it was determined, that M5 site is almost fully occupied by Ca2+ ions and only a small amount of Ho3+ ions enters in M5. After that the occupancy of M1–M3 sites with Ca2+, Ho3+, and Pb2+ ions was found.
After the last refinement, there was a good agreement between the observed and calculated patterns. According to obtained data, Ho3+ ions occupy M1 and M2 sites (about 17 and 16% from each site occupancy). The M3 site occupancy is posted by 17% Pb2+ ions and 83% calcium ions (Figure 2).
(Color online) The occupancy of M1–M5 sites in Ca8.5Pb0.5Ho(PO4)7.

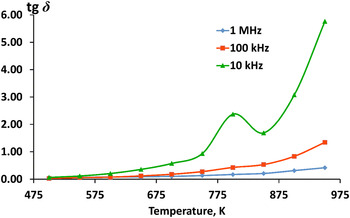
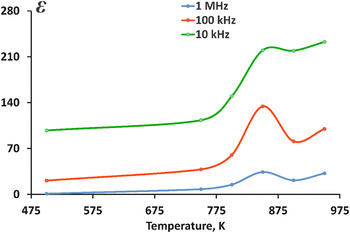
SHG tests evidenced small non-linear optical activity of Ca9 −x Pb x Ho(PO4)7, the presence of signal of SGS were about 1 unit of quartz etalon, according to the previous data (Teterskii et al., Reference Teterskii, Morozov, Stefanovich and Lazoryak2005). The dielectric spectroscopy also reveals ferroelectric type phase transitions to centrosymmetric group R3c → R–3c between 750 and 900 K. The maxima on temperature dependence is observed on tangents of dielectric loses and (Figure 3) instead of the previous data (Belik et al., Reference Belik, Morozov, Deyneko, Savon, Baryshnikova, Zhukovskaya, Dorbakov, Katsuya, Tanaka, Stefanovich, Hadermann and Lazoryak2017) and precedes the maxima on dielectric permittivity (Figure 4). The dielectric peak is not frequency dependent. The location of the maxima on the temperature dependence does not change. However, there are broad peaks because of diffuse of the phase transition and prolonged equilibration at low frequencies measuring field. Structural mechanisms and dielectric features of phase transitions are strongly influenced by the exact distributions of guest atoms over the positions.
(Color online) Temperature dependence of tangents of dielectric loses for Ca8.5Pb0.5Ho(PO4)7.

(Color online) Temperature dependence of dielectric permittivity intensity for Ca8.5Pb0.5Ho(PO4)7.

SUPPLEMENTARY MATERIAL
The supplementary material for this article can be found at https://doi.org/10.1017/S0885715617000252.
ACKNOWLEDGEMENT
This work was supported by the Russian Foundation for Basic Research (Grant No. 16-33-00197) and the Foundation of the President of the Russian Federation MK-7926.2016.5.