Implications
The welfare consequences of long-distance transportation of sheep remain controversial. Further information is required, especially on fatigue, to provide a basis for guidance or legislation. This study (a) reports potential methods for identifying fatigue; (b) shows that sheep are capable of walking for long durations; (c) indicates that under the conditions of this study, some sheep can walk for prolonged periods without showing signs of marked physiological or behavioural responses or signs of lasting harm; and (d) shows that treadmill exercise at 0.5 m/s at zero gradient was not sufficient to consistently cause reduced exercise performance in sheep.
Introduction
The welfare consequences of long-distance transportation of farm animals remain a controversial topic. Further information is required, especially on fatigue, to provide a scientific basis for advice and regulations on journey structure, maximum journey time and the time required for animals to recover after a journey. In general, where transport is performed according to best practice, existing research has not identified major welfare issues likely to result in suffering during or following long-distance transportation of sheep (Cockram, Reference Cockram2007a). However, many campaigning animal welfare organisations lobby for further regulation of long-distance transport because they believe that sheep suffer during long journeys and develop fatigue (Cockram, Reference Cockram2007b).
The exertion during gathering and loading and the work required to maintain posture and balance during transport are factors requiring physical work by transported sheep (Knowles, Reference Knowles1998). Exertion and potentially fatigue during transport may result from long periods of standing rather than lying down, muscular tension required to brace the body in response to vehicular movements and frequent limb movements as a result of a loss of balance (Terlouw et al., Reference Terlouw, Arnould, Auperin, Berri, Le Bihan-Duval, Deiss, Lefevre, Lensink and Mounier2008). In humans, muscular fatigue can in some circumstances be associated with an increased risk of muscular injury, pain and mental exhaustion (Jurell, Reference Jurell1998; Ciubotariu et al., Reference Ciubotariu, Arendt-Nielsen and Graven-Nielsen2004; Mense and Schiltenwolf, Reference Mense and Schiltenwolf2010). In addition, it can impair postural control and increase the risk of musculoskeletal injury (Gribble and Hertel, Reference Gribble and Hertel2004; Simoneau et al., Reference Simoneau, Begin and Teasdale2006). As postural control is essential for animals to respond to vehicular movements during transport, fatigue could increase the risk of injury during a journey. Random vibration during transport is also likely to be associated with postural instability, whereas continuous vibration is likely to affect the level of discomfort experienced by animals and both types of vibration could result in muscular fatigue (Randall, Reference Randall1992).
Although transport is one situation that could potentially result in sheep becoming fatigued (Fisher et al., Reference Fisher, Colditz, Lee and Ferguson2009) and fatigued sheep are not considered to be fit for transport, there has been no systematic research on potential methods to identify fatigue in sheep. The aetiology of fatigue in humans and other animals is not clearly established. A reduction in the capacity of sheep to engage in normal muscular activity could arise from a change in the physiological or pathophysiological state of the muscles, which results in a decrease in the functional capacity of the muscles to generate force or power output (muscle fatigue) or it may result from decreased motivation or central nervous system capacity (central or mental fatigue) to undertake muscular activity (Basmajian and de Luca, Reference Basmajian and de Luca1985; Fitts, Reference Fitts1994). Although the physiological causes and the changes observed during fatigue depend to some extent on the type of activity, for example the intensity and duration of the muscular work (Jurell, Reference Jurell1998), several detectable changes in muscle physiology can occur with fatigue. These changes include (1) a decrease in the frequency of the electromyogram (EMG; Basmajian and de Luca, Reference Basmajian and de Luca1985; MacIsaac et al., Reference MacIsaac, Parker and Scott2001; Cifrek et al., Reference Cifrek, Medved, Tonkovic and Ostojic2009); (2) a depletion of muscle energy stores, for example glycogen and an accumulation of metabolites, for example lactate, ammonia and electrolytes (McGowan et al., Reference McGowan, Golland, Evans, Hodgson and Rose2002); and (3) muscular damage identified by leakage of intracellular enzymes, such as creatine kinase, across the cell wall and into the circulation (Schneider et al., Reference Schneider, Dennehy, Rodearmel and Hayward1995).
To evaluate methods to identify fatigue, it is necessary to test these methods on fatigued sheep. Treadmill exercise has been used to cause fatigue in sheep. Although this type of exercise is not the same as that which is likely to occur during transportation, it provides an objective way of examining the consequences of prolonged low-intensity exercise under controlled conditions. Fatigue in man (Reilly et al., Reference Reilly, Hopkins and Howlett1979) and sheep (Pethick et al., Reference Pethick, Miller and Harman1991) has been assessed as the point at which they are unable to keep pace with the speed of a treadmill. The endurance of sheep and the types of physiological responses are related to the severity and duration of the exercise. Previous studies (Pethick et al., Reference Pethick, Miller and Harman1991; Harman and Pethick, Reference Harman and Pethick1994) have shown that sheep exercised on a treadmill at 0.83–1.25 m/s can walk for 4 h and not show signs of fatigue or marked distress. Although some liver glycogen is utilised, this type of exercise does not markedly affect muscle glycogen concentration. However, if the gradient of the treadmill is increased to 9°, the sheep appear to become exhausted after about 2 h and there is a significant reduction in the glycogen content of the muscles involved in exercise. Sheep exercised at 1.94 m/s trot and at 2.5 m/s they gallop, the blood lactate concentration increases to a sustained peak and after 25 to 35 min the sheep can become ‘tired’ and pant. Factors that lead to fatigue in sub-maximal aerobic exercise, such as that likely to occur during long-distance transport, are less well studied and may be different in nature from those involved in anaerobic muscle fatigue.
In animals, behavioural studies are also likely to be a useful way of assessing fatigue. However, quantitative behavioural studies of resting behaviour in sheep after long journeys indicate that lying down to rest is not a priority for sheep (Cockram et al., Reference Cockram, Kent, Jackson, Goddard, Doherty, McGilp, Fox, Studdert-Kennedy, McConnell and O'Riordan1997). It is therefore important to investigate whether sheep that have been exercised show a quantitative change in their lying behaviour and whether quantitative behavioural measurements are a potential means of identifying fatigue. In addition, qualitative behavioural assessment (QBA) could potentially provide a means of recognising and identifying (subtle) signs of fatigue that are not identified by quantitative measurements of lying posture (Wemelsfelder et al., Reference Wemelsfelder, Hunter, Mendl and Lawrence2001; Wemelsfelder and Farish, Reference Wemelsfelder and Farish2004). Another potential method of evaluating fatigue is to assess the motivation of sheep to either rest or to get up and move to obtain food. A fatigued sheep might have a greater motivation to rest than a sheep that had not been exercised, but deprived of food for a similar period. Motivation to obtain food can be tested by quantifying the time taken for sheep to complete a maze and reach a food reward (Liddell, Reference Liddell1925).
The aim of this work was to develop and evaluate potential methods to identify fatigue in sheep. It was funded by a government department with responsibility for the development of animal welfare regulations and policy so that they could use the results of this and subsequent research to assess the welfare significance of fatigue during transportation. However, the enforcement of legislation to protect the welfare of animals during scientific procedures restricted our ability to impose a treatment of sufficient severity to consistently induce fatigue. The treatment procedure proposed, that is, long duration of walking until voluntary termination of walking, was based on reports in the existing literature that suggested that the likely effects of this treatment would have been limited to fatigue. However, the proposed treatment was considered by inspectors responsible for the enforcement of The Animals (Scientific Procedures) Act (Parliament of the United Kingdom, 1986) to potentially cause too severe pain, suffering, distress or lasting harm to the sheep in relation to the proposed benefits of the research. Under the provisions of this legislation, we were required to identify an end point that would enable the treatment to be terminated before a sheep could potentially experience any harm. The nature of these restrictions necessitated a staged approach to determine a treadmill protocol of the minimal severity to cause a sign of a reduced exercise performance, without causing apparent distress or other harm to the sheep. The first stage of this work was to identify the least severe treatment (speed and duration) of walking on a treadmill for a long period that caused a sign of reduced exercise performance. The second stage was to assess whether sheep that showed this first sign of a reduced exercise performance also showed any behavioural or physiological changes that might have been associated with fatigue, namely, (a) increases in the blood concentration of the products of muscle metabolism, (b) a reduction in the median frequency of an EMG, (c) a quantitative increase in resting behaviour, (d) qualitative changes in behavioural demeanour and (e) decreased motivation to obtain a food reward.
Material and methods
Animals
Sixteen Scottish Mule sheep, between 13 and 14 months old, were chosen from an on-site flock by selecting the calmest sheep during handling. The sheep were shorn to achieve a fleece depth of ∼20 mm. They were housed in adjacent individual pens on wood shavings bedding and offered ad libitum hay, a 16% protein ewe mix concentrate ration and fresh water twice a day. Gentling was performed to habituate the animals to human presence and manipulation. The sheep were then incrementally exposed to the equipment and the various procedures used in the experiment.
Treadmill
An adapted equine treadmill was used to provide a standard exercise treatment. Sheep were exercised individually on the treadmill and protected from injury by tethering, side and front fences and a belly strap attached to an emergency cut-off system. A companion sheep was placed adjacent to the treadmill in an open-barred pen. Cooling fans were directed onto the sheep during exercise and exercise treatments were only undertaken if the room temperature was not greater than 25°C or 22°C if the relative humidity exceeded 70%. Following acclimatisation and training on the treadmill, sheep were exercised on the treadmill at zero inclination (grade) and a speed of 0.5m/s. The results of a preliminary study on a small number of different sheep (n = 5) were used to determine the minimal severity of exercise treatment that would cause a decrease in exercise performance. The behavioural and physiological responses of the sheep during and after treadmill treatments of 0.5 h step-wise increments in the duration were assessed after each increment in walking duration. During the preliminary study, the treadmill was stopped and the exercise treatment ended when a sheep lay down after 1.8 h. In subsequent treatments to determine the repeatability of the decrease in performance, one sheep laid down after 2.8 h and another sheep laid down after 3.3 h of the exercise treatment. Other than a raised plasma creatine kinase activity in these sheep (i.e. apparently greater than the pre-treatment activity of 200 IU/l), which was not present in sheep that walked for up to 3 h, without voluntarily stopping, no adverse consequences of the exercise treatment were found. Although exercise affected physiological variables in a predictable manner (Bell et al., Reference Bell, Hales, King and Fawcett1983), the heart rate of the sheep at this speed of walking did not exceed 160 beats/min, the respiration rate was below 85 breaths/min, there was no evidence of dehydration (as determined by plasma osmolality) or hyperthermia (the rectal temperature of the sheep did not increase by more than 0.6°C during exercise, and remained below 40°C for most sheep). Therefore, a treatment regime of walking on a treadmill at 0.5 m/s at zero grade for up to 5 h or until a decrease in performance was observed was used in a replicated study. The criteria used to identify a decrease in performance during treadmill exercise included: increased frequency of the following events: coasting (standing still and carried along by the movement of the treadmill, but then resumed walking), kneeling (one or both forelegs bent and in contact with the treadmill but then resumed walking) or stumbling (misplaced step resulting in lowering of the front of the body), a consistent change in the pattern of walking (particularly staggering or swaying, that is, walking in an unsteady motion with sudden sideways movement and/or abrupt rolling or pitching to one side), and falling or lying down without immediately standing up.
Exercise treatment
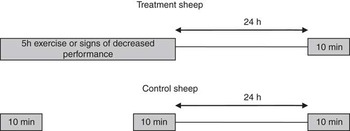
The sheep were allocated to either a treatment or a control group and kept in eight pairs (of one treatment and one control sheep). Each treatment sheep was exercised for up to 5 h or until a decrease in performance was observed. The control sheep in each pair was exercised for 10 min before the start and for a second 10-min period immediately after the treatment sheep exercise period. During exercise, the behaviour of both the control and treatment sheep was directly observed and video recorded. The sheep were then returned to their home pens in a trolley. After 24 h, the treatment and control sheep were each exercised again for 10 min (see Figure 1). For each pair of sheep, and after an interval of at least 7 days, the treatment and control procedures were repeated on the same sheep. On one occasion, physiological and quantitative behavioural observations were made, and on the other occasion videos for qualitative behaviour assessments were taken and motivation tests were performed. The order of each type of measurement was randomised between pairs of sheep.
Exercise periods for Treatment and Control sheep.

Blood chemistry
Blood samples were collected by venipuncture from the external jugular vein into heparinised vacutainers before exercise (BS T1), immediately after exercise (BS T2) and 24 h after exercise (BS T3). The blood lactate concentration was determined using a Lactate Pro meter and test strips (Arkray Inc., Kyoto, Japan) (Pyne et al., Reference Pyne, Boston, Martin and Logan2000) and the blood sample was refrigerated. The blood ammonia concentration was measured using a glutamate dehydrogenase photometric method (Randox Ltd, Crumlin, Co. Antrim, UK). The packed cell volume was determined, the blood was centrifuged, the plasma removed and stored at −20°C for subsequent analysis. The following were measured in plasma on an Instrumentation Laboratory IL600 analyser (Instrumentation Laboratory UK, Warrington, UK): creatine kinase activity (Instrumentation Laboratory kit 18482100), total protein (Instrumentation Laboratory kit 0018251440) and free fatty acid concentrations (NEFA-C kit, WAKO Chemicals, Neuss, Germany). The plasma cortisol concentration was measured on a DPC Immulite Analyser using Immulite kit LKCO1 (Siemens Healthcare Diagnostics, Deerfield, USA). The plasma potassium concentration was measured on a Corning 644 electrolyte analyser using ion-selective reagents. The plasma osmolality was measured by freezing point depression using a micro-osmometer (Advanced Micro-Osmometer Model 3 MO, Vitech Scientific Ltd, West Sussex, UK). The data were checked for normality, where necessary the data were transformed to approximate normality and a repeated measures mixed model analysis (using SAS 9.2 software, SAS Institute, USA) was undertaken to examine treatment, time and treatment × time interactions. Of the 46 measurements of plasma cortisol concentration, 16 (30%) were apparently positive, that is, above 5.5 nmol/l, but below the level of 13.5 nmol/l above which the instrument was able to give reliable readings. These very low plasma cortisol concentrations were reallocated using a random value generated from a uniform distribution with a minimum of 6 and a maximum of 14. Of the 48 measurements of blood lactate concentration, 23 (48%) were apparently positive, that is, they indicated a reading of 0.7 mmol/l, but this was below the level of 0.8 mmol/l above which the instrument was able to give reliable readings. These very low blood lactate concentrations were reallocated using a random value generated from a uniform distribution with a minimum of 0.1 and a maximum of 0.7.
EMG recordings
Simultaneous electrophysiological recordings were made on one control and one treatment sheep in each pair. An ambulatory data logger (Embla, Flaga Medical Devices, Reykjavik, Iceland) was secured on the back of each sheep using a harness. Pairs of silver/silver chloride 9-mm disc electrodes containing electrode gel were glued ∼20 mm apart to areas of bare, cleaned skin overlying and in the longitudinal direction of the m. tensor fascia latae and m. semitendinosus muscles on both the left and right hind legs and connected to the data logger via leads (clipped into the fleece). The EMG output (sampled at 200 Hz) was recorded from before the start of exercise until after the final 10-min exercise period (24 h after the end of the treatment exercise period). The electrophysiological recordings were transferred from a data storage card and subsequently viewed using ‘Somnologica’ software (Flaga Medical Devices, Reykjavik, Iceland) to determine the suitability of the quality of the recordings for further analysis. A 50 Hz power line filter and a 10 Hz low-cut filter to remove movement artefacts were applied to each EMG recording. At 10-min intervals from the start of exercise, the ‘Somnologica’ software was used to perform a fast Fourier transformation on 30-s epochs of each EMG. The power distribution of the signal in relation to the frequency spectrum of the section of the EMG recording was used to identify the frequency with 50% of the power either side of the value, that is, the median frequency (ƒmed). Individual treatment sheep EMG ƒmed values for each location were plotted against duration on the treadmill. Trend analysis (using Minitab 15 software, Minitab, USA) was used to fit linear, quadratic and exponential general trend models to the time series. The accuracy of the fitted values was assessed using the calculated MAPE (mean absolute percentage error), MAD (mean absolute deviation) and MSD (mean squared deviation) values.
For each EMG recording, the average of the median frequencies calculated for two 30-s epochs at 10-min intervals was calculated at the start of treadmill exercise for the treatment sheep and during the first 10-min exercise period for the control sheep (EMG T1), during the final 10 min of treadmill exercise for the treatment sheep and during the second 10-min exercise period for control sheep (EMG T2) and during the 10-min exercise periods for treatment and control sheep 24 h after the end of the treatment sheep exercise period (EMG T3). The change in the median frequency between EMG T2 and EMG T1 was calculated as the proportion of the median frequency at EMG T1 and the change in the median frequency between EMG T3 and EMG T2 was calculated as the proportion of the median frequency at EMG T2. These proportionate changes were then averaged between the left and right EMG recordings from over the m. tensor fascia latae and over the m. semitendinosus. The data were checked for normality, and a repeated measures mixed model analysis was undertaken to examine treatment, time and treatment × time interactions on the proportionate changes in the median frequency of the EMG between EMG T2 and EMG T1, and between EMG T3 and EMG T2.
Quantitative behaviour in home pens
The behaviour of the sheep instrumented for EMG recording was recorded for 24 h before and after treadmill exercise. The recordings were made using a time-lapse videocassette recorder (CTR-3024, Computar, Cramlington, UK), a multiplexer (Sprite dx, Dedicated Micros, Warrington, UK), infrared lamps (Dennard Ltd, Fleet, UK) and black-and-white CCTV cameras (WV-BP124, Panasonic, Hamburg, Germany) with infrared pass filters. Continuous focal observations of behavioural states – lying (with head raised or lowered and in contact with the ground), standing still, walking, feeding and drinking – were made of each sheep from the video recordings using ‘The Observer’ software (Noldus, The Netherlands). The latency to lie down, the latency to feed and the duration of each behaviour (percentage of 6-h and 24-h observation periods) were recorded. The data were checked for normality and where necessary either transformed to approximate normality or a Mann–Whitney test was used to compare groups at a specific time period. The behaviour was compared for a 6-h and a 24-h period before (B T1) and after exercise (B T2) to identify any quantitative behavioural differences. A repeated measures mixed model analysis was undertaken to examine treatment, time and treatment × time interactions.
Maze test
Behavioural tests for sheep that had been exercised on a treadmill were developed to determine whether there were differences, before and after treatment, in the time taken to complete a maze test to obtain a food reward. The maze was 8 m × 4.9 m and consisted of solid walls on three sides and three barriers at 2-m intervals that required the sheep to undertake a series of turns before reaching a food reward. The sheep were randomly placed into one of two holding pens and individually released into the maze via a swing gate. They were trained to complete the maze to obtain concentrates from a bucket placed at the end of the maze. The time from opening the swing gate until the sheep reached the bucket and lowered their head into the bucket to start to eat the concentrates was recorded as the time taken to complete the maze. Before treadmill exercise, both the treatment and the control sheep were given three trials in the maze to establish a consistent baseline time for completing the maze (M T1). After treadmill exercise, the sheep were returned to the maze area in a trolley and given a further three trials in the maze to determine the time taken to complete the maze after exercise (M T2). Twenty-four hours after the treatment sheep had finished the treadmill exercise treatment, the sheep were given a further three trials in the maze (M T3). For each of these three time points, the times taken to complete the three maze trials were averaged. The data were checked for normality and a repeated measures mixed model analysis was undertaken to examine treatment, time and treatment × time interactions on the time taken for the sheep to complete the test at M T1, M T2 and M T3.
QBA
Behaviour recordings
The behaviour of the sheep in the companion pen in the treadmill room was recorded using a digital video camera (Panasonic Digital Movie Camera, Model number NV-GS400EB). Five-minute recordings were made at the following times: (a) before treadmill testing, when control and treatment sheep were placed individually in the companion pen in the treadmill room (Q T1); (b) immediately after the treadmill exercise, when the treatment sheep was placed in the companion pen and when the control sheep was placed in the companion pen immediately after the second 10-min period of treadmill exercise (Q T2); and (c) 24 h after the treatment sheep had finished the treadmill exercise treatment, when the control and treatment sheep were placed individually in the companion pen in the treadmill room (Q T3). From this series of recordings, a 1-min clip from each was selected for the QBA. The 5th minute from the Q T1 recordings was chosen to capture behaviour after sheep had become accustomed to the pen. The 2nd minute was chosen from both the Q T2 and Q T3 recordings to capture behaviour as soon as possible after the end of the treadmill treatment.
Observers
Thirteen observers with varying degrees of experience working with sheep were asked to assess the behavioural expression of the 16 sheep during the 48 1-min video recordings. Twelve of the observers were female undergraduate veterinary students, and one was a stockman. Observers were kept naïve to the specific purpose of the experiment, that is, an investigation of fatigue, and instead were informed that this study generally investigated the effects of long-distance transport on sheep welfare, and that different sheep had undergone different treatments. Observers were asked to attend three sessions and full instructions were given according to the Free Choice Profiling (FCP) method described in Wemelsfelder et al. (Reference Wemelsfelder, Hunter, Mendl and Lawrence2001). The two stages of the FCP procedure took place in the same room using a digital video projector and screen, and observers were present together for all sessions. To ensure the independence of observer assessments, observers were told to refrain from discussion throughout the FCP exercise.
FCP phase 1: term-generation
Of the 48 recordings, the 12 that showed the most varied repertoire of behaviours were selected to be shown to observers for this phase. Observers were asked to watch each recording and were then given 2 min to write down as many one-word descriptions as they could think of to describe the demeanour of the sheep, for example calm, tense or stressed. Observers were encouraged to use as many terms as they needed to describe the various layers of behavioural expression perceived in each recording, and to use both new and previously used terms for successive recordings, if they felt they were appropriate.
FCP phase 2: quantitative scoring of terms
An individual rating tool was then designed for each observer based solely on the terms they themselves had generated in phase 1. This tool consisted of each of an observer's terms followed by a Visual Analogue Scale of 125-mm long and marked with ‘minimum’ and ‘maximum’ end points. Over two further sessions, observers were presented with the full series of 48 sheep recordings, and asked to score each sheep on each of their terms using the VAS scale. It was suggested that this scoring represented the intensity of a perceived demeanour (e.g. ‘how agitated is this sheep’), with the distance in millimetres between the minimum point and the observer's mark taken as the score for a particular sheep on a particular term.
Statistical analysis
Data from the FCP consisted of 13 sets of individually generated data matrices (one for each observer). Each matrix was defined by the number of video recordings used (48) and varied in the number of terms generated by a particular observer. The scoring patterns in these matrices were analysed with Generalised Procrustes Analysis (GPA), using a specialised software edition written for Francoise Wemelsfelder (GENSTAT 2008, VSN International, Hemel Hempstead, Hertfordshire, UK). For a detailed description of GPA procedures, see Wemelsfelder et al. (Reference Wemelsfelder, Hunter, Mendl and Lawrence2000). Briefly summarised, GPA is a multivariate technique that does not rely on fixed variables, but calculates a consensus profile or ‘best fit’ of observer assessments through complex geometric pattern matching. This consensus profile has several main dimensions (usually 2 or 3) explaining the variation between animals. Whether this consensus is a significant feature of the data set, or an artefact of the Procrustean calculation procedures, is determined through a randomisation test that evaluates the consensus profile with 100 randomised profiles using a one-tailed t-test. Each animal receives a quantitative score on each of the consensus dimensions, so that the animal's position in the consensus profile can be graphically represented in two- or three-dimensional plots. Consensus dimensions are interpreted by correlating the animals’ scores on these dimensions to the observers’ individual scoring patterns, producing word charts that describe the consensus in the terms of each individual observer. These word charts can be compared for linguistic consistency, and help identify descriptors that strongly correlate with the consensus dimensions and are therefore suitable for labelling these dimensions. The assessments of control and treatment sheep by the observers at each time point (Q T1, Q T2 and Q T3) were compared using the scores from the GPA for each dimension. Within each treatment group (i.e. control and treatment), the scores for each dimension were compared between time points using Friedman's tests. Where there was a significant difference, pairs of time points were compared using a Wilcoxon signed-rank test (where appropriate using a Bonferroni adjustment to modify the P-value by the number of comparisons made). For each dimension, control and treatment groups were compared at each time point using Mann–Whitney tests.
Results
Behaviour on the treadmill
One sheep on one occasion lay down after 4.5 h of exercise on the treadmill. This sheep on the second occasion and all other treatment sheep walked for 5 h on the treadmill without any indication of a reduced exercise performance. No occurrences of stumbling, staggering or swaying were observed. The median number of occurrences of kneeling down during the treatment periods was 0.5, Q1 0, Q3 2, n = 16. On eight occasions, a sheep did not kneel down. Coasting was observed on each occasion. The median number of occurrences of coasting during the treatment period was 22.5, Q1 7.5, Q3 59.5, n = 16. There was no apparent increase in the median frequency of events per hour with duration on the treadmill for coasting (10, 2.5, 1.5, 4 and 4 events per hour, respectively, during each of the 5 h) or kneeling down (0, 0, 1, 0.75 and 0 events per hour, respectively, during each of the 5 h). The median air temperature during the treatment periods was 14°C (range 10°C to 17°C).
Blood chemistry
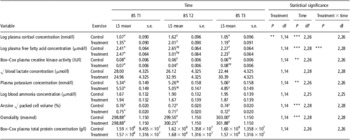
Table 1 shows the effects of treatment and time on the blood and plasma variables. After log10 transformation, there were significant treatment (P < 0.01) and time (P < 0.001) effects on plasma cortisol concentration, in that treatment sheep had a greater plasma cortisol concentration than control sheep and the concentration immediately after treadmill exercise (BS T2) was greater than either before (BS T1) or 24 h after treadmill exercise (BS T3). The only significant treatment × time interaction was found for the log10 transformed free fatty acid concentration (P < 0.001) where there was a greater concentration in treatment than in control sheep immediately after treadmill exercise (BS T2), but this difference was no longer present 24 h after treadmill exercise (BS T3). After a Box–Cox transformation of the plasma creatine kinase activity, there was a significant effect of time (P < 0.01). However, the transformation of the values was necessary because of a right skew to the data as a result of several large values. Once the data had been transformed to approximate normality, the influence of these large values was diminished. However, non-parametric analysis using a Mann–Whitney test on the plasma creatine kinase activity at BS T2 also found no significant difference between the treatment (median 446, Q1 357, Q3 850 IU/l) and control (median 390, Q1 214, Q3 468 IU/l) sheep. There were no significant effects on either blood lactate or blood ammonia concentrations. There was a time effect on the plasma potassium concentration, but this was due to a low potassium concentration at BS T3 compared with that at BS T1. There was an effect of time on the arcsine square-root-transformed packed cell volume as a result of greater values at BS T1 than at BS T2 and BS T3. There was an effect of time on the plasma osmolality as a result of greater values at BS T3 than at BS T1 and BS T2, but there were no significant effects on the Box–Cox-transformed total plasma protein concentration.
Effect of treadmill exercise (0.5 m/s for 5 h) on the blood and plasma composition of sheep

abDifference in superscripts within column indicates a significant difference between treatment groups within a time point.
xyzDifference in superscripts within row indicates a significant difference between time points.
cA small number of samples could not be analysed.
BS T1, BS T2, BS T3: blood sampling times before exercise, immediately after exercise and 24 h after exercise, respectively.
EMG
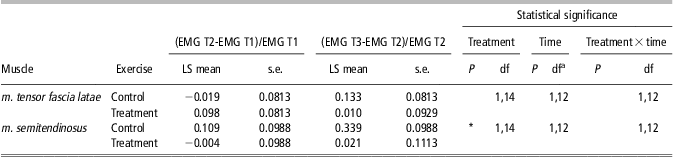
Table 2 shows that there were no significant effects of treatment or time on the proportionate change in the median frequency of the EMG recorded over the m. tensor fascia latae. However, there was a significant treatment effect (P < 0.05) on the proportionate change in the median frequency of the EMG recorded over the m. semitendinosus. There was a proportionate decrease in the median frequency of the EMG recorded over the m. semitendinosus between EMG T2 and EMG T1, that is, after treadmill exercise in the treatment sheep and this was significantly different from the control sheep. However, there was no obvious decrease in the median frequency of the EMG of treatment sheep during the period of treadmill exercise. Other than for one treatment sheep (where there was a decreasing trend in all four locations), the trend analysis failed to show a trend for decreasing median frequency of the EMG during treadmill exercise. Only one specific location in each of another three sheep showed a decreasing trend. The best fit for this decreasing trend was a quadratic model, for example for the m. semitendinosus on the right side of sheep 5, fmed = 35.25–0.16t–0.01t 2.
Effect of treadmill exercise (0.5 m/s for 5 h) on the proportionate change in the median frequency of the EMG recorded over two muscle groups in the hind leg of sheep

EMG = electromyogram.
aIn two sheep, the recordings for one time period were lost due to electrode detachment.
EMG T1, EMG T2, EMG T3: median frequencies of the EMG during 10-min periods of treadmill exercise: at the start, at the end and 24 h after the 5 h treadmill exercise treatment, respectively.
Quantitative behaviour in home pens
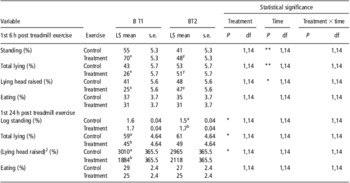
There were no significant treatment × time interactions on the behaviour of the sheep in their home pens. Although there were significant treatment effects, there was no evidence that sheep that had been walked on the treadmill for up to 5 h (treatment) lay down more during the subsequent 6- or 24-h periods than control sheep. The control sheep tended to lie down more than the treatment sheep (Table 3). Although there were some effects of time on lying behaviour during the first 6 h after the treatment, they appeared to have been due to the relatively small percentage of time spent lying down by some treatment sheep before the treatment rather than an effect of the treatment itself. There were no significant effects on the percentage of time spent eating. The latencies after the treatment period to either lie down or to eat could not be readily transformed to approximate normality. Therefore, the latency to lie down and the latency to eat were compared during the 24-h period after the treatment period using Mann–Whitney tests, but no significant differences were found. The median latency to lie down for the control sheep was 1.70 h (Q1 1.03 h, Q3 2.43 h) and for the treatment sheep it was 1.31 h (Q1 1.05 h, Q3 1.77 h). The median latency to lie down with head down for the control sheep was 3.67 h (Q1 2.25 h, Q3 4.31 h) and for the treatment sheep it was 3.35 h (Q1 2.20 h, Q3 4.12 h). The median latency to eat for the control sheep was 162 s (Q1 6 s, Q3 237 s) and for the treatment sheep it was 105 s (Q1 3 s, Q3 257 s).
Effect of treadmill exercise (0.5 m/s for 5 h) on the percentage of time that sheep spent standing, lying, lying with head raised and eating in their home pens during the first 6-h and 24-h periods after treadmill exercise (B T2) and during the equivalent time of day before treatment (B T1)

ab Difference in superscripts within column indicates a significant difference between treatment groups within a time point.
xy Difference in superscripts within row indicates a significant difference between time points.
Maze test
There was no significant treatment, time or treatment × time interaction on the times taken by the sheep to walk through a maze to obtain a food reward. The mean time taken to complete the test before exercise was 6.7 s (s.e. 0.30), and after exercise it was 6.7 s for control sheep and 7.0 s for treatment sheep.
QBA
The consensus profile explained 58% of the variation between individual observer assessments, and differed significantly from the mean of 100 randomised profiles (P < 0.001), demonstrating that this consensus was not just an artefact of the calculation procedures. There were two main consensus dimensions, explaining 53% and 20% of the variation between video clips, respectively.
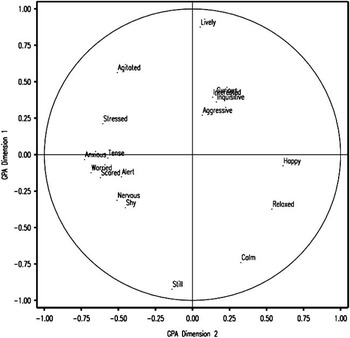
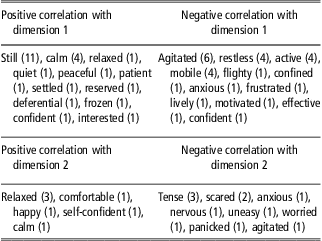
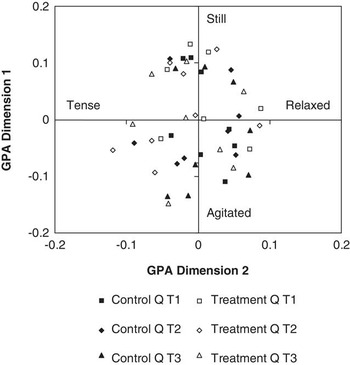
One of the 13 observer word charts is shown in Figure 2. Table 4 provides an illustration of the semantic consistency between the observer word charts. This table shows the terms correlating most strongly with the consensus dimensions for each observer, and with a few exceptions the meaning of these terms is sufficiently convergent to allow selection of representative labels. Thus, we interpreted dimension 1 as ranging from agitated/restless to still/calm, dimension 2 as ranging from tense/scared to relaxed/comfortable. Although no observers used the term ‘fatigued’, one individual used weary, but this term did not correlate highly with either of the two dimensions (Figure 3).
Word chart for one of the 13 observers. Axes reflect the level of correlation of the observer's terms with dimensions 1 and 2 of the consensus profile. GPA = Generalised Procrustes Analysis.

Terms used by the observers during qualitative behavioural assessment (no. of observers who used them shown in brackets) that showed the highest positive and negative correlation with dimensions 1 and 2 of the consensus profile (two for each observer provided the correlation was above 0.5)

Position of each of the 48 clips along the two main dimensions of the consensus profile. GPA = Generalised Procrustes Analysis.

Analysis of scores for dimensions 1 and 2 did not reveal any significant differences in observer assessments between control and treatment sheep at each time point or between time points within each group. For dimension 1, the estimated median score for the control group at Q T1 was 0.03, at Q T2 it was 0.01 and at Q T3 it was 0.03 (s = 0.75, df = 2, P > 0.05). For dimension 1, the estimated median score for the treatment group at Q T1 was 0.01, at Q T2 it was 0.05 and at Q T3 it was 0.05 (s = 7.75, df = 2, P < 0.05). However, comparisons between each pair of time points for the treatment group did not show that the differences between the median values were significantly different from zero (even without a Bonferroni adjustment; P > 0.05). For dimension 1, there were no significant differences between the median score of control and treatment groups at each time point (P > 0.05). For dimension 2, the estimated median score for the control group at Q T1 was 0.004, at Q T2 it was 0.007 and at Q T3 it was −0.009 (s = 1.75, df = 2, P > 0.05). For dimension 2, the estimated median score for the treatment group at Q T1 was −0.03, at Q T2 it was 0.01 and at Q T3 it was −0.01 (s = 1.00, df = 2, P > 0.05). For dimension 2, there was no significant difference between the median score of control and treatment groups at each time point (P > 0.05).
Discussion
The behavioural and physiological responses of sheep exercised for up to 5 h on a treadmill were determined, but to evaluate the potential of the methodology to assess fatigue we would have required a treatment protocol that clearly induced fatigue in sheep. However, the treatment protocol used may not have induced sufficient fatigue to enable the potential of the methods used to identify fatigue to be fully evaluated. The main end point to identify fatigue was a decrease in exercise performance, as indicated by a voluntary termination of exercise by the sheep, that is, it stopped walking and lay down. As walking until fatigue occurs is likely to be an aversive experience for sheep, we were required by regulatory authorities to identify the minimal severity of exercise treatment that would cause a reduction in exercise performance in the sheep. During preliminary studies, some sheep lay down after 1.8, 2.8 and 3.3 h of the exercise treatment, and therefore the replicated study was based on a treadmill protocol of 0.5 m/s with 0° incline for up to 5 h. Unfortunately, most of the sheep in the replicated study appeared to have been able to walk for longer than 5 h without apparent difficulty. We were not able to identify other changes in the behaviour of the sheep during exercise such as an increased frequency of coasting that would have indicated that the sheep were attempting to reduce their energy expenditure (Boyne et al., Reference Boyne, Brockway, Ingram and Williams1981). Therefore, we identified the minimal severity of the exercise treatment that would indicate a reduced performance in some sheep, but did not identify an exercise protocol that was repeatable for inducing fatigue in a range of sheep. As the severity of an exercise treatment is dependent on the fitness of the animal, as well as the intensity and duration of the exercise, it was possible that the sheep used in the replicated study had greater capacity for exercise than those used in the preliminary study.
One objective of the study was to examine the extent of any changes in blood chemistry indicative of muscle metabolism, stress and hydration state in sheep with a decreased exercise performance. Although after vigorous exercise (e.g. >1 m/s) sheep can become dehydrated (Apple et al., Reference Apple, Minton, Parsons, Dikeman and Leith1994), there was no evidence from the packed cell volume, the plasma osmolality and the plasma total protein concentration to indicate that the sheep became dehydrated during the 5-h exercise period. In the pilot study, sheep that voluntarily stopped walking after 3 h of exercise had raised plasma creatine kinase activity. This raised activity would be expected to occur following prolonged exercise if the muscles had become fatigued with increased membrane permeability or were injured (Brancaccio et al., Reference Brancaccio, Maffulli and Limongelli2007). In the replicated study, sheep that had walked for 5 h without lying down did not have greater plasma creatine kinase activity than control sheep. Therefore, there was some evidence from the preliminary study that raised plasma creatine kinase activity might be useful in identifying fatigue. However, sheep that had been exposed to prolonged exercise, without any sign of fatigue, did not have raised plasma creatine kinase activity. This is consistent with previous reports that suggest that in sheep the plasma creatine kinase activity can be related to the intensity of exercise (Gericke and Belonje, Reference Gericke and Belonje1975; Tripp and Schmitz, Reference Tripp and Schmitz1982). In the replicated study, there was no evidence that walking for 5 h resulted in significantly raised by-products of muscle metabolism in the blood, that is, there was no significant increase in blood lactate and no evidence of increased concentrations of ammonia and potassium that can occur after vigorous exercise. This suggests that the 5 h of exercise had not caused a build-up of waste products that can be associated with muscle fatigue. The raised plasma free fatty acid concentration after the 5 h of exercise was most likely a consequence of mobilisation of energy reserves to meet the extra energy demand of exercising muscles (Bird et al., Reference Bird, Chandler and Bell1981), but it might also have been influenced by any concurrent stress response. There was some evidence that the sheep may have found the exercise protocol stressful in that the plasma cortisol concentration was greater after 5 h of exercise than before exercise. Similar responses have been reported in sheep after exercise (Apple et al., Reference Apple, Minton, Parsons, Dikeman and Leith1994). Whether the raised plasma cortisol concentration indicated an arousal or a physiological response associated with mobilisation of body energy reserves following exercise activity and raised metabolic rate or indicated that the sheep found the 5 h of treadmill exercise aversive is not clear.
Although there was a statistically significant proportionate decrease in the median frequency of the EMG recorded over the m. semitendinosus after treadmill exercise, this effect was small and not supported by an obvious trend for a decrease in the median frequency of the EMG of treatment sheep during the period of treadmill exercise. In sheep, m. semitendinosus is active during exercise (Aalhus and Price, Reference Aalhus and Price1991), particularly during movement of the hip joint (Tokuriki, Reference Tokuriki1973), and was likely to have had considerable work to perform during 5 h of walking. Any effect of prolonged exercise on the characteristics of the EMG of m. semitendinosus and not in m. tensor fascia latae might have been because of greater activity in m. semitendinosus than in m. tensor fascia latae (i.e. involved in the abduction of the hind limb). However, the EMG recorded during walking is complex and affected by artefacts that require filtering. These artefacts can arise from several sources such as the degree of attachment of the electrodes, the position of the electrodes on the leg, the durability of the electrode gel, the movement of electrode leads and electrical interference (Clancy et al., Reference Clancy, Morin and Merletti2002). In this study, any potential effect of prolonged exercise was small, and it was possible that several factors affected the EMG recordings. Although a muscle fatigue monitor has been developed (Stulen and de Luca, Reference Stulen and de Luca1982), the usefulness of this method in readily identifying fatigue requires further evaluation.
An interesting result from this study was that there were no biologically significant effects of the exercise treatment on the resting behaviour of the sheep after treadmill exercise. A sheep that walked for 5 h would have walked the equivalent of 9 km, which is greater than estimates of the total distance walked by a grazing sheep in a day of about 6.4 km (Clapperton, Reference Clapperton1964a). This result was also consistent with observations on two sheep by Clapperton (Reference Clapperton1964b) where the percentage of time spent lying down during the night only increased by 1% after walking on a treadmill at about 0.4 m/s for about 4 h/day compared with that after no exercise. In the current study, the behaviour of the treatment sheep during the first 6 h after exercise was similar to that of the control sheep in that they spent about half of this time standing and about half of the time lying down. The median time taken by treatment sheep to lie down after exercise was 1.3 h. This suggests that rest was not an immediate priority for these sheep. For both the control and treatment sheep, eating was a priority after 5 h without food. The median time taken by treatment sheep to start to eat was 1.8 min. The control and treatment sheep spent about one-third of the first 6 h after the treatment period eating and about one-quarter of the 24-h post-treatment period eating. This motivation to eat rather than to rest is also found after sheep have been transported on long journeys (Cockram et al., Reference Cockram, Kent, Jackson, Goddard, Doherty, McGilp, Fox, Studdert-Kennedy, McConnell and O'Riordan1997) and was also reflected in the results of the maze test. The treatment sheep took on average only 0.4 s longer to walk through the maze and start to eat concentrates after the 5-h exercise period than before the exercise period. This apparent difference was small (6% longer) and was not statistically significant. Although no treatment effects were observed, the underlying principle of this test could have value as a post-transport test. However, it might be necessary to make the maze more complex and larger so that the time taken to complete the maze would be longer than in this case (6–7 s). If sheep had been fatigued to a point that was obvious to an observer (or inspector), the QBA would have been expected to show an effect of the exercise treatment. There was a high observer consensus on the qualitative assessments of the sheep's demeanour, resulting in the emergence of two clear expressive dimensions. However, no differences were found between the scores of sheep or time points on any of these dimensions.
As this study was unable to demonstrate that the sheep had clearly become fatigued in a replicated and controlled manner, no definitive conclusions can be reached on whether the methods used could have readily identified fatigue after a more severe exercise treatment. There was no evidence that the sheep became tired and rested more after the exercise treatment and physiological responses after exercise were not marked. As the results of this and other studies, for example Harman and Pethick (Reference Harman and Pethick1994), show that it can be difficult to fatigue sheep by gentle walking exercise within a 5-h period, the capacity of sheep to withstand the effects of a long transportation journey without developing fatigue might be equally as high. However, the experience of sheep during a long road journey is different from walking on a treadmill, and further studies are required before definite conclusions can be made on the influence of long journeys on the development of fatigue in sheep. Although the speed and gradient of the treadmill was not sufficient to consistently cause fatigue and thereby fully evaluate the methods used, this study (a) reports potential methods for identifying fatigue; (b) provides evidence of the exercise capability of sheep to walk for long durations; (c) indicates that under the conditions of this study, some sheep can walk for prolonged periods without showing signs of marked physiological or behavioural responses or signs of lasting harm; and (d) shows that the speed and gradient of the treadmill (0.5 m/s at zero gradient) was not sufficient to consistently cause signs of reduced exercise performance in sheep.
Acknowledgements
This work was funded by the Department for Environment, Food and Rural Affairs. Some of the equipment used in this study was funded by a Scottish Higher Education Funding Council, Research Development Grant. We are grateful to the staff of the R(D)SVS Veterinary Pathology Unit for carrying out some of the biochemical assays.