Introduction: creative capital and alternative strategies of economic development in the Arctic
With rare exceptions, the Arctic regions have always been a showcase of economic marginalisation and the polygon for (largely unsuccessful) economic development policies and projects (Agranat Reference Agranat1992; Rea Reference Rea1976; Hayter and others Reference Hayter, Barnes and Grass1994; DiFrancesco Reference DiFrancesco2000; Bone Reference Bone2009). Economists have well documented that frontier economies are marginal, vulnerable, structurally truncated and functionally dependent (Agranat Reference Agranat1992; Bone Reference Bone2009; Bourne 2000; Rea Reference Rea1968; Petrov Reference Petrov2012).
The state of Alaska is an example of northern economy that is largely dependent upon the petroleum industry and government sectors, which together directly or indirectly are responsible for 66% of the state's employment and 69% of GDP (Goldsmith Reference Goldsmith2008). Although the wealth of the resource sector gives the impression of economic prosperity, it is the structure of the Alaskan economy and the weakness of its internal economic capacities and institutions that indicate potential long–term economic difficulties (Huskey Reference Huskey2005; Goldsmith Reference Goldsmith2008). With the economic base solidly dominated by externally–dependent sectors, Alaska, as many other frontier economies, is under perpetual threat of cataclysm associated with resource bust or federal budget cuts. (See Petrov (Reference Petrov2010) for an analysis of the consequences of the 1990s mining ‘bust’ in Yukon.)
A lasting economic disadvantage of a northern resource periphery has been captured by the Harold Innis's ‘staple theory’ (Innis Reference Innis1956) and since then has been similarly interpreted by the variety of regional development theories (see Huskey Reference Huskey2006; Petrov Reference Petrov, Bathelt, Feldman and Kogler2011).
Not surprisingly, over eighty years into economic development policymaking in the north, the circumpolar countries are still searching for better ways to manage their northern frontiers. In Canada, the two consecutive governments (Liberals in 2004 and Conservatives in 2009) proposed comprehensive ‘northern strategies’, and the new ‘Concept of socio–economic development of the north’ was adopted by the Russian cabinet in 2000 (Pravitel'stvo RF Reference Pravitel'stvo2000), while a new concept specifically targeting the Arctic is in progress at this time. Although the United States (in contrast to Canada and Russia) does not have a northern development strategy, in Alaska, a number of regional development organisations (ARDORs) have newly updated elaborate development strategies (Alaska Division of Economic Development 2012). Still, Arctic countries are actively looking for new, alternative strategies of regional development not bounded by the staple economy.
A growing consensus among scholars is that these strategies should reconcile a postcolonial paradigm of locally–oriented development and the realities of contemporary capitalism (including pressures and competition imposed by globalisation). ‘Constructive’ post–developmentalists argue (for example Gibson–Graham Reference Gibson–Graham2005; Glassman Reference Glassman2011; Power Reference Power2003; Radcliffe Reference Radcliffe2005) that an alternative development regime must be simultaneously based on emerging traditions of the post–industrial society, post–Fordist capitalism, and the postcolonial paradigm. In the Arctic regions, it also must be supplemented by the consensus between aboriginalism, environmentalism, industrialism and nationalism (Hayter and others Reference Hayter, Barnes and Bradshaw2003). This complex task, in terms of regional policies, should result in ‘situatedness’, appreciation of local knowledge, promotion of local initiative, devolution of control, development of knowledge–based economy, and so forth.
In this respect, the alternative strategy based on enabling local human capacities, such as creative capital (CC), to advance economic development seems to be appealing. As it is described below, there is preliminary evidence that such scenario can be seriously considered in Alaska. However, any research into this matter faces the lack of basic knowledge about the spatial distribution, characteristics and utilisation of CC, as well as the lack of conceptual and methodological foundations for conducting such a study.
It is important to point out that development based on utilising the CC is not a mere substitution of natural resource as a thrust of ‘modernisation’ with human capital. The difference lies in the local embeddedness of the CC (especially in its formulation used in this paper), its relation to local and indigenous knowledge and institutions. Evidence from northern success stories suggests that CC's economic returns tend to be less decoupled with local economies, can dwell on indigenous knowledge and tradition and intertwine with institution–building and formation of civic society. This is partially determined by the endogenous nature of knowledge–based economy in general, but also by a tight relation of CC with other forms of the in situ societal capital in the periphery (Aarsæther Reference Aarsæther2004). For example, Petrov (Reference Petrov, Bathelt, Feldman and Kogler2011) notes that the ‘best innovation environment [in Northern Ontario] is built though community synergies, where creative and social capital reinforce each other’ (p. 187). In some respect, one may argue that CC based development is one of the ways to reconcile the realities of post–Fordist globalising world economy and modernities of the north.
In other words, in peripheral areas ‘weakness of strong ties’ may become strength, if an innovative activity builds appropriate networks and involves the community. By the same token, an innovator in the periphery is not an ‘atomized subject, apparently, with a preference for intense but shallow and noncommittal relationships’ (Peck Reference Peck2005: 746), but one who is ready to embrace and cooperate with the community.
The current paper addresses these important knowledge gaps in respect to CC in Alaska. The first objective of this analysis is to apply the creative class metrics in Alaska and compare their behaviour to other regions as described in the literature for US and Canada, especially in the Canadian north. This includes the analysis of the relationships between CC, ‘quality of place’ characteristics, and development in Alaska. The second objective of this paper is to utilise the metrics in order to describe the geography of the CC in the state, identify its clusters and possible flagship areas where alternative development policies may be most applicable.
CC and economic development in Alaska: the theory
In a staple–driven economy of the Arctic, the physical nature of a resource, not the volume of knowledge invested in its production, provides a necessary comparative advantage. Here, regional innovation systems depend on extremely thin streams of knowledge regulated by a few major institutional agents, first of all the state and large corporations (Bone Reference Bone2009). In this context, there are few competing technologies or other forms of innovation that could weaken the rigidity of the current techno–economic trajectory (Clark and others Reference Clark, Tracey and Lawton Smith2001). Consequently, the condition of path–dependency in the frontier remains exceptionally strong, preventing it from being successful in a modern economic competition.
It is typical for peripheral regions, which heavily rely on resource or public sector, to develop a culture of dependency that discourages entrepreneurship and innovativeness (Polèse and others Reference Polèse, Shearmur, Desjardins and Johnson2002; Suorsa Reference Suorsa2009). Moreover, the disconnectedness of the local firms with communities and networks of practice (Gertler Reference Gertler, Fuchs and Shapira2005; Lagendijk and Lorentzen Reference Lagendijk and Lorentzen2007) prevents the acquisition of the tacit knowledge that is so crucial for the modern economic development. In addition, the peripheral regions tend to develop a ‘branchplant’ culture, in which local entrepreneurship and innovativeness have minor roles being dependent on externally located headquarters (O'Hagan and Cecil Reference O'Hagan and Cecil2007). This ‘intrafirm’ or vertical peripherality weakens the region's ability to create the path on its own and encourages a cultural lock–in. Despite the fact that a resource sector could be quite innovative, in a resource–oriented economy regional innovation systems depend on very narrow flows of knowledge through a few major institutional agents, such as large corporations and the state.
A path–dependency approach appears to be a useful way to interpret a disadvantage of northern peripheries. Path–dependency is the persistence of historically and socially embedded organisational trajectories, that is specific arrangements of means, oriented towards increasing productivity and competitiveness (Bathelt and Glucker Reference Bathelt and Glückler2003; Lundvall Reference Lundvall1992) by dwelling on the existing technological paradigm using the increasing returns logic. However, the increasing accumulation of such returns does not continue infinitely, and the absence of change in the chosen trajectory results in a ‘lock–in’ (Grabher Reference Grabher and Grabher1993).
The evidence from other lagging regions demonstrates that in the case of such ‘lock–in’, there are two possibilities for a region: a new ‘path creation’ (or ‘regional reinvention,’ when a region develops new forms of competitiveness) or decline (Bathelt and Boggs Reference Bathelt, Boggs, Fuchs and Shapira2005). Among the most important arrangements that can lead to a ‘new path creation’ are the scientific, institutional, economic and social shifts that allow inventing or adopting new knowledge (Bassanini and Dosi Reference Bassanini, Dosi, Garud and Karnoe2001). Schienstock (Reference Schienstock2007) argued that a window of new opportunities is opened up by a combination of a new knowledge paradigm, economic pressures to adapt to the new paradigm, change events that support transformation and available courses of action. Some of these ‘change events’ are in place in the Arctic: a pressure to foster development, new technological opportunities, the effects of globalisation, regional self–determination and the devolution of power.
Human agency is a key transformative factor: agents of transformation are another critical and necessary component of change. These agents can be political institutions, firms or non–governmental organisations. However, in the end, the agents of change are individuals and their groups who ‘write’ the innovation history of the region (Bassanini and Dosi Reference Bassanini, Dosi, Garud and Karnoe2001; Petrov Reference Petrov2007). CC, by an analogy to human capital, may be defined as a stock of creative abilities and knowledge(s) that have economic value and are embodied in a group of individuals who either possess high levels of education and/or are engaged in creative (scientific, artistic, entrepreneurial or technological) types of activities (that is what Florida (Reference Florida2002) calls ‘the creative class’).
Recently, the literature on knowledge production, knowledge spillovers, regional institutional frameworks of knowledge transfer, and regional innovation systems converged to claim the pivotal role of human creativity in advancing regional and global economies (for example Desrochers Reference Desrochers2001; Florida Reference Florida2002, Reference Florida2005; Polèse and Tremblay Reference Polèse and Tremblay2005; Schienstock Reference Schienstock2007). In other words, it became conventional to cite the human, and specifically creative, capital among the major drivers of regional development and to consider it as the key element of regional competitiveness. The ability of regions to attract and accumulate creative capital is perceived as a condition, underpinning innovative development and knowledge–based economic growth (Desrochers Reference Desrochers2001; Florida Reference Florida2002).
A number of opponents criticised the so–called ‘creative class thesis.’ The critics point out the difficulty in demonstrating clear causality between the creative class and economic growth (Glaeser Reference Glaeser2004; Shearmur Reference Shearmur2007). Others focus on popular (mis)interpretations of the creative class as privileged urban techno–elite, on concepts such as metropolitan culturalism and cliché policy scripts (Markusen Reference Markusen2006; Peck Reference Peck2005; Scott Reference Scott2006). In this paper, we mostly leave this discussion aside, partially because it almost exclusively concerns metropolitan regions and says little about peripheries. As we discuss below, the earlier studies and our research suggest that the role of the creative class in non–metropolitan areas is quite different from large city–regions, so that the main arguments of the creative class debate should be reconsidered accordingly, when more evidence is collected and analysed.
Existing studies of innovation in peripheral areas also point to an important role of creative capital that, however, must be embedded into social networks and embraced by community (Aarsæther Reference Aarsæther2004; Barnes and Hayter Reference Barnes and Hayter1992; Polèse and others Reference Polèse, Shearmur, Desjardins and Johnson2002). For example, the study of local innovation in the Scandinavian north stresses ‘the importance of key local actors in innovative processes that take place in remote regions’. The authors conclude, ‘almost every innovation has had a clear core agent to manage the process. Very often this agent, initiator and “engine” of the process has been a local person, who has committed him/herself to the development of a new idea’ (Aarsæther Reference Aarsæther2004: 244). Similar evidence has been cited in other marginal regions (for example Hayter and others Reference Hayter, Barnes and Grass1994; Stohr Reference Stohr, Lithwick and Gradus2000), where local actors, particularly entrepreneurs and inventors, supported by communities, have been credited with revitalising economies in their communities.
Literature provides examples of various mechanisms, in which CC can induce endogenous economic development and growth (Boschma and Fritsch Reference Boschma and Fritsch2009; Bathelt and others Reference Bathelt, Feldman and Kogler2011; Florida Reference Florida2002; McGranahan and Wojan Reference McGranahan and Wojan2007). Most generally, CC is responsible for creating ‘meaningful new forms’ that have economic value (Florida Reference Florida2002). These ‘meaningful new forms’ are innovations that deliver economic benefits. In the recent decades the majority of research was focused on technological innovations within regional innovation systems (for example Feldman Reference Feldman, Clark, Feldman, Gertler and Williams2000). This type of innovation often has a direct connection to economic growth through adoption of new technologies, and it is easily detectable. The impacts of other forms of (local) innovation, such as civic, business, social, artistic innovations, are more difficult to trace. At the same time, as demonstrated in recent studies (Aarsæther Reference Aarsæther2004; Hall and Donald Reference Hall and Donald2009; Petrov Reference Petrov, Bathelt, Feldman and Kogler2011) these innovations have special importance in peripheral areas where purely technological innovations may be limited. Local innovations in their variety of forms may deliver a new path creation through scientific, institutional, economic and social shifts that allow for inventing or adopting new knowledge (Bassanini and Dosi Reference Bassanini, Dosi, Garud and Karnoe2001). The centrality of local innovation (broadly conceived) in regional reinvention in the periphery, in terms of breaking with path–dependency has already been demonstrated in empirical studies (Aarsæther Reference Aarsæther2004; Jauhiainen and Suorsa Reference Jauhiainen and Suorsaa2008; Virkkala Reference Virkkala2007).
Whereas the importance of the CC in regional development and endogenous growth is hard to dispute, the research into this subject largely ignores regions outside the core metropolitan areas. As argued by Petrov (Reference Petrov2007, Reference Petrov2008, Reference Petrov, Bathelt, Feldman and Kogler2011), although the preoccupation with large urban regions reflects the concentration of the CC in metropolitan areas (Florida Reference Florida2002; Gertler and others Reference Gertler, Florida, Gates and Vinodrai2002; Polèse and Tremblay Reference Polèse and Tremblay2005), it unjustly marginalises peripheries as study sites. Instead, it can be argued that the importance of the CC for economic development is also true in non–metropolitan contexts. Moreover, there are indications (Copus and Skuras Reference Copus, Skuras, Vaz, Morgan and Nijkamp2006; Petrov Reference Petrov2008; Reference Petrov, Bathelt, Feldman and Kogler2011) that the CC is likely to play an important role in the regional transformation of remote areas, including the Arctic.
The importance of creative individuals in innovative processes in remote areas was demonstrated in a number of studies from different regions (Aarsæther Reference Aarsæther2004; Copus and Skuras Reference Copus, Skuras, Vaz, Morgan and Nijkamp2006; Doloreux Reference Doloreux2003; Jauhilinen and Suorsa Reference Jauhiainen and Suorsaa2008; Hayter and others Reference Hayter, Barnes and Grass1994; Hall and Donald Reference Hall and Donald2009; Petrov Reference Petrov2008, Reference Petrov, Bathelt, Feldman and Kogler2011). Some of the above researchers have observed that less favorable business and social environments amplify the importance of creativity and require individual innovators and firms to be more creative than in the core. Looking at results of CC analysis in the Canadian north and other similar reports, Petrov (Reference Petrov2008) argued that it is now sufficient evidence to suggest that the availability of CC improves the prospects for future economic transformation and development in the periphery.
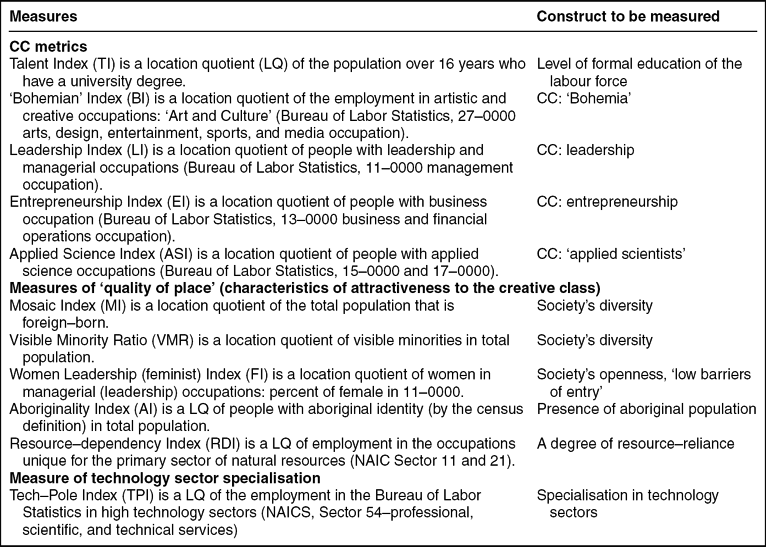
Petrov (Reference Petrov2007, Reference Petrov2008) differentiates four types of creative capital in the Arctic: technology workers (applied scientists), ‘bohemia’ (artists, craftsmen, etc.), leaders (people with leadership and managerial occupations), and entrepreneurs (see all definitions in Table 1). All of these groups may contribute to transforming the region's future by participating in various types of civic, economic, political and cultural activities. From the positions of economic development, each of these types of CC utilises its creativity to produce innovations (in the widest reading of this term) that generate economic returns. Petrov (Reference Petrov, Bathelt, Feldman and Kogler2011) provided examples of various innovations in the periphery and their connections to CC and other kinds of societal capital (social, civic, etc.) using case studies from northern Ontario.
Description of the metrics

Note: The formula for calculating a location quotient (LQ) is:  $LQ_i = \frac{{\lambda _n}}{{\lambda _C}}$, where LQi is a location quotient of phenomenon i (occupation, education, etc.), is the share of population having the measured characteristic i in region n and λC is the share of population having the same characteristic in the reference region (USA).
CC is only one ingredient of the regional economic and knowledge–production systems. Resources, institutional settings and other structural factors within a regional economic system exert great influence on the processes of CC accumulation and utilisation. Previous research in metropolitan areas and initial findings in the nonmetropolitan context (Aarsæther Reference Aarsæther2004; Petrov Reference Petrov, Bathelt, Feldman and Kogler2011; Doloreux and Parto Reference Doloreux and Parto2005; Jauhilinen and Suorsa Reference Jauhiainen and Suorsaa2008) demonstrated the effects of institutional frameworks, legal and organisational systems, as well as social, civic and other forms of societal capital on CC's strength and dynamics. It is also important to consider the interdependence between CC and the demographic characteristics of population, since CC is affected by occupational, educational, employment, and consumption age and gender differentials and varying migration propensities. Lastly, given data availability, considerable attention should be paid to both internal and external links associated with CC and local innovation system in general to account for spillovers, global ‘cables’ (or ‘pipelines’) and other spatial forms of knowledge transfer and exchange of ideas.
The idea of the CC as an alternative driving force of economic development in the Arctic is also appealing since it provides a way to reconcile the realities of capitalism (which Arctic is inevitably facing) and local modernities, which rely on arctic communities’ endogenous capacities and often take their roots in traditional cultures. Due to the endogenous nature of the CC–based development and its lesser vulnerability to decoupling and marginalisation effects (typical for Arctic economies) CC–driven development is an enabling process that not only brings prosperity, but also empowers communities to define their own economic destiny.
Data and methods
Much of the CC literature is devoted to developing two sets of measures: one to quantify existing CC and another to measure its pull–factors (Florida Reference Florida2002; Gertler and others Reference Gertler, Florida, Gates and Vinodrai2002). Accordingly, a set of indicators for this study also consists of two groups (Table 1): measures of the CC and measures of the ‘quality of place’ (or of a place's attractiveness to the CC). We define traditional indicators in both groups in the manner suggested by Gertler and others (Reference Gertler, Florida, Gates and Vinodrai2002), with the exception that the indices are taken as location quotients (Petrov Reference Petrov2008, Table 1). We also use the Tech Pole Index (TPI) as a proxy of region's specialisation in high technology sectors (Table 1). The TPI is calculated here as a location quotient of the employment in North American industry classification system high technology sectors.
Following Petrov (Reference Petrov2007, Reference Petrov2008) we consider four groups of creative class: technology workers (applied scientists), bohemia (artists, craftsmen, etc.), leaders and entrepreneurs. As argued elsewhere (Petrov Reference Petrov2007), this four sector representation of the creative class in the most appropriate in the periphery since it accounts for different modes of creativity, which all are important for spurring economic development in remote regions. The four sector model is more inclusive of creative activities not bounded by formal education and involved in broadly defined community innovations. Each group is characterised by a corresponding index (see Table 1): applied sciences index (ASI), ‘Bohemian’ index (BI), leadership index (LI), and entrepreneurship index (EI). As in other similar studies, CC indices are primarily based on occupational characteristics. The Alaskan data are collected by the Alaska Department of Labor using the unemployment insurance records. Although it is a very high quality source of information about occupational status of Alaska residents, it has some limitations, as it records only one occupation per person, defines occupations based on a preset standard scheme, as well as omits those workers who are not part of unemployment insurance (for example the self–employed). These limitations must be considered in the analysis as they may lead to the underestimation of CC. When comparing with Canada (where we use 2006 census data), it may also mean that the Alaska indices may well be depressed.
In the following analysis, we first computed, tested and analysed the indices that characterise the creative class in Alaska's 27 boroughs. The largest borough in Alaska is the municipality of Anchorage (260,000) followed by the Fairbanks North Star borough (93,000); the smallest borough is Yakutat (808). Most boroughs include more than one community and therefore could be further disaggregated. However, the quality and availability of data at this spatial level declines (including the small numbers problem). As a result, we chose to keep boroughs as the primary unit of analysis roughly compatible with Canadian census subdivision (for comparison purposes since similar studies in the Canadian north used subdivisions (Petrov Reference Petrov2008)). All data for the current analysis pertaining to population counts, occupations and employment were obtained from the Alaska Department of Labor and Workforce Development databases.
All indices calculated for the Alaskan boroughs were compared to those for the two control regions, the United Sates and three Canadian territorial centers (Whitehorse, Yellowknife and Iqaluit, which are also the leading creative communities in the Canadian north (Petrov Reference Petrov2008)). Then we computed the indicators of attractiveness and studied them in a similar manner. To analyse the relationships among indices, between and within the two groups, both correlation and principal components analyses were performed.
The first objective of this analysis was to compare the behaviour of the creative capital metrics in Alaska to their expected behaviour as described in the literature for US and Canada (Florida Reference Florida2005; Gertler and others Reference Gertler, Florida, Gates and Vinodrai2002), and, in addition, with the metrics behavior in the Canadian north (Petrov Reference Petrov2007, Reference Petrov2008). These comparisons are necessary to establish whether the relationships between CC, ‘quality of place’ characteristics, and development are present in Alaska. In other words we need to conclude whether CC metrics (which were originally developed for other regions) provide valid and reliable measures in Alaska's context. This analysis would also reveal any systematic differences between Alaska and northern Canada, and between Alaska and the rest of the USA.
The next stage of the analysis was to utilise the metrics to describe the geography of the creative capital in the state, identify its clusters (overall and for each of the four components) as well as spatial variation of the region's attractiveness. Alaska boroughs were ranked using both the creative capital and attractiveness measures. Two composite rankings were produced: one by combining equally–weighted individual rankings of the creative class indices (TI, LI, EI, BI and ASI), and second by combining rankings of the ‘quality of place’ indicators (MI, FI, VMR, RDI, and BI). We identified leading regions (‘creative hot spots’) and those lagging behind. Finally, we conducted a cluster analysis (k–means method) to detect the extent of typological heterogeneity within the dataset. At every stage we compared our findings with earlier observations published for northern Canadian territories (Petrov Reference Petrov2008) to compare and contrast the two Arctic regions.
This study relied on the Alaska Department of Labor and Workforce Development database (Alaska Local and Regional Information – ALARI). All occupational and employment data used in this study pertains to 2008. We resorted to the most recent available census (2000) for other population statistics, including ethnic composition and educational attainment, since the census of 2000 provides the most exhaustive dataset. However, both labor statistics and census are not ideal data sources as they rely on official employment records and standardised industry and occupation descriptions, which may or may not be entirely accurate in the northern context. In addition, once again, it is important to keep in mind data reliability limitations typical for socio–economic research in sparsely populated areas. In this study we mitigate the latter problem by using more aggregated units of analysis, where the erratic data problem is less probable.
Results and discussion: creative capital characteristics and geography in Alaska
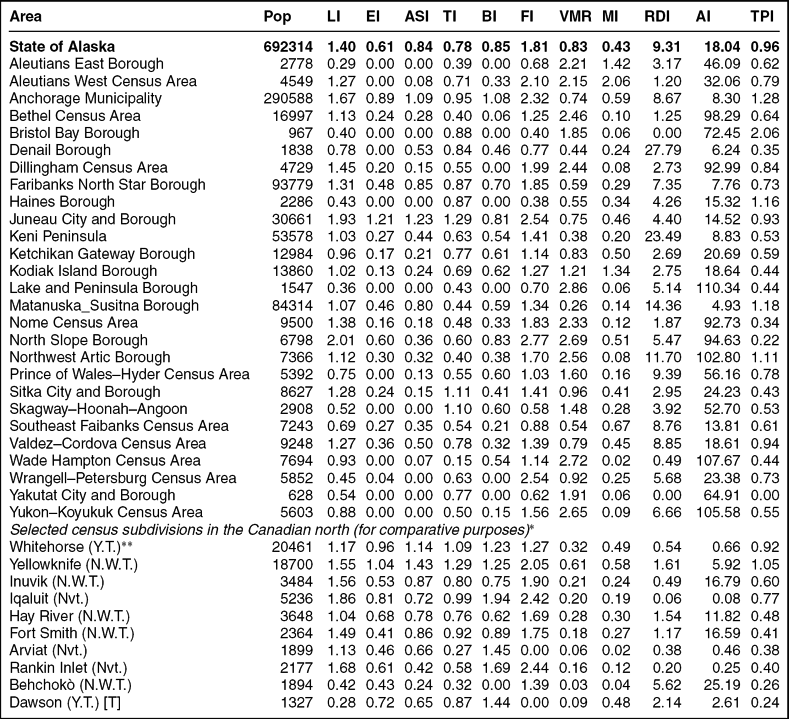
Table 2 contains creative capital and attractiveness indicators for 27 Alaska boroughs, the state of Alaska and the 10 largest census subdivisions of the Canadian territories (the latter are used for comparison purposes, but should be considered with caution since the indices for Canadian places were derived using Canadian definitions and data (Petrov Reference Petrov2008)). Firstly, it is interesting to note that the state of Alaska has relatively weak CC. All but the leadership index (LI) are below one indicating lower–than national concentration of creative occupations and educated labour force. The talent index (TI) is only 0.78, applied science index is 0.84, and the entrepreneurship index (EI) is even lower (0.61). These results are indicative and not unexpected. At the same time, Table 2 provides evidence of dramatic regional differences within Alaska, where some regions demonstrate high concentrations of CC while others have exceptionally weak CC presence.
CC and attractiveness indicators
Notes: * Canadian data is used for comparison purposes only. They should be considered with extreme caution, since the indices are derived using Canadian definitions and statistics, which differ from those in the U.S. (see Petrov Reference Petrov2008)); ** N.W.T. – Northwest Territories, Nvt. – Nunavut, Y.T. – Yukon Territory.
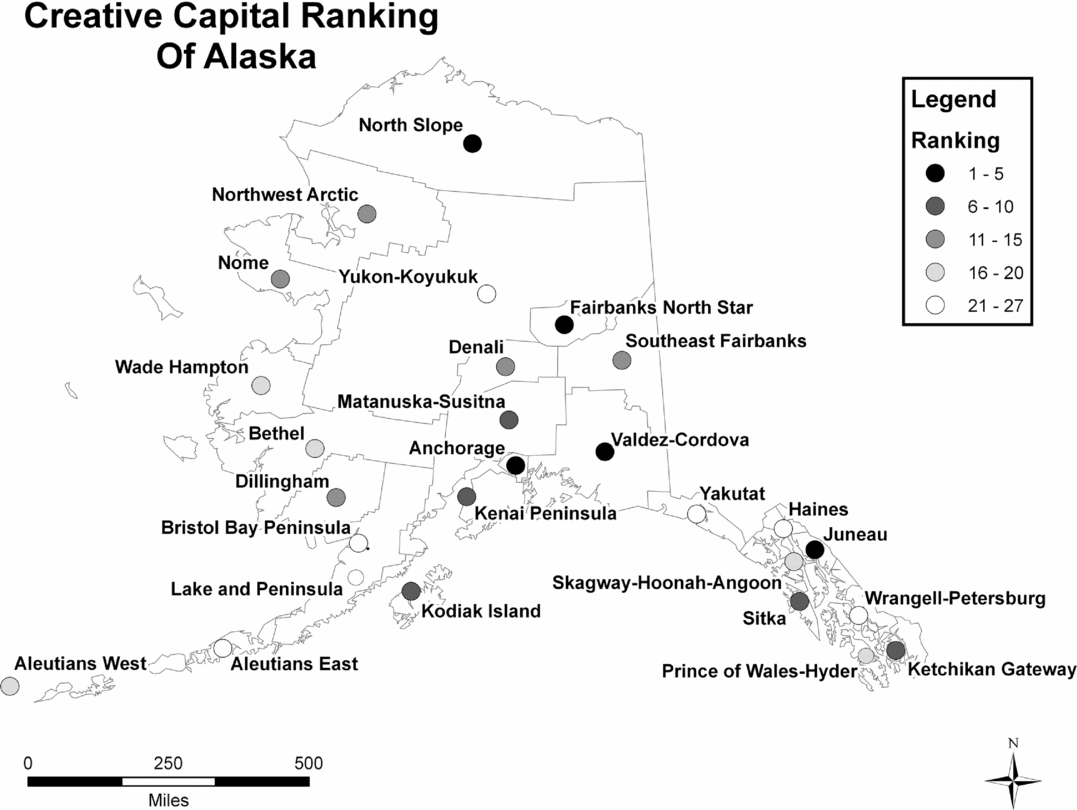
The talent index (TI) in Alaska exhibits a pattern typical for other northern jurisdictions (for example the Canadian territories). The TI approaches or exceeds 1.0 (US average) in the capital (Juneau) and surrounding regions. Here, similarly to Whitehorse and Yellowknife in Canada (Table 2), we observe a concentration of residents with high levels of formal education. Most, probably, are public employees. Fairbanks and Anchorage areas follow the capital region with well educated populations. In contrast, most rural regions in Alaska demonstrate a very low talent index. In other words, very few people with bachelor degree or higher live in remote communities. Interestingly, the North Slope Borough has a slightly higher TI than less northern boroughs in central Alaska, likely because of the influx of temporary migrants employed in extraction industries (Fig. 1).
CC indices in Alaska's regions
The Applied Science Index (ASI) reflects the relative concentration of people with occupations in applied science and technology. The ASI is most closely related to the TI and the traditional understanding of the CC as associated with high–tech industries. Not surprisingly, the three boroughs with larger urban centres have high levels of the ASI comparable to those in Yellowknife and Whitehorse. The outlying areas of Alaska demonstrate extremely low stock of people with science and technology occupations.
The Bohemian Index (BI) has originally been considered among the ‘quality of place’ indicators (Florida Reference Florida2005). However, in the context of the peripheries it is also used to measure the ‘artistic capital’ as a separate category of CC, which has a special importance in northern regions given the prevalence of native arts and crafts (Petrov Reference Petrov2008). In Alaska high BI readings are registered in two completely different types of regions: larger city–regions (Anchorage and Juneau) and the North Slope. This most likely reflects two distinct types of ‘bohemia’ that co–exist in the state: the native American ‘bohemia’ in the very north and urban ‘bohemia’ in the urban south (however, many northern/native American artists and craftsmen also reside the south). This combination creates an intricate geography of Alaskan ‘bohemia’ and warrants further in–depth analysis of this phenomenon.
The Leadership Index (LI) was developed to measure the availability of leadership capital in northern communities (Petrov Reference Petrov2007, Reference Petrov2008). The role of political and civic leaders in economic development of Arctic communities can be considerable given their close involvement with local businesses and access to capital (for example in the form of government assistance programmes). Typically, high LI is registered in capital and central cities, but also in communities with strong self–governance. Alaska is not an exception: Juneau and Anchorage have the greatest LI. The LI is also very high in the North Slope Borough, and 11 more regions have LI higher than the USA average. At the same time, there are regions that clearly lack the leadership capital. They include most boroughs in the Alaska panhandle, the Aleutians, and the inland regions of Alaska.
The Entrepreneurship Index (EI) that measures relative concentration of residents in entrepreneurial occupations, has distribution that closely follows larger cities and the capital. Entrepreneurial capital is heavily present in Anchorage and Juneau. This, as in the case with the TI and the ASI, reflects a pattern of CC overconcentration in centrally located hubs and lack of entrepreneurial capacities in the state's periphery. There is a geographic disconnection between the entrepreneurial and other forms of the CC (for example bohemian) associated with these areas and its native population. This disconnection is observed in other northern jurisdictions (Petrov Reference Petrov2008).
The Tech–Pole Index (TPI) demonstrates that very few Alaskan boroughs have a considerable concentration of high–tech employment and specialisation in technology–intensive industries. With the exception of Bristol Bay and northwest Alaska all of these regions are concentrated in the southern and southeastern portion of the state around Anchorage and Juneau. Even there, the TPI values are not very high, but are comparable with, or exceeding, those found in the Canadian territorial capitals (Table 2). Similarly to northern Canada, the high–tech employment is a very limited, if not too narrow, indicator of knowledge production (although it is the only one available). It is certainly related to particular forms of creativity (that is applied science) and, therefore, is unable to characterise the value or volume of creative activities of a different nature (for example cultural). In this respect, the TPI should be considered in our analysis with caution.
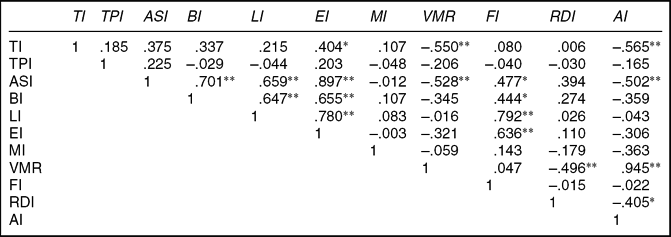
In accordance with the adopted methodology, correlation and concordance coefficients were used to assess the consistency (reliability and validity) of the CC measures and to analyse statistically the relationships among them. Correlation coefficients illustrated close associations (Table 3) among different creative class indices that were a probably a sign of reliability of these measures. Reliability was also confirmed by the high degree of concordance demonstrated by new indices (Kendall's coefficient of concordance 0.66). In addition, theoretically expected correlation of the CC measures with the well–established ones (used in previous studies, that is the BI and, to some extent, the TI) signaled that new indices possessed necessary validity (the lack of significance in some of the correlations may be attributed to a rather small sample size (27), but even in these cases correlations have expected signs). Both results are very similar to those reported for the Canadian northern communities (Petrov Reference Petrov2008).
Correlation Matrix
* Correlation is significant at the 0.05 level (2–tailed); ** Correlation is significant at the 0.01 level (2–tailed).
See notations in text.
The evidence from the correlation matrix (Table 3) supports the notion introduced by Petrov (Reference Petrov2008) that different groups of the creative capital are clustered in space. ASI, BI, LI and EI are strongly correlated. Elsewhere we already alluded to an idea of a synergy among four CC components as key for deploying local creative capacities for economic success. Four creative class groups attract each other and reinforce a region's innovative potential. Separated or disjoined, these components are much less powerful or even fruitless, because regional development (or a new path creation) may require simultaneous deployment of various modes of creativity and types of innovation (see Petrov Reference Petrov, Bathelt, Feldman and Kogler2011).
Overall, evidence suggests that the associations among indices closely resemble those in other northern regions and at the national level, thus indicating that the creative capital ‘logic’ is applicable in the Alaska context. The coincidence of associations indicates that the major relationships are upheld, and the behaviour of the creative class metrics is very much alike those of the rest of the country.
A notable deviation from the national studies in the USA and Canada and from the results in northern Canada is the absence of significant relationship between the specialization in high technology industries (TPI) and any of the CC indices (including the TI). It is, indeed, surprising, since typically TPI is correlated with well–educated and abundant human capital. In Alaska high–tech activities appear to be unrelated to local educational attainment or CC (although, as shown later, the TI and the TPI still have considerable covariance). The concentration of high–tech employment is, perhaps, governed by other factors such as location of government agencies and universities. It seems then that at the regional scale the TPI as a measure of economic development may not be useful in the Alaskan context. However, it may still be useful at more disaggregated levels of analysis (something that should be tested in the future).
In terms of the ‘quality of place’ indicators (Table 3), Alaskan data reinforces observations from other northern regions (Petrov Reference Petrov2008) that traditional diversity indicators (the Mosaic Index and Visible Minority Ratio) fail to be reliable predictors of CC in the Arctic. In addition to the fact that peripheries simply lack foreign–born populations, most visible minority population here is represented by the native Americans and may not necessarily be an indicator of diversity in a way envisioned by the CC theory. In contrast, a robust performance of the FI (Women Leadership/Feminist Index) is expected: strong women leadership (which may be considered a good indicator of society's openness and tolerance (Petrov Reference Petrov2007)) is associated with the strong CC (this relationship works all four types of CC). This is the same strong connection reported in the Canadian north (Petrov Reference Petrov2008).
Surprisingly, the Aboriginality Index specifically designed to consider the relationship between the concentration of native residence and CC did not prove to be a viable indicator of a place's attractiveness to the creative class. In other words, in Alaska aboriginality is not related to any particular type of creativity. This could be contrasted to northern Canada, where a link was found between the ‘Bohemian’ index and aboriginality (Petrov Reference Petrov2008). A possible explanation of this phenomenon is a relatively small share of native population in Alaska when compared to the Canadian territories and a more aggregated scale of analysis (boroughs vs. census subdivisions).
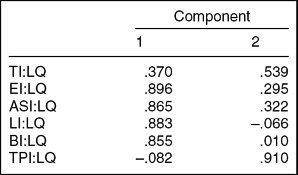
To understand better the interrelationships among CC indices and between them and the ‘quality of place indicators’ we performed principal components analysis (PCA). PCA helps to identify covariance within the dataset and to find latent vectors. Whereas in this case the number of variables is rather limited, PCA is still an important tool for looking at variables’ covariance and possible groupings. Table 4 reports PCA results for all CC indices and selected ‘quality of place indicators’, which demonstrated evidence of correlation with CC indices (Table 4).
Creative capital metrics principal components
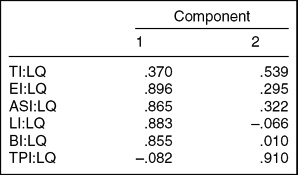
Extraction method: principal component analysis.
Rotation method: Varimax with Kaiser normalisation.
From Table 4 it is clear that there are distinct principal components (with eigenvalues exceeding 1.0). The first component is most closely associated with four occupation–based CC indices: LI, BI, EI and ASI all have high factor loadings. This shows that CC indices exhibit a considerable covariance, additional evidence to the argument that CC tends to cluster and the synergies among different groups of the CC are vital for its accumulation. However, some CC indices also have considerable loadings on another component. Notably the TI is not heavily loaded on component one, but rather has the highest factor loading on component two, which also has high loadings for the TPI and moderate loadings for ASI and EI. Component two, therefore, reflects the ‘formally educated’ CC and demonstrates its connections with technology production (TPI) and two occupational CC indices (that include occupations more dependent on formal education, such as applied science). Note that BI and LI have remarkably weak loadings on this component reflecting a disconnection between formal education and these types of creativity (pointed out earlier in the Canadian north (Petrov Reference Petrov2008)).
Creative capital rankings and groupings of Alaska regions
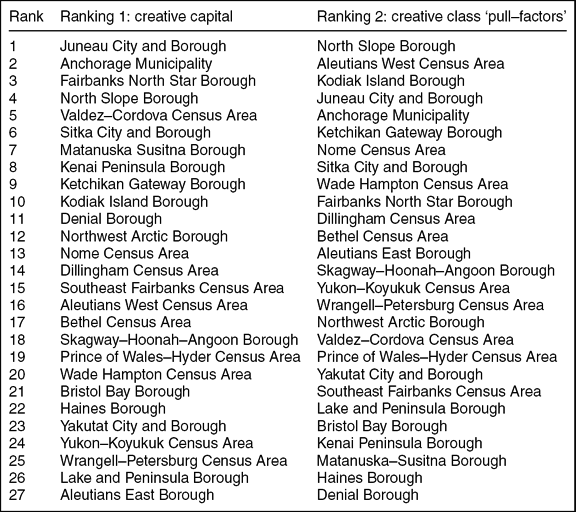
Since the CC metrics in Alaska exhibit expected relationships with traditional measures and correlations among indicators appear to be consistent with the CC ‘logic,’ it is possible to proceed with a preliminary analysis of the CC accumulation in the state. Table 5 contains two rankings of 27 boroughs. The cumulative ranking of Alaska boroughs based on five equally weighted creative capital indices (TI, ASI, BI, LI, and EI) is presented in Table 5 and Figure 2. Not surprisingly, the highest ranked regions in terms of the concentration of CC are mainly the urban areas of Juneau, Anchorage and Fairbanks. This pattern strongly resembles the Canadian north where three territorial capitals and largest cities are also the top–ranked creative capital hubs. However, the fourth place in Alaska is taken by the North Slope Borough, the most northern of the state's boroughs. A strong performance of the North Slope points to the fact that remote areas may have considerable concentrations of creativity. Here the creative capital is not only related to the presence of educated workers in extraction industries, but to local aboriginal creativity and leadership resulting in high BI and LI. It also reveals an intriguing pattern when physical remoteness may be a positive factor for the creative class, because it stimulates local leadership and entrepreneurship and the rise of ‘domestic’ creative class, including aboriginal (note that CC ranking for many central and northern Alaska rural boroughs is higher than in more southerly located rural regions (Figure 2)).
CC/class ranking of Alaska regions
CC ranking of Alaska regions
The second group of boroughs (5–10th place) included primarily southern Alaska around Anchorage (Valdez–Cordova, Matanuska–Susitna, and Kenai) and on the panhandle (Sitka and Ketchikan Gateway). These regions have limited CC, but still are in the top 10 statewide. The rest of Alaskan boroughs have relatively little CC.
The ‘pull factor’ or attractiveness ranking (Table 5) is computed by combining individual pull–factor rankings (MI, FI, VMR, RDI, and BI which, again, were given equal weights). Seven out of ten boroughs with the highest CC ranks also earned high ranks in terms of attractiveness (or ‘quality of place’). In other words, a strong CC coincides with top levels of attractiveness. The only surprise was the high ranking of Kodiak Island and Aleutian West. These results reiterate the unevenness in the distribution of the pull–factors in Alaska. However, they also point to several regions, which could potentially be sustainable clusters of CC.
Both rankings (Table 5) illustrate an uneven geography of the CC in Alaska. Although supporting the general finding, which pointed to higher–than–expected levels of the CC accumulation and availability of pull–factors in the state, the analysis shows that only few boroughs are CC hubs. Many of the leading places (albeit not all) are economically or politically privileged regions. These and other typological differences in the sample are also intuitively evident. For example, both creativity and attractiveness indicators reveal the advantage of larger communities. The state's largest cities are more diverse and economically vibrant places, almost like miniature versions of Richard Florida's creative cities. They dwell on their thriving public sector that creates high–skilled well–paid jobs and a dynamic social environment, both being attractive to the creative class. Some regions with a high proportion of aboriginal population usually exhibit good standing on the ‘Bohemian’ Index (that effectively measures the cultural economy potential), but perform rather poorly in terms of technical occupations and the formal educational level of population.
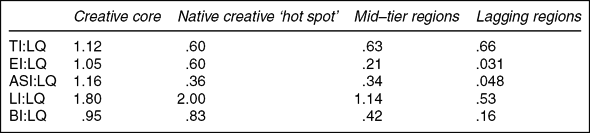
In order to further investigate the geography of the CC in Alaska, and, in particular, identify typological differences among Alaska regions, we performed cluster analysis. A two step cluster analysis procedure included, firstly, agglomerative (hierarchical) clustering (to determine the number of cluster centres), and, secondly, k–means clustering. Hierarchical clustering showed that boroughs form four distinct groups, and, therefore, four clusters were sought in the k–means analysis.
Table 6 presents the aggregate CC characteristics of identified region–groupings. The first group includes boroughs that have exceptionally high CC accumulation: CC indices either at par or that exceed US baseline (1.0). Not surprisingly, the group consists of two regions: Juneau and Anchorage. They represent the creative core of Alaska (note that this again illustrates an earlier observation that different groups of the CC tend to cluster together). The second group incorporates only one region, the North Slope Borough. Not very high levels of formal educational attainment and occupation in science coincide here with very high leadership capital and considerable bohemian and entrepreneurial capital. It appears that the North Slope Borough represents an unexpected combination of CC characteristics, and is a ‘creative hot spot’ in Alaska. Partially, this can be attributed to the creative potential of local native Americans. Similar high positioning of native communities in terms of creative capital has been previously observed in the Canadian north (Petrov Reference Petrov2008). The third cluster comprises 14 regions with modest CC. These are boroughs that still have considerable leadership capital, but lack entrepreneurial and other types of CC. The last group represents ten regions lagging behind in virtually all creative class indicators. These are the outsiders, where the potential for economic development based on internal creative capacities is minimal.
CC characteristics of typological groups (clusters)
Conclusions
A study of the CC in the Arctic is an important step in identifying alternative economic development options in the circumpolar region. These new approaches utilise endogenous resources and local capacities of Arctic communities in order to reconcile capitalism and local modernities of the Arctic. Whereas a stylised notion is that human capital in the Arctic is underdeveloped, this representation no longer reflects the variability and diversity of arctic regions, some of which, as shown by the recent research (for example Aarsæther Reference Aarsæther2004; Copus and Skuras Reference Copus, Skuras, Vaz, Morgan and Nijkamp2006; Petrov Reference Petrov2007, Reference Petrov2008), demonstrate substantial levels of CC accumulation. On the other hand, there is a strong theoretical argument that CC is critical for economic development and socio–economic transformation in the periphery as it often becomes the engine of economic reinvention and revitalisation of a region. Therefore the structure, characteristics and geography of the CC in the Arctic are becoming the subjects for a thorough investigation. This paper presented an analysis of CC in Alaska.
The results of this analysis demonstrate both a considerable potential and substantial shortage of the CC in Alaska alongside with a strong regional differentiation. The results also are mostly similar to patterns of CC in other northern jurisdictions, for example in northern Canada. CC in Alaska exhibits the tendency to cluster, and coincident concentration of different CC types is clearly advantageous for Alaskan regions. At the same time, the main problem in many areas is the disconnection between creativity, education and entrepreneurial capital, a pattern reported elsewhere in the north. The latter makes it more difficult for Alaskan communities to ‘deploy’ their creative capacities and start realising their CC (for example build a viable cultural economic base).
Overall, this study found the higher–than–expected levels of the CC accumulation and availability of pull–factors in Alaska (although still quite low compared to the continental US creative hubs). However, the analysis shows that only few regions are CC hot spots. Many of the leading places (albeit not all) are economically or politically privileged boroughs, which encompass the state's capital and its largest cities (Anchorage and Fairbanks). These hot spots are, perhaps, nationally competitive in terms of attracting the CC. They are places where the creative potential is high, and where the community's efforts to embrace new economic trajectory would be the most fruitful.
In addition, the analysis found that some CC groups concentrate in regions outside the state's core. For example, the North Slope has considerable concentration of the aboriginal ‘bohemia’ – artists, craftsmen, performers, etc. As a result this very remote region ranks high on CC and attractiveness indicators. It appears that ignoring this endogenous development potential (in contrast or in addition to the massive resource–based development in the region) is no longer acceptable.
Coming back to the conceptual discussion in the outset of this paper, it is important to point out that our findings, while being in line with the overall ‘creative capital theory’, counter some stylised representations and illuminate peculiar role, structure and geography of the CC in remote, peripheral areas. Peripheral regions demonstrate the associations among CC indices closely resembling national patterns (thus indicating that the CC ‘logic’ is applicable in the peripheral context). The coincidence of statistical associations indicates that the major relationships are upheld, and the behaviour of the creative class metrics is very much alike that in the rest of the country. At the same time, there are important differences, which emphasise the unique place of peripheral areas in the CC theory. Below we allude to major emerging theoretical themes in CC research in rural and remote areas, to which this paper provides empirical substance.
Clustering and synergy of CC in the periphery: correlation coefficients illustrate close associations (Table 3) among different creative class indices that were a likely sign of reliability of these measures. Different groups of the CC are clustered in space. ASI, BI, LI and EI are strongly correlated. Different types of CC attract each other and reinforce region's innovative potential. Separated or disjoined, these components are much less powerful. Although this study does not provide direct evidence of that, it is likely that a local synergy between CC and social capital (contrary to the metropolitan notion of the ‘weakness of strong ties’) is an important component of economic success. In addition, a strong CC coincides with top levels of attractiveness. The idea here is that ‘creative synergy’ is a critical condition for utilizing local creative capacities.
Peripheral disconnection: geographic disconnection between the entrepreneurial and other forms of the creative capital.
Uneven geography and differentiation: we reveal a very uneven geography of the CC in Alaska with strong concentrations. Based on empirical evidence we also develop regional typology of Alaska borough, generally similar to the Canadian north. It is characterised by the dominance of economically privileged, larger communities. As in Canada we find native ‘creative hubs.’
Possible ‘positive impacts of remoteness’ on CC accumulation (for example Copus and Skuras Reference Copus, Skuras, Vaz, Morgan and Nijkamp2006; Petrov Reference Petrov2008): remote areas (for example the North Slope Borough) may have higher concentration of CC than less northern boroughs. This phenomenon while primarily caused by the influx of temporary migrants employed in extraction industries, may also indicate a higher level of creative potential, independence and self–reliance of remote areas compared to less remote peripheries. Remote settings may also be more attractive to creative individuals and provide better conditions for retaining local creativity (such as indigenous cultural economies).
Bifurcation of ‘Bohemia’: BI is high in larger city–regions (Anchorage and Juneau) and the North Slope, which reflects two distinct types of ‘Bohemia’ that co–exist in the state: the native and the urban. These two groups have dissimilar characteristics and require different conceptual and analytical approaches to their study.
Irrelevance of traditional diversity indicators of quality of place for CC accumulation in the Arctic has been shown in earlier studies (Petrov Reference Petrov2007, Reference Petrov2008). Instead the Women Leadership Index once again appears to be a more apt indicator of ‘openness’ and ‘low barriers of entry’ in a northern society.
Lastly, we share the sentiment expressed by others (Aarsæther Reference Aarsæther2004) that innovation in the periphery may require more creative effort, originality and ingenuity to overcome barriers and capacity shortages than in central areas. We can also argue (although evidence is still more anecdotal than systematic) that innovation (and even individual acts of innovation) in the periphery can have stronger impact on community's/region's economic path, and can be more pivotal for a ‘new path creation’ for a given remote locale.
Analysis presented in this paper warrants a more exhaustive study at a community (rather than regional) level and, if possible, using more detailed occupational data. There is more to learn regarding the role of distance and proximity, regarding the importance of pull and push–factors (such as harsh environment, housing problems and isolation) for CC accumulation. Future research should also consider possible negative externalities of creative economies, such as economic inequality, housing affordability, environmental impacts, over–consumption, and political infighting.
Acknowledgements
We are grateful to our colleagues at the Arctic Social and Environmental Systems Research Laboratory and the anonymous reviewers for their valuable comments, which helped to improve this paper. This research is supported by NSF grant ARC Number 0909403.