I. INTRODUCTION
Owing to vanadium's variable oxidation state, many different phases of vanadium oxide exist. In addition to stoichiometric variation, different polymorphs for the same chemical formula are observed, further extending the possible phases of vanadium oxide. Such a rich variety of stoichiometries and structures ultimately has an impact on the observed properties and performance of these materials. For the vanadium oxide point-compound having the chemical formula vanadium dioxide (VO2), metal–insulator transition (MIT)-type behavior has been observed. These so-called MIT materials display radical changes in electrical and optical properties as a result of a structural phase transition. For example, a phase transformation (monoclinic-to-tetragonal) in VO2 at ~70 °C displays a 104–105 magnitude increase in electrical conductivity (Lu et al., Reference Lu, Li and Yin2011). Concurrent with the change in electrical conductivity is a corresponding change in optical properties (Yang et al., Reference Yang, Ko and Ramanathan2011). In particular, the monoclinic VO2 phase displays good optical transmission in the visible and near-infrared (IR) ranges. In contrast, the tetragonal form (above ~70 °C), shows a very sharp decrease in the IR transmittance. These dramatic and reversible property changes can be tailored into engineering applications, such as optical switches (Briggs et al., Reference Briggs, Pryce and Atawater2010), sensors (Yang et al., Reference Yang, Ko and Ramanathan2011), and window coatings (Manning et al., Reference Manning, Parkin, Pemble, Sheel and Vernardou2004). Figure 1 shows the crystal structures of the VO2 MIT-paired phases. At room temperature, VO2 displays a monoclinic structure (Longo and Kierkegaard, Reference Longo and Kierkegaard1970) as shown on the left side of Figure 1. This monoclinic phase, hereafter referred to as VO2 (M), is characterized by alternating V–V distances within the lattice; the structure shows a short V–V distance (2.62 Å) and a relatively long V–V distance (3.17 Å). The differing V–V bond lengths affect the electronic band structure, resulting in semiconducting behavior for the VO2 (M) compound (Lazarovits et al., Reference Lazarovits, Kim, Haule and Kotliar2010; Lu et al., Reference Lu, Li and Yin2011). In contrast, the tetragonal form of VO2, shown in Figure 1 (right), has a more simplified Rutile-type structure (Rogers, Reference Rogers1993) and uniform V–V bond distances (2.87 Å). This tetragonal VO2, hereafter referred to as VO2 (T), displays low electrical resistivity as well as a decrease in transmission of the near-IR wavelengths (Lu et al., Reference Lu, Li and Yin2011).
(Color online) Monoclinic VO2 (left) showing two distinct V–V bond distances, and tetragonal VO2 (right) displaying the Rutile-like structure and single V–V distance. See text for details.

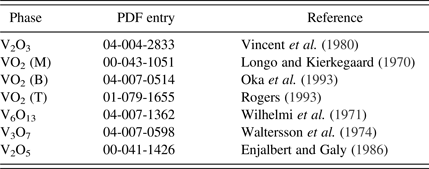
The suppression of IR transmission with temperature makes VO2 an interesting material for smart window applications. Manning et al. (Reference Manning, Parkin, Pemble, Sheel and Vernardou2004) showed that tungsten-doped VO2 window coatings could suppress IR transmission at temperatures above the MIT transition. Of late, there has been interest in the synthesis of VO2 nanoparticles (Yamamoto et al., Reference Yamamoto, Kasai and Shimakawa2009; Lu et al., Reference Lu, Li and Yin2011) for fabrication of low-cost coatings for windows to passively reduce heat transmission. While nanoparticle synthesis has been successful, the demands concerning control of temperature and partial pressure of oxygen (pO2) during synthesis are evident in some of the more elaborate processing protocols. For example, the route described by Lu et al. (Reference Lu, Li and Yin2011) involves heat treatment of chemically prepared vanadium oxide precursor (VOP) powder to 300 °C in air to form V2O5, with subsequent reduction in H2 at 400 °C (forming V2O3) followed by an anneal in N2 gas at 400 °C to form the desired VO2 composition. The focus of our research effort regarding VO2 material synthesis has been to reduce the complexity of the processing protocols to a single processing schedule through the use of in-situ high-temperature X-ray diffraction (HTXRD) characterization. This technique ensures that the correct conditions for VO2 (T) stability and single-phase formation may be established. This understanding greatly reduces the complexity (and cost) of material synthesis. Herein, we describe the use of HTXRD to monitor the various phases that can form under differing time–temperature–pO2 conditions. To facilitate this discussion, Table I gives a summary of all the vanadium oxide phases observed in this paper, their corresponding powder diffraction file (PDF) entries (ICDD, 2012), and their structural references. In this way, there shall be no ambiguity regarding the compounds discussed.
Vanadium oxide phases observed and discussed within this paper.
II. EXPERIMENTAL
A. VOP synthesis
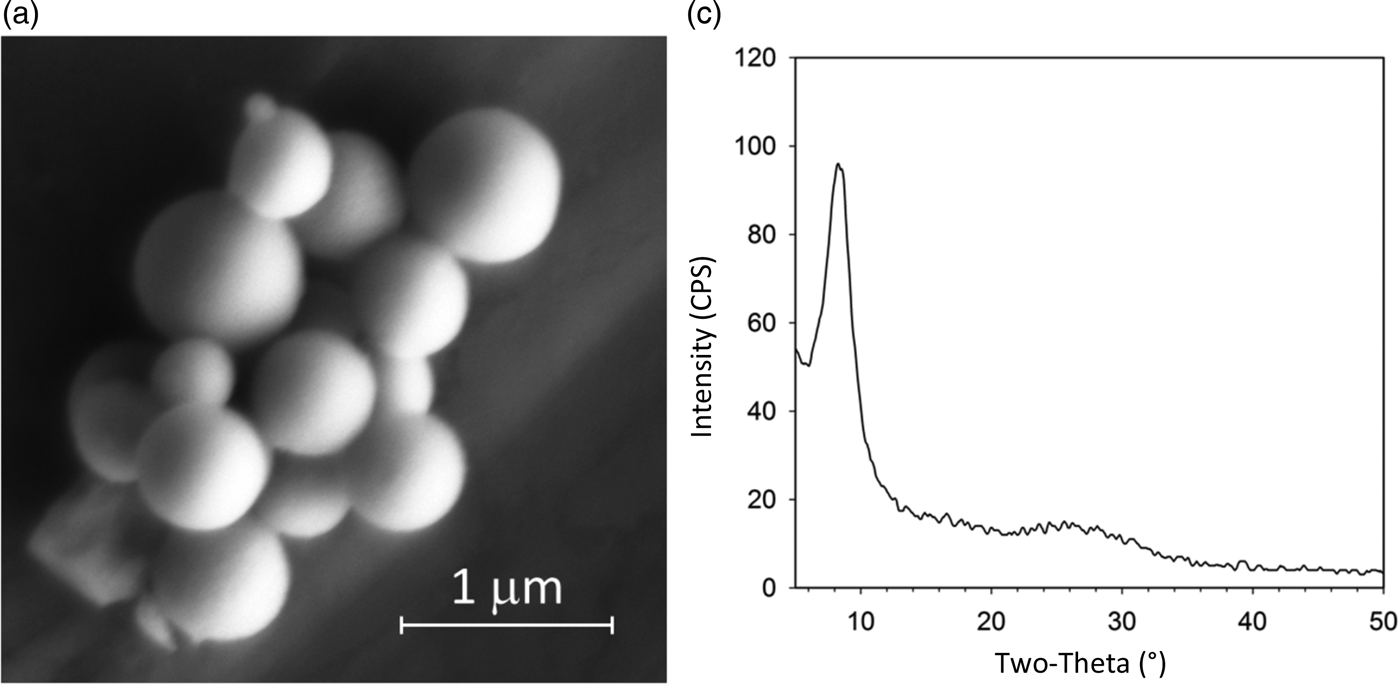
Vanadium (V) triethoxide (95%; Aldrich), anhydrous pyridine (99.8%; Sigma-Aldrich) and acetone (99.8%, extra dry; Acros) were all used as received. Deionized water was purified using a Millipore Synergy 185 system to 18.2 MΩ resistance. The precipitation procedure for monodisperse VOP particles was taken from Yamamoto et al. (Reference Yamamoto, Kasai and Shimakawa2009) and conducted within an argon-filled glove box. Pyridine (13 ml) was measured into a beaker, and 185 µl of vanadium (V) isopropoxide was added to create a yellow, transparent solution. A second beaker was used to mix 24 ml of acetone with 30 µl of water. A magnetic stir-bar was used for mixing in the acetone–water solution as the pyridine–vanadium solution was added by rapid pouring. An opaque, orange precipitate formed immediately. The solution was allowed to stir for 30 min, and then it was transferred to a polyethylene centrifugation tube, and removed from the glove box. The precipitate was recovered and washed using three cycles of centrifugation and redispersion using pure acetone. The final VOP powder was allowed to air dry overnight in an oven set to 90 °C. Scanning electron microscopy (SEM) of the VOP powder was performed using a Carl Zeiss Supra™ 55VP SEM (10–20 kV; 8.5 mm working distance). SEM images were employed to assess the morphology of the generated VOP precursor. Figure 2(a) shows an image of the dried VOP particles illustrating the anticipated spherical morphology and submicron size. Preliminary XRD analysis of the room temperature VOP material (prior to in-situ heat treatment) confirmed the observation of a broad diffraction peak at ~8.3° 2θ, characteristic of the nanocrystalline VOP material (Yamamoto et al., Reference Yamamoto, Kasai and Shimakawa2009); see Figure 2(b). This material was used in subsequent in-situ HTXRD analysis. It is worth noting here that timely harvesting and drying of the VOP precipitate (i.e. <3 h after precipitate formation) was necessary to assure the spherical shape of the nanocrystallite particles and observe the broad 8.3° 2θ peak in the initial XRD pattern. If harvesting was postposed, recrystallization of VOP material occurred and the spherical morphology was lost in favor of larger single crystals (>1 µm) with a bladed morphology.
Characterization of vanadium oxide precursor (VOP) powder. (a) SEM image of dried VOP powder showing spherical morphology. (b) XRD pattern showing broad, low-angle peak (~8.3° 2θ) characteristic of VOP precursor.
B. High-temperature X-ray diffraction
HTXRD experiments were performed using a Scintag PAD X θ − θ diffractometer (Thermo Electron Inc.; Waltham, MA). This diffractometer was equipped with a sealed-tube source (CuKα radiation), an incident-beam mirror optic, a Peltier-cooled Ge solid-state detector, and a Buehler hot-stage with Pt/Rh heating strip and surround heater. X-ray generator settings were 40 kV and 30 mA, and fixed slits were employed. Temperature calibration was performed using thermal expansion behavior of known materials (e.g. alumina) and calibrated to ±5 °C. The heating chamber was configured to handle mixed gas atmospheres, for example: inert (helium), N2, air, and N2/O2 mixtures. The helium (inert) gas was run through an oxygen getter to reduce the pO2 to below 1 ppm. An oxygen monitor was placed on the downstream side of the chamber to monitor pO2 during the experiments, and the pO2 values were calibrated using certified N2/O2 gas mixtures. Figure 3 shows a photo of the Buehler hot stage mounted on the diffractometer as well as a schematic of the gas handling system that was used. To prepare a sample for HTXRD, the dried VOP powder was dispersed in methanol and a dropper was used to deposit this slurry as a thin layer onto 1 cm2 Si single-crystal substrates. Once the sample was dry, it was placed directly on the hot stage. Samples were typically heated using a 20 °C min−1 ramp rate to the desired analysis temperature. Diffraction patterns were collected over a scan range of 5–30° 2θ at a step-size of 0.04° 2θ and a count time of 1 s. Typical scans were collected in ~30 min increments.
(Color online) High temperature XRD setup for in-situ XRD analysis.
III. RESULTS AND DISCUSSION
Determination of the proper conditions for synthesis of VO2 (T) was an iterative process. Many experiments were performed to map out the reaction progression, determine observed phases, and ultimately fine-tune the time–temperature–pO2 conditions to obtain phase pure VO2 (T) at temperature. The VOP precursor material had a spherical morphology after initial synthesis as illustrated in Figure 2(a). For potential applications of the VO2 material, it was desirable to maintain, as much as possible, the spherical and submicron nature of the VOP particle morphology. Obtaining full conversion to VO2 (T) while simultaneously preventing particle sintering was paramount for the processing protocol, and it was desired that this occur at the lowest temperature and shortest time possible. Typical in-situ HTXRD measurements involved a fixed pO2 setting with XRD scans occurring over a set of steps in temperature (e.g. 100, 120, 140 °C, etc.). Typically, the temperature steps were in 20 °C increments. This type of experiment will hereafter be referred to as a “step-series”. The first step-series experiment was performed under gettered helium (inert) gas with a pO2 of <1 ppm. The result (not shown) was the formation of V2O3 at ~450 °C. The V2O3 phase persisted up to 600 °C and higher. A second step-series was performed in air and showed formation of V2O5 as low as ~240 °C. This V2O5 phase remained present over all measured temperatures up to melting (~680 °C). These two measurements bracketed the extremes of the processing and indicated that adjustment in pO2 should allow isolation of the correct VO2 stoichiometry.
Figure 4 shows the results of the step-series for pO2 of ~500 ppm O2. This plot shows XRD scans as a rainbow color contour plot where low counts are purple and blue, while higher intensity are shown as yellow and red. Temperature increases as one steps from the bottom to the top of the figure. This result illustrates the plethora of phases that occur during heating of the VOP material in this pO2 range. One quickly notes that below 100 °C one can still detect the broad VOP “precursor” peak at ~8.3° 2θ similar to that observed in Figure 2(b). Above 100 °C, this peak decays and the sample remains essentially amorphous until ~220 °C where an intermediate phase forms. This intermediate is characterized by a broad peak just above 5° 2θ and appears to grow in concentration up to 320 °C. This intermediate phase then decays just prior to the formation of VO2 at ~360 °C. At 360 °C, crystalline VO2 is first detected, but not as VO2 (T). Instead, one first observes a metastable monoclinic form of VO2 referred to as VO2 (B). This has also been observed by Yamamoto et al. (Reference Yamamoto, Kasai and Shimakawa2009) during the synthesis of VO2 (T). They observed that VO2 (B) typically precedes the formation of VO2 (T). Hence, the observation of VO2 (B) serves as a bellwether for imminent VO2 (T) formation. The structure of VO2 (B) is detailed by Oka et al. (Reference Oka, Yao, Yamamoto, Ueda and Hayashi1993).
(Color online) Rainbow contour plot for in-situ heat treatment of vanadium oxide precursor powder up to 600 °C under a flowing mixture of N2/O2 gas (~500 ppm O2). Intensity is shown as a color scale were purple = low counts, red = high counts. See text for details.
Figure 4 shows that further heating to 380 °C yields formation of VO2 (T); this is characterized by the peak at ~27.6° 2θ which is the (110) of the VO2 (T) phase. This observation is promising, because it confirms that VO2 (T) can be formed at low processing temperatures, however, the downside of this result was that the VO2 (T) was not single phase. Instead, it coexisted with the V6O13 phase. By 400 °C the V6O13 compound was the dominant phase in the step-series. Clearly, the stability range of VO2 (T) is too small for isolation of VO2 (T) under the oxygen concentration of ~500 ppm. Lowering the pO2 should aid in expanding the stability range for VO2 (T) since this would kinetically suppress the reaction-rate through the absence of sufficient oxygen. This shall be demonstrated in the discussion of Figure 5. To complete the discussion of Figure 4, one can see that the V6O13 phase transforms to V3O7 at ~480 °C; however, there are also signs of V2O5 formation as early as 460 °C. These three phases coexist up to 500 °C and by 520 °C only V2O5 remains present.
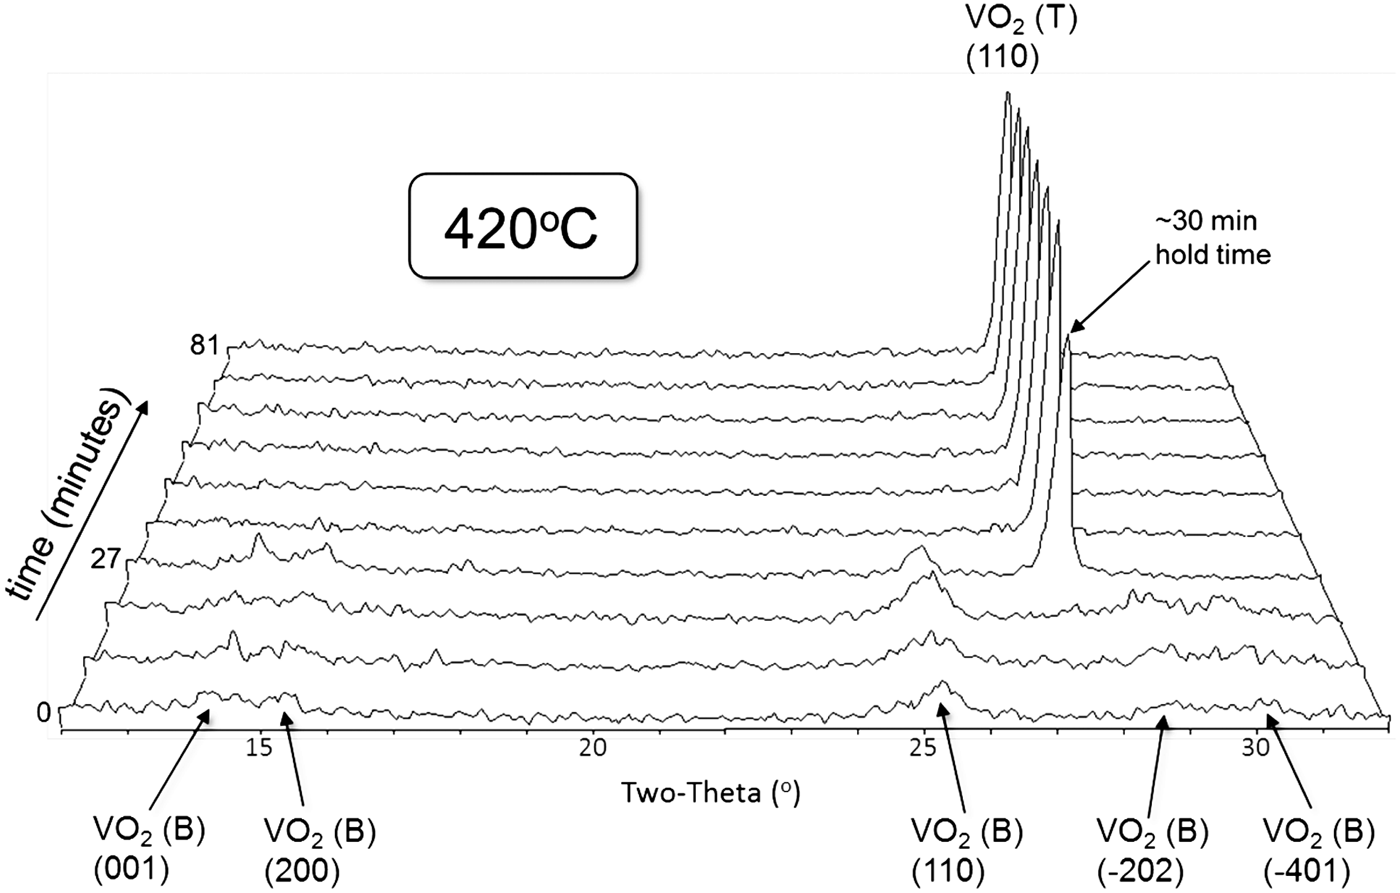
Isothermal hold of vanadium oxide precursor precursor at ~50 ppm O2 at 420 °C shows formation of fine grained VO2 (B) followed by sudden conversion to VO2 (T) after 30 min hold time.
Slowing down the kinetics of phase formation by reduced pO2 was a successful strategy for isolating VO2 (T). The HTXRD experimental design was changed to the use of isothermal holds at a set pO2 condition. In this new processing protocol, the sample was heated rapidly (~100 °C min−1) to the hold temperature followed by immediate and continual collection of XRD scans once the set-point was reached. HTXRD scans employed a shortened 2θ range so as to obtain as much detail about the phase change behavior as possible during the hold time. Typical isothermal hold experiments employed scans that required ~9 min to collect, and the duration of the soak time at temperature was ~1.5 h. This allowed for ten scans to be collected during this duration. Various pO2 values and set-point temperatures were attempted. Figure 5 shows the best results for rapid and controlled VO2 (T) formation. In this isothermal hold experiment, the pO2 was set to 50 ppm O2 and the hold temperature was set at 420 °C. As the figure illustrates, VO2 (B) is the only phase observed during the first three scans (0–27 min). Also notice that the VO2 (B) peaks are broad, suggesting reduced crystallite size. During the fourth scan in the series, we observe decay of the VO2 (B) phase and dramatic formation of VO2 (T). Subsequent scans reveal only VO2 (T) and no additional (higher oxidation state) phases. This result illustrates a simple processing protocol for low-temperature synthesis of VO2 (T) directly from VOP powder and does not require a multi-step oxidation/reduction procedure. The processing window appears to be wide; the VO2 (T) phase will form and remain single phase for a significant duration of time (i.e. at least 1 h as shown in Figure 5).
Upon formation of the VO2 (T) sample documented in Figure 5, the sample was cooled down to room temperature; it showed transformation to the monoclinic form VO2 (M) as expected. To test the phase transition behavior of the VO2 between monoclinic and tetragonal, the sample was reheated in an air atmosphere on the hot stage setup (Figure 3) in an attempt to capture the conversion of VO2 (M) to VO2 (T). In this step-series experiment, the temperature steps were in smaller (5 °C) increments to capture the onset of the transition. Figure 6 reveals the outcome of this step-series, where the diffracted intensity is plotted as a rainbow scale (purple = low counts, red = high counts). Temperature runs along the y-axis with the initial room temperature scan at the bottom of the plot. During this experiment the temperature was raised up to 100 °C during the first 14 XRD scans, labeled as the “heating” portion (see the label on right side of the figure). Then the sample was cooled back down to ~40 °C (labeled as “cooling” on the right of the figure). Both heating and cooling were monitored so as to capture the well-known hysteresis behavior of this transition. Upon heating, the phase transition from the monoclinic VO2 (M) to the tetragonal form initiated at about 70 °C and was complete by 80 °C. The transition was easily detected by the sudden shift in the VO2 (M) (011) peak at ~27.8° 2θ to the VO2 (T) (110) peak at ~27.6° 2θ. The transition was also captured at ~37.0° 2θ where the superimposed (−211) and (200) peaks of the VO2 (M) show a shift in 2θ between 70 and 80 °C as the VO2 (T) (101) peak forms. However, in this case the (101) VO2 (T) peak is observed at a higher angle (~37.2° 2θ) than the lower temperature counterparts. The observation of a sudden change in peak location with temperature, coupled with the awareness that these peak shifts occur in opposing angular directions depending on (hkl) easily diagnoses this as structural phase transformation behavior (as opposed to thermal expansion or phase decomposition effects). After the maximum temperature of 100 °C was reached, the sample was cooled, and the reverse transformation from VO2 (T) to VO2 (M) was observed. In the case of cooling, the transition is delayed until ~60 °C for the onset of the transition and appears to convert back to VO2 (M) by ~50 °C, although there may continue to be ongoing conversion even in the 50–40 °C range. Hence, we observe a ~10 °C hysteresis between heating and cooling for the monoclinic/tetragonal transition. This is consistent with other reports (e.g. Lu et al., Reference Lu, Li and Yin2011).
(Color online) Monoclinic–tetragonal phase transformation of VO2 between room temperature and 100 °C (air atmosphere). See text for details.
IV. CONCLUSIONS
Low-temperature synthesis protocols for conversion of VOP powders to VO2 (T) have been successfully determined via HTXRD. A straightforward heat treatment of VOP powder under ~50 ppm O2 at 420 °C reveals initial formation of VO2 (B), which subsequently converts to VO2 (T) after ~30 min of hold time. Room temperature XRD analysis of the synthesized VO2 (T) powder shows transformation to the monoclinic VO2 (M) form. Subsequent temperature cycling through the monoclinic-to-tetragonal transition reveals the onset of conversion to VO2 (T) at ~70 °C. Upon cooling, the tetragonal–monoclinic transformation is suppressed by ~10 to ~60 °C, illustrating the hysteresis effect of the phase change.
ACKNOWLEDGEMENTS
The authors thank Amy Allen (Sandia) for her assistance in the SEM analysis of VOP powders. Sandia is a multiprogram laboratory managed and operated by Sandia Corporation, a wholly owned subsidiary of Lockheed Martin Corporation, for the United States Department of Energy's National Nuclear Security Administration under contract DE-AC04-94AL85000.