

Introduction
The ‘Silk Road’ (SR) has been a source of perennial academic and public interest since the term was introduced in the late nineteenth century (von Richthofen Reference von Richthofen1877), but the historiography of the concept can be traced to the medieval (Polo Reference Polo1918) and antique (Ptolemy Reference Ptolemy1406) periods. The diachronic, predominantly east–west interactions represented by the SR are widely acknowledged to have massively stimulated the civilizations of participating populations, with long-distance movements of goods, far more varied than those implied eponymously, modes of thought, technologies and people. It is a truism to state the SR's pertinence to the modern world, encapsulated since 2013 by China's ‘Belt and Road Initiative’, but the SR's origin has been a longstanding topic of discussion, and one complicated by the fact there are numerous ‘roads’. Of course, the SR of popular imagination involves camels and caravanserai spanning the desertic steppe, and these routes (there are many) are indeed of massive importance historically, and of particular relevance to the history of metallurgy in eastern Asia (e.g. Linduff & Mei Reference Linduff and Mei2009). However, this paper concerns the origins of the Southwest Silk Road (SSR), which remains less well known than its supra-Himalayan counterparts, or even its nautical variants, the Maritime Silk Roads (MSR) (e.g. Bellina Reference Bellina2014; Bellina et al. Reference Bellina, Favereau and Dussubieux2019).
In Mandarin, the SSR is known as the 茶馬道, or ‘Tea Horse Road’, these being the chief goods known to have moved to the Chinese imperial capital of Chang'an in Shaanxi province. The SSR routes varied over time, with four main variations attested historically for the mid first to early second millennia ad (Fig. 1), connecting Chang'an to Chengdu in Sichuan province and Dian/Dali in Yunnan province, before continuing west to northern Myanmar (Mian), Bangladesh, India (Yandu), while alternate branches went south to northern Vietnam (Jiaozhi), Laos, Thailand and Cambodia (Yang Reference Yang2004; Reference Yang2008). Knowledge of earlier, pre-third-century ad SSR routes is limited to Yunnan, Sichuan and Shaanxi provinces (plus Jiaozhi, northern Vietnam: Fig. 2) as the other Mainland Southeast Asian (MSEA) territories were, at that juncture, ‘prehistoric’. With this paper, we wish to question whether these trans-regional montane and riverine social-interaction networks linking MSEA and southern China may be older, possibly considerably older, than the textual sources allow for.
The SSR during the Nanzhao-Dali period, seventh–thirteenth centuries ad. (Reproduced with permission from Yang Reference Yang2004, map 2.)

The SSR before the third century bc, with the exclusion of Mainland Southeast Asia due to lack of textual sources. (Reproduced with permission from Yang Reference Yang2004, map 1.)

Archaeological evidence for horses and tea in early China is quite abundant (e.g. Jiang et al. Reference Jiang, Lu, Wang and Wei2021; Li et al. Reference Li, Zhang and Taylor2020; Lu et al. Reference Lu, Zhang and Yang2016; Wan Reference Wan2013) but practically absent from prehistoric Southeast Asia. Therefore, alternative means of identifying proto-SSR interaction networks must comprise materials that a) might have been exchanged and b) might be detected archaeologically. Within the Maritime Silk Road system, Southeast Asian forest products, including exotic woods, resins and spices, were famously in demand by more westerly consumers, located as far as the Mediterranean basin (Bellina & Glover Reference Bellina, Glover, Glover and Bellwood2004; Bellina et al. Reference Bellina, Favereau and Dussubieux2019). It is certainly conceivable that some of these materials were not available in southern China, despite some overlap in ecological conditions, and that detailed and fortuitous future MSEA sampling programmes could recover evidence for their being supplied north, as per the recent association of sappanwood and lead and copper ingot exchange in a seventeenth-century ad wreck in the Gulf of Siam (Venunan et al. Reference Venunan, Ploymukda, Boripon, Kwansakul, Suteerattanapirom and Pryce2022). More readily identifiable would be the exchange of semi-precious stones, for which there are precedents in the form of Taiwanese nephrite (Hung et al. Reference Hung, Iizuka and Bellwood2007), agate and carnelian beads produced by highly skilled artisans (Bellina Reference Bellina2003; Bellina et al. Reference Bellina, Favereau and Dussubieux2019), as well as recent evidence for lower-skilled production of carnelian beads in Neolithic north-central Myanmar (Georjon et al. Reference Georjon, Kyaw and Win2021).
Of course, pottery should provide the bulk of our evidence, and the Yunnan Neolithic ‘incised and impressed’ (‘i&i’) wares are indeed detected from Thai and Vietnamese Neolithic sites spanning the mid third to late second millennia bc (Higham Reference Higham2017; Rispoli Reference Rispoli2007; Rispoli et al. Reference Rispoli, Ciarla and Pigott2013; Sarjeant Reference Sarjeant2014), as well as potentially early–mid-third-millennium bc deposits from north-central Myanmar (Hudson & Lwin Reference Hudson and Lwin2012; Pautreau et al. Reference Pautreau, Maitay and Kyaw2010; Pryce et al. Reference Pryce, Pradier and Favereauin press). However, we do not at present wish to emphasize the possibility of a proto-SSR commencing up to 5000 bp. Few of these Neolithic pottery assemblages have been evaluated within a strict chaîne opératoire framework (as per Favereau et al. Reference Favereau, Pryce and Win2018), meaning the claimed homologies have not been reliably demonstrated. Furthermore, there are as yet no equivalent shared typewares for the Yunnan and MSEA Bronze Age and Iron Age periods (which have notably close chronologies: Higham et al. Reference Higham, Douka and Higham2015; Pryce et al. Reference Pryce, Kyaw and Kyaw2018b; in press; Yao et al. Reference Yao, Darré, Zhilong, Lam and Wei2020), and thus pottery studies currently fail the test of chronological contiguity.
As glass is either inexistent or vanishingly rare in MSEA or Chinese contexts prior to the mid first millennium bc (excluding Chinese faience and frits of the late second/early first millennia bc: Fuxi Reference Fuxi, Fuxi, Brill and Shoutun2009; Huang Reference Huang, Gan, Li and Hou2020) and trace element datasets compatible with those of MSEA (e.g. Dussubieux & Bellina Reference Dussubieux and Bellina2018) are as yet unavailable in Yunnan, we therefore turn to metals to reach back to the late second millennium bc. Prehistoric precious and ferrous metals having received only fleeting attention; here we investigate the potential to push back the early dating of the more southerly SSR routes using copper-base archaeometallurgical evidence. Recent copper/bronze provenance papers have established tentative but nuanced protohistoric linkages between northern Vietnam (Jiaozhi) and the rest of MSEA (Pryce et al. Reference Pryce, Cadet and Allard2022a), and from these areas into Yunnan (Pryce et al. Reference Pryce, Lam, Cadet, Jiang, Yang and Yao2022b). In this paper we add new data from Myanmar, which potentially complete an arc of interaction between northern MSEA and southern China. We also offer original data treatments in an attempt to firm up our trans-regional interpretations. The latest metal samples come from recently excavated Bronze (late second/early–mid first millennia bc), Iron Age (mid–late first millennium bc, Pyu (first millennium ad) and Bagan (early second millennium ad) period sites and selected copper mineralizations in north-central Myanmar, as analysed by the ANR ‘Bronze and Glass as Cultural Catalysts and Tracers in Early Southeast Asia’ project (SEALIP-BROGLASEA). Additionally, we have a few samples from a newly discovered Iron Age site in southern Myanmar, probably related to the MSR itself (Bellina et al. Reference Bellina, Win and Htwe2018).
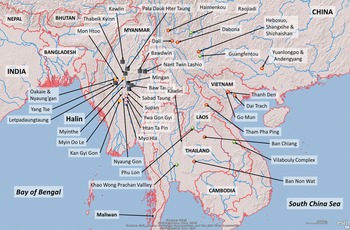
The bulk of archaeological sites concerned for our new data, HL30-1, HL29, HL29-1, HL28 and HL-TP1, are located in the southwestern environs of the UNESCO-listed Pyu citystate of Halin (museum: 95.818957°E, 22.453651°N), c. 15 km west of the Irrawaddy River in Sagaing Division (Fig. 3). The monumental ruins of the Pyu city account for Halin's fame but the presence of prehistoric deposits spanning back to a mid third-millennium Neolithic, as well subsequent Bagan remains, allows the possibility of investigating over 4000 years of Myanmar's history, from first farmers to the formation, and decline, of the first states (Pryce et al. Reference Pryce, Pradier and Favereauin press). Understanding the impact of external cultural influence is essential to this endeavour, and the SSR in its developed and nascent forms could conceivably have played a significant role. Reconstructing social-interaction networks is a task well suited, for post-Neolithic societies, to archaeometallurgy and, in particular, lead isotope-based provenance research (Pryce et al. Reference Pryce, Cadet and Allard2022a,b).
Excavations yielding copper-base artefacts for the present study, in respect of Halin village, the National Museum, and the southern part of the Pyu city wall (white line approximation).

HL29-1, HL30-1 and HL-TP1 were excavated by the Mission Archéologique Française au Myanmar between 2017 and 2020, while HL28 and HL29 were excavated by Myanma archaeologists in 2009–10. HL29-1 was a multi-phase deposit with a Bronze Age cemetery, Pyu cremation burials and Bagan occupation deposit. HL30-1 contained a Neolithic cemetery, a Bronze Age occupation deposit and an Iron Age cemetery. HL-TP1 was an early–mid Bronze Age, Iron Age, Pyu and Bagan period occupation and salt production locale. HL28 and HL29 were Iron and Bronze Age cemeteries, respectively, whose assemblages were sampled by the lead author in 2019. For a summary of Halin archaeology, see Pryce et al. (Reference Pryce, Pradier and Favereauin press).
A total of 37 Halin copper-base artefacts spanning over 2000 years of metal consumption were analysed, including four axes, four bangles, five rings, seven bells, five spearheads, ten wires, one casting spillage and one plate-like fragment (Fig. 5; Table 1). Their typological, technological, elemental and lead isotopic data add to the 32 published Myanmar samples (Dussubieux & Pryce Reference Dussubieux and Pryce2016; Pryce et al. Reference Pryce, Baron and Bellina2014; Reference Pryce, Htwe and Georgakopoulou2018a). In the absence of early copper-mining and smelting evidence in Myanmar, as well as geological data generally, we also collected 24 geological samples from nine copper mineralizations in Sagaing Division, Mandalay Division, Kachin State and Shan State, to gain some handle on regional geological variation (Fig. 4; Table 1). The three southern Myanmar samples come from the littoral settlement of Maliwan (98.623468°E, 10.324234°N), recently excavated by the French Archaeological Project in Peninsular Myanmar and Thailand (Bellina et al. Reference Bellina, Win and Htwe2018).
Map showing the present study sites/locations, terrain, major rivers and national boundaries. Black squares represent sampled mineralizations, pink circles represent Myanmar Iron Age consumption sites (excavated by the MAFM under the direction of J.-P. Pautreau), orange circles represent Myanmar Bronze Age–Bagan period consumption sites excavated by the MAFM (under the direction of the lead author) and red circles other consumption sites cited in the paper. Green circles represent the documented prehistoric copper-producing centres with lead isotope characterizations.

The study's archaeological artefacts. Please note image missing for SEALIP/MY/HLTP1/2.

Current study samples, names and context information.

* only MAFM-excavated samples have radiometric dating
Methodology
Optical Microscopy (OM)
The metal samples were mounted in epoxy resin, ground with silicon carbide paper (from 800 to 4000 grits) and then polished using diamond suspensions (1 and 0.25 μm). After etching with alcoholic ferric chloride, microstructural evidence for thermo-mechanical treatments was investigated using an optical microscope (Leica DLLM). Mineral samples were not studied by OM.
X-ray Fluorescence (XRF)
XRF was used for the OM samples’ bulk elemental composition of major, minor and (some) trace elements, conducted at the Laboratoire Archéomatériaux et Prévision de l'Altération (LAPA-IRAMAT/CEA) in Saclay, France. XRF data were acquired using a NITON XL 3t GOLDD+ portable XRF analyser in ‘laboratory mode’ (fixed stand), with a max 40 kV accelerating voltage in the ‘alloys’ mode. Accuracy and precision were assessed with 11 Certified Reference Materials (Table 2). Good results for major and minor components were confirmed, but note that light elements at low concentrations like phosphorous, silicon, aluminium, magnesium and sulphur were not reliably detected due to non-vacuum conditions. The analyses were performed on the OM mounted and polished sections using a 3 mm beam diameter, which allowed for reliable results as long as the sample was larger than this. Three such spot analyses were made for each sample to account for corrosion and inclusions.
CRMs for the present study, as analysed with pXRF, SEM-EDS and with certified values given. Data given to 1 d.p.

Scanning Electron Microscopy with Energy Dispersive Spectrometry (SEM-EDS)
Small and/or corroded OM/XRF samples were carbon coated for analysis in a JEOL 7001F instrument, in order to establish the bulk composition of samples less than 3 mm in diameter, those with intergranular corrosion, and to study any inclusions. Both secondary electron (SE) and backscattered electron (BSE) modes were used, using a 20 kV accelerating voltage, a 10 mm working distance with an Oxford Silicon Drift Detector, and processed using Oxford Instruments Aztec software.
The detection limit was fixed at 0.5 wt. % with a count rate of 4000/s (detection time of 40 s), which gave good spectral resolution with respect to background noise. We consider the relative quantification error (2σ) is c. 10 per cent of the measured value. SEM-EDS accuracy was evaluated using the same CRMs as used for the pXRF analysis, and we obtained good results for the major elements (Table 2). Bulk compositions for each sample were obtained by a mean of 3–4 areas scan (0.4 mm2) per sample. The analyses were performed in areas without corrosion products, when possible.
Multi Collector-Inductively Coupled Plasma-Mass Spectrometer (MC-ICP-MS)
Lead isotope analysis (LIA) was conducted at the Service d'Analyse des Roches et des Minéraux of the Centre for Petrographic and Geochemical Research (SARM-CRPG) in Nancy, France, using MC-ICP-MS after lead extraction (Manhes et al. Reference Manhes, Allègre, Dupré and Hamelin1980). Thallium NIST SRM 997 was used to correct for instrumental mass bias and all parameters were adjusted to obtain the closest values relative to NIST SRM 981, as determined by DSTIMS (Thirlwall Reference Thirlwall2002). More details about SARM-CRPG lead isotope analysis are available in Aebischer et al. (Reference Aebischer, Cloquet, Carignan, Maurice and Pienitz2015); Cloquet et al. (Reference Cloquet, Carignan and Libourel2006).
As per the SEALIP/BROGLASEA programmes, LIA was used to look for ‘consistency’ with known and characterized production systems, in recognition that there could be other, as yet uncharacterized, primary and/or secondary production systems, as well as mixing, alloying and recycling impacting interpretation (e.g. Budd et al. Reference Budd, Gale, Pollard, Thomas and Williams1993; Pryce et al. Reference Pryce, Brauns and Chang2011b; Reference Pryce, Baron and Bellina2014; Wilson & Pollard Reference Wilson, Pollard, Brothwell and Pollard2001). These consistencies were judged by proximity of data points on 208Pb/204Pb versus 206Pb/204Pb and 207Pb/204Pb versus 206Pb/204Pb biplots for traditional manual interpretation.
Complex networks analysis
As this paper will evoke with examples from the internally manageable Myanma LI datasets, manual LI interpretation is unsuited to detecting pertinent anthropological patterning in very large datasets. Therefore, the available LI data for all Bronze Age metal objects, ores and slags from MSEA and southern China were processed using a complex networks analysis approach termed ‘community detection’ (or modularity analysis). Previous applications in southeastern Europe used the ‘Louvain’ algorithm (Radivojević & Grujić Reference Radivojević and Grujić2018) as applied to elemental data, but here we opted for an improved ‘Leiden’ algorithm (Traag et al. Reference Traag, Waltman and van Eck2019) for our LI data, although both Louvain and Leiden algorithms present similar robustness on archaeological data (Grujić & Radivojević Reference Grujić, Radivojević, Brughmans, Mills, Munson and Peeplesforthcoming). Our application of complex networks analysis in this paper is novel and required substantial method development, which will be detailed in the discussion (and available at https://github.com/simoncarrignon/bronze-age-ssr). We do not consider our method definitive, but do contest that it is offering reliable and archaeologically/geochemically justified preliminary rationalizations of large datasets that merits dissemination at this juncture.
Our current protocol requires a definition of ‘consistency’ for lead isotope ratios that takes into account Southeast Asia's and southern China's high geological diversity, as well as the variability of known prehistoric copper production LI signatures. For each of the three 204Pb-denominated ratios (those most geologically sensitive), the difference between any pair of artefacts’ LI ratios must be as small or smaller than our production-defined thresholds in ordered to be considered potentially consistent—i.e. subject to human evaluation of the algorithmic proposition. Applying this measure to the whole dataset allows us firstly to identify groups/modules of artefacts that exhibit the strongest connections within the group and weaker connections outside of it, as outlined by Radivojević & Grujić (Reference Radivojević and Grujić2018). Secondly, we calculate the same strength/weakness of connectivity but now between sites/assemblages, using the principle that if a high density of artefacts from sites belong to the same module, those sites potentially share a meaningful link.
Results
To save space, only new Myanma data are presented in text but will be considered with reference to previous national datasets (calculations available online at https://github.com/simoncarrignon/bronze-age-ssr: see also Dussubieux & Pryce Reference Dussubieux and Pryce2016; Pryce et al. Reference Pryce, Baron and Bellina2014; Reference Pryce, Htwe and Georgakopoulou2018a).
Elemental & OM
The Halin samples exhibit only three alloy classes (Table 3), using the conventional alloying cutoff of 1 wt. %, with bronze predominating (21), followed by copper (14) and lastly leaded copper (2). Notwithstanding the majority of medium–high corrosion levels (9+13 versus 15 ‘low’) probably obscuring original tin and lead contents, and thus reducing the potential to identify modality in the elemental data, our samples are clearly regionally atypical in that the Iron Age samples are almost all unleaded. This is mainly visible in the HL28 assemblage, which consists in part of wire bundles of a near-pure copper (97–99 wt. % Cu, Sn & Pb not detected), probably representing raw, at most part-refined, product from the smelter, which could have served as highly frangible commodity money (Dussubieux & Pryce Reference Dussubieux and Pryce2016), but also of small bronze and copper bells and rattles that would usually be leaded alloys in the MSEA Iron Age, so as to improve castability in a decorative object. The only definitely leaded Halin artefacts are a leaded copper ring from an Iron Age HL29-1 context and a leaded copper ring fragment from Bagan period HLTP1. Of the Maliwan artefacts, two are leaded bronze and one is copper, but the lack of typology does not allow us to assess the suitability of alloy to usage.
Elemental compositions for metal and mineral samples, and working techniques for metal samples. SEM-EDS and pXRF data are given to 1 d.p.

In terms of working techniques, the study artefacts are predominantly as cast (29), followed by hammered/annealed (5), hammered (1) and annealed (1), with the remainder (4) too corroded for microstructures to be visible (Figs 6–8). As our majority metal artefact class is that of Iron Age raw copper wires, it is striking that they are all cast, as opposed to drawn or hammered. The Iron Age raw copper pseudo-spearheads were also left as cast, which is commensurate with our interpretation of them as ingots or commodity money, and not weapons or tools. We note that the Bronze Age axes from HL29 and HL29-1 were also as cast or too corroded to tell whether they were produced in copper or bronze, which suggests they were never thermo-mechanically treated for use as tools or weapons, nor work-hardened through use, and were thus possibly produced explicitly for funerary rites (as per Bronze Age Ban Non Wat axes: Pryce Reference Pryce, Higham and Kijngam2011). Surprisingly, the only artefacts to present evidence of thermal and/or mechanical treatments are an Iron Age copper bell or rattle from HL28 and a selection of Bronze Age bronze bangles and rings from HL29-1, as well as two Bagan period leaded copper rings from HL29-1 and HLTP-1. The three Maliwan artefacts were as cast, but as they are fragmentary we cannot evaluate their original use.
Optical micrographs. Top left: as-cast wire bundle (HL28/2) with round copper sulphide inclusions; top right: wire bundle (HL28/5); below left: bronze cast bell/rattle (HL28/12); below right: bronze as-cast bangle (HL29-1/1); bottom: a bronze ring with an as-cast microstructure (HL29-1/7).

Optical micrographs, after etching. Left: a leaded copper sample (NYG3/1) with an as-cast structure; right: a copper ring sample (HL29-1/8) which has been hammered and annealed.

HL28/18 almost entirely composed of corrosion products but with an identifiably as-cast structure.

The Halin elemental results exhibit a low variability when compared with other Myanmar copper-base metal datasets, which reveal six alloy types: two Bronze Age fragments from the Oakaie area approach the threshold of ‘arsenical bronze’; one Iron Age bangle from Kokkokhahla composed of arsenical copper; 18 Bronze and Iron Age ornament and tool fragments made from bronze; 17 Iron Age wires and pseudo-spearheads made from copper; one Iron Age high-tin bronze bowl fragment from Supan; one Bronze Age socketed small spearhead or large arrowhead from Nyaung'gan in leaded copper (Pryce et al. Reference Pryce, Htwe and Georgakopoulou2018a, table 2). As per Halin, there is a clear tendency for Iron Age copper and Bronze Age bronze, but again, this is likely to be by virtue of the older artefacts being definite finished products whereas the latter wire bundles and pseudo-spearheads appear to constitute a specific aspect of regional funerary tradition, potentially deposits of commodity money (Dussubieux & Pryce Reference Dussubieux and Pryce2016).
The lower number of alloy classes at Halin is due to the absence of high-tin bronzes, which are an exotic class in MSEA, probably representing mid–late first-millennium bc exchange systems with South Asia (Bennett & Glover Reference Bennett, Glover, Jett, McCarthy and Douglas2012; Pryce & Bellina Reference Pryce and Bellina2018). There is only one other high-tin bronze identified in Myanmar (SEALIP/MY/SP/1 in Pryce et al. Reference Pryce, Htwe and Georgakopoulou2018a) and, given the extensive monumental and textual evidence for Indian influence at Halin, it is probable that such alloys exist there but have not yet been excavated and/or identified. The other minor alloying constituent apparently absent from Halin is that of arsenic, which we will come back to in light of lead isotope data.
Lead Isotope Analysis
Our presentation and interpretation of these data proceeds in stages, from new Myanmar artefact data, all Myanmar artefact data, the addition of Myanmar mineral data, comparison with regional (MSEA and Yunnan) production, and finally Bronze Age consumption data to assess potential evidence for proto-SSR interactions. This layering is intended to make our interpretative process more transparent, as is our use of simple double biplots that capture all possible isotope variation, and the provision of full tabulated raw data (Table 4). To remind the reader, for artefacts to have lead isotope consistency, they must plot together on both graphs.
Full raw lead isotope data for the present study samples.

All our new data plot within known ranges for Southeast Asian artefacts. Within the data cloud, only two clusters appear at this stage, C1 and C2 (Fig. 9). C1 comprises SEALIP/MY/HL28/3-9+11 and SEALIP/MY/HL29/1-3 but not SEALIP/MY/HLTP1/1, which does not have a compatible 207Pb/204Pb ratio. C2 comprises SEALIP/MY/HL29-1/1-4+7, SEALIP/MY/HL30-1/1, SEALIP/MY/HL28/10 and SEALIP/MY/HLTP1/2 but not SEALIP/MY/HL29-1/8 or SEALIP/MY/MLW/3, which do not have compatible 207Pb/204Pb ratios. Thus, from the new data we can distinguish two possible shared sources of raw copper or recycled bronze: C1 composed of Iron Age copper wires and copper pseudo spearheads, and C2 composed of Bronze Age bronze bangles, Iron Age bronze casting spillage and a Bagan period bronze ring. The remaining data are somewhat dispersed but can be compared to previous Myanmar artefact data (Fig. 10).
Lead isotope ratios for all Halin and Maliwan metal artefacts. C1 and C2 represent two clusters we consider identifiable within the new copper-base artefact data. Error bars are smaller than symbols.

Lead isotope ratios for all Myanmar metal artefacts. C3 represents a cluster we consider identifiable once previously published Myanma data are included. Error bars are smaller than symbols. (Published data from Dussubieux & Pryce Reference Dussubieux and Pryce2016; Pryce et al. Reference Pryce, Baron and Bellina2014; Reference Pryce, Htwe and Georgakopoulou2018a.)

The clustering of these data indicates that C1 also includes SEALIP/MY/MT/1 and SEALIP/MY/NGO1-3 & 5-10, Iron Age raw copper pseudo-spearhead and wires, respectively. As per our previous study (Pryce et al. Reference Pryce, Htwe and Georgakopoulou2018a), the proliferation of unalloyed copper suggests C1 represents an as yet unlocated primary (smelting) production centre. Similarly, C2 is expanded with the addition of SEALIP/MY/OAI/2, SEALIP/MY/OAI3/2-4, SEALIP/MY/MHT/3 and SEALIP/MY/SP/1; in order, a Bronze Age leadedFootnote 1 bronze platy fragment, Bronze Age bronze bracelet and ring fragments, a Bronze Age bronze ring fragment, and an Iron Age high-tin bronze bowl, respectively, which suggests C2 could represent a secondary (foundry) production signature. We now also distinguish C3, comprised of SEALIP/MY/OAI1/1 and SEALIP/MY/HL28/15 & 18; a Bronze Age bronze axe and Iron Age bronze bells/rattles. C3 could potentially include SEALIP/MY/MHT/1, a Bronze Age bronze fragment, but there is c. 5 per cent divergence in 208Pb/204Pb ratios. Given that all the C3 samples are alloyed, we tentatively, given low sample numbers, suggest the signature represents a secondary production centre.
Regarding the few Myanmar artefacts with significant arsenic contents, the Kokkokhahla samples were never submitted for lead isotope analysis, as their weak context did not justify the expense. However, the two Oakaie samples (SEALIP/MY/OAI/1 & SEALIP/MY/OAI3/3) plot relatively close together for 206Pb/204Pb and 207Pb/204Pb, but differ by c. 2.5 per cent on 208Pb/204Pb ratios. Given these samples are more ‘urogenic’, having a higher proportion of lead decayed from 238U, this could increase the variability of their constituent lead derived from 232Th decay, ‘thorogenic’. The other samples plotting in this area, SEALIP/MY/MOH/1 & SEALIP/MY/HL29/4, do not contain measurable quantities of arsenic. Among the remaining data there are hints of further consistency, but insufficient sample numbers to propose tentative groups, certainly without reference to potential copper production signatures.
As stated in the introduction, our mineral samples do not necessarily come from regions known or even suspected to have ancient metal production. They were analysed in order to gain an appreciation of lead isotope variation in north-central Myanmar copper mineralizations, in the absence of published geological data. As per the rest of MSEA, Figure 11 shows there is a significant dispersion in these mineral signatures; so much so that we have excluded some far outliers from the graphs as the other results would be hard to read. In light of the new Myanmar artefact data, our (Pryce et al. Reference Pryce, Htwe and Georgakopoulou2018a) interpretation of Letpadaung mine being unrelated to ancient copper production holds (cf. Moore & Pauk Reference Moore and Pauk2001). The Yang Tse Copper sampleFootnote 2 differs considerably from that of Letpadaung despite their physical separation of just over 5 km, suggesting the two mineralizations are of different geological formations, as seen at Phu Lon in northern Thailand (Pryce et al. Reference Pryce, Brauns and Chang2011b). Nevertheless, neither of the modern Monywa mines is consistent with ancient metal samples, with the vaguely possible exception of SEALIP/MY/HL28/13, an Iron Age bronze bell.
All Myanmar artefact and mineral LI data, representing all four stable isotope ratios. Letpadaung and Sabad Taung samples plot far to the left and right, respectively, and two Mingan samples plot off scale for 208Pb/204Pb ratios, so the axes are constrained for greater legibility. C4 and C5 represent two clusters we consider identifiable when Myanma mineral data are included. Symbols are larger than error bars.

Of the other mineralizations, sampled from copper minerals rather than modern ingots, it can be seen that both Kawlin and Baw Mountain have very tight and distinct signatures, which do not correspond to any metal artefacts (Figs 4 & 13, below). Pala Dauk Hter Taung's signature is more dispersed in its 206Pb/204Pb ratios, but two of the samples appear compatible with SEALIP/MY/HL29/6, a Bronze Age bronze axe. However, we strongly discount the reliability of this link due to the absence of archaeological evidence for early exploitation (or even habitation) in that locality. The Mingan samples have substantial urogenic and thorogenic variation and are inconsistent with any metal samples. Thabeik Kyinn has more dispersion than the aforementioned Kawlin and Baw Mountain mineralizations, but considerably less than the Mingan and Pala Dauk Hter Taung samples. Of note, two of its samples fall within the C2 cluster defined above, which is interesting as this mineralization is located only c. 50 km from Halin, some of whose metal samples are also C2 compatible. Ancient production is not known at Thabeik Kyinn, but these results suggest it should be checked.
All Myanmar artefact plus mineral LI data deemed potentially relevant in the previous section, representing all four stable isotope ratios, plotted against published copper production systems in Thailand (Khao Wong Prachan Valley and Phu Lon), Laos (Vilabouly Complex), Yunnan (Guangfentou) and Sichuan (Raojiadi) (Chen et al. Reference Chen, Yang, Du, Tang and Luo2020; Pryce et al. Reference Pryce, Lam, Cadet, Jiang, Yang and Yao2022b; Zou et al. Reference Zou, Cui, Liu, Li and Min2019). C6 is a cluster we consider identifiable once regional copper production data are included. Error bars are smaller than symbols.

Biplots showing the relatively high, at a regional scale, consistency in LI ratios of slag and copper-base metal artefacts from the Khao Wong Prachan Valley (Non Pa Wai and Nil Kham Haeng) and the Vilabouly Complex (Puen Baolo and Thong Na Nguak). The two NPW outliers, a bronze axe and a slag fragment, are represented by a red cross.

Finally, there are two clusters, C4 and C5, that are extremely intriguing in terms of primary copper production centre potential. The native leaded copper and malachite samples from Bawdwin, a lead/silver mine known to be operated up to 500 years ago (LaTouche & Brown Reference LaTouche and Brown1909), plot closely together (C4) and are highly consistent with a leaded copper ring from HL29-1 (SEALIP/MY/HL29-1/8). HL29-1 is primarily a Bronze Age cemetery but this ring was found in context #1018, which is a jar burial dating to the Bagan period (Pryce et al. Reference Pryce, Pradier and Favereauin press). This association suggests, albeit on the evidence of one archaeological find, that Bawdwin metal production could be twice as ancient as previously thought, up to 1000 years old. This proposition is supported by C5, which, although having a more urogenic lead isotope signature, represents copper minerals from Nant Twin in association with artefact signatures from OAI3 (SEALIP/MY/OAI3/7, a possible bronze cutting tool) and HL29 (SEALIP/MY/HL29/4, a bronze axe). The difference is that these artefacts are both dated to the Bronze Age, which could thus push Shan State copper production back another two millennia to c. 1000 bc. This would be the first explicit protohistoric link between the Shan Hills region and the Irrawaddy basin, and hints at wider regional connections.
Nevertheless, it is clear that the majority of the Myanmar metal samples are not consistent with the studied minerals, and we can thus look towards other, proven, prehistoric copper production systems in MSEA and southwest China (Figs 3 & 12). Within the former, these are limited to the Khao Wong Prachan Valley (KWPV) in central Thailand (Pigott et al. Reference Pigott, Weiss and Natapintu1997), Phi Lon (PL) in northern Thailand (Pigott & Weisgerber Reference Pigott, Weisgerber, Rehren, Hauptmann and Muhly1998) and the Vilabouly Complex (VC) in central Laos (Pigott & Pryce Reference Pigott, Pryce, Higham and Kim2022; Tucci et al. Reference Tucci, Sayavongkhamdy, Chang and Souksavatdy2014), all of which have been geochemically characterized within SEALIP/BROGLASEA (Cadet et al. Reference Cadet, Sayavongkhamdy and Souksavatdy2019; Pryce et al. Reference Pryce, Brauns and Chang2011b,Reference Pryce, Pollard, Martinón-Torres, Pigott and Pernickac; Reference Pryce, Baron and Bellina2014). Within the latter, there is no doubt that there are likely to be a great many metal production loci in this strongly metallogenic region, but we can only go by what has been identified and published: Guangfentou in Yunnan (Zou et al. Reference Zou, Cui, Liu, Li and Min2019) and Raojiadi in Sichuan (Chen et al. Reference Chen, Yang, Du, Tang and Luo2020).
Guangfentou, Phu Lon and Raojiadi all have rather dispersed isotopic signatures, doubtless representing multiple mineralizations at the same mine (as at Phu Lon: Kamvong & Zaw Reference Kamvong and Zaw2009), or the processing of ores from multiple mines (as proposed for Guangfentou by Zou et al. Reference Zou, Cui, Liu, Li and Min2019), but Figure 12 clearly indicates that C1, which has a very tight signature, is not compatible with the known copper production sites, and thus remains an unknown. However, C2 is highly consistent with the Vilabouly Complex in central Laos, a primary rather than secondary copper signature as suggested above. A potential 1300+ geodesic kilometre Bronze Age exchange system was identified previously with Oakaie/Nyaung'gan artefacts (Pryce et al. Reference Pryce, Htwe and Georgakopoulou2018a), but with the Halin material it now extends through the Iron Age and as far as the Bagan Period. Of course, old artefacts could have been recycled over time but, in our opinion, it is unlikely the original isotopic signature would hold after perhaps centuries of reuse: mixing, alloying and recycling (see e.g. Bray et al. Reference Bray, Cuénod, Gosden, Hommel, Liu and Pollard2015; Liu et al. Reference Liu, Pollard and Cao2020).
C3, as tight as C1 but not as dense, and representing Bronze and Iron Age consumption, remains without consistency. Neither are C4 and C5 compatible with the other known production signatures, suggesting our linking them to Bawdwin and Nant Twin Lashio mineralizations holds for the time being. At this stage we believe we can add C6 to our list of possible groups, with consistency seen with the Khao Wong Prachan Valley copper production signature (Fig. 8). This c. 1000 geodesic kilometre exchange route was already detected with a Bronze Age bronze bracelet from Oakaie 3 (Pryce et al. Reference Pryce, Htwe and Georgakopoulou2018a), which we can now reinforce with SEALIP/MY/HL29/8, a bronze spearhead. It is pertinent that C6 does not seem to extend into the Iron Age as, after many years of uncertainty, the latest radiometric dating from the Khao Wong Prachan Valley suggests that metal production there did not persist beyond the Bronze Age (Higham et al. Reference Higham, Weiss and Higham2020). SEALIP/MY/HL28/13 & 14 are not C6 members as they are incompatible in their 207Pb/204Pb ratios. We do not consider SEALIP/MY/NYG/1 a C6 member, despite its high isotopic consistency, as it is a leaded alloy and C6 is a copper signature.
Having now assessed the Halin (and Maliwan) data with respect to (1) themselves, (2) all Myanmar artefacts, (3) Myanmar minerals and (4) MSEA and southwestern Chinese production systems, the next logical step would be (5) MSEA and southern Chinese consumption data. Our recent investigations of northern MSEA/southern Chinese exchange systems have attempted this stage manually, with reasonable results for the existence of late second- through first-millennium bc networks running from Yunnan to Vietnam, Thailand and Myanmar (Pryce et al. Reference Pryce, Cadet and Allard2022a, b). Our substantial new Myanmar dataset, which covers over two millennia, offers the possibility to assess further chronological contiguity with the historically attested SSR c. third century bc (Fig. 2; Yang Reference Yang2004). Manual processing of Myanmar data with regard to the ‘late second-/early first-millennium bc interaction arc between Mainland Southeast Asia and Southwest China’ identified in Pryce et al. (Reference Pryce, Lam, Cadet, Jiang, Yang and Yao2022b) indicates:
• The present study's group C1 is compatible with SEALIP/CH/HBS/4, a 800–600 bc (Mid Bronze Age) flat copper fragment from Hebosuo on Lake Dian in Yunnan. This does not necessarily mean the C1 source is in the Dian area, but that its product was accessible to communities in north-central Myanmar and Yunnan. As C1 samples are mostly mid–late first-millennium bc, we can thus draw our proto-SSR network closer to the above-depicted historical SSR.
• C2, which is highly consistent with the Vilabouly Complex copper production signature, is also compatible with SEALIP/TH/BC/1 & 4, a bronze socketed spearhead and O-section bangle from Bronze Age Ban Chiang in northeast Thailand. A great many MSEA artefacts are consistent with this production signature and its output spans the Bronze and Iron Ages, thus linking to the historical SSR.
• C3 is not consistent with previously identified groups outside of Myanmar.
• Neither is C4, but as our only dated artefact in this group is dated to the Bagan period, early second millennium ad, we have very few comparative regional data.
• The urogenic C5 could include potentially include SEALIP/TH/BNW/6, a 1000–900 bc copper axe from Ban Non Wat in northeast Thailand.
• As mentioned above, C6 is compatible with copper production from the Khao Wong Prachan Valley in central Thailand, a volume of isospace far less densely occupied than that of the Vilabouly Complex. C6 is consistent with SEALIP/TH/BNW/5, 7 & 8, a bronze axe and copper-base chisel and axe, respectively, from 1000–900 bc Ban Non Wat. There are no Iron Age or later data consistent with this group.
Not previously identified potential groupings include:
• SEALIP/MY/HL28/14, an Iron Age bronze bell, is compatible with SEALIP/TH/NPW/11, a late second-millennium bc Early Bronze Age bronze axe from Non Pa Wai in central Thailand, thus spanning the Bronze and Iron Ages and potentially abutting SSR networks.
• SEALIP/MY/HL29-1/5, a Bronze Age bronze axe, is consistent with SEALIP/TH/BC/2 & 3, bronze O-section bangles from Bronze Age Ban Chiang, thus not adjoining the historical SSR period.
Therefore, of the eight potential groups, three offer chronological contiguity with the SSR. Manual processing of the above datasets is not too problematic, but their presentation already becomes difficult due to the density of data points: hence the lack of a figure provided here. These issues are massively compounded if we attempt to add the full regional datasets for Bronze and Iron Age and historical samples. The resulting mass of overlapping multi-coloured symbols over three ratios makes the identification of individual samples and groups very difficult. ‘Zooming in’ only obscures potential clusters and disguises the overall diversity of the dataset. Likewise, one can process one site versus another one at a time, but this discounts the possibility of clusters only being detectable across multiple sites. Furthermore, sites are not always the appropriate scale of analysis, if we are interested in a particular period, alloy or typology, for example. While the lead author has long prided himself in using simple biplots of raw data (e.g. Pryce et al. Reference Pryce, Brauns and Chang2011b, fig. 7), easily intelligible to the non-specialist reader, we have reached a point when a data-processing evolution is required to evaluate the combined datasets for proto-SSR evidence more objectively.
Discussion on the potential for a Bronze Age SSR
Thus far, and in all but one previous SEALIP-BROGLASEA publication, attributions of ‘consistency’ between LI signatures for copper/lead-base metal consumption, or between those of consumption and production, were decided by Mk1 Eyeballing of the data cloud. Subjectivity does not necessarily imply these interpretations were liberal. Indeed, our previous application of an ‘objective’ measure, Kernel Density Estimates (Pryce et al. Reference Pryce, Brauns and Chang2011b), gave such broad compatibility, at 10 per cent confidence increments, that the lead author was deeply dissatisfied by their historical likelihood. Wary of the LI archaeology interpretative pitfalls of yesteryear in the Mediterranean arena (summarized in Pollard Reference Pollard, Shortland, Freestone, Rehren and Tite2009), Pryce resorted to excessive conservatism in Southeast Asia: requiring that a metal artefact plot within the data cloud of a well-defined production signature before suggesting consistency, or giving only effusive estimates of potential proximity between consumption signatures.
To address this, we assumed that any two samples should be considered provisionally consistent and potentially sharing the same supply route: using the same raw material source, a market place or a mediator, if the difference between their lead isotope (LI) ratios is within the interval of total variance between the LI ratios of an assemblage of artefacts, archaeologically reasoned to represent a single primary copper production signature. To define our LI ratio thresholds, we choose the slag and ingot assemblages from four sites in two areas: Non Pa Wai and Nil Kham Haeng in the Khao Wong Prachan Valley (KWPV) of central Thailand, and Puen Baolo and Thong Na Nguak in the Vilabouly Complex (VC) of central Laos. All four sites are well documented primary copper production loci with both technological and geochemical characterizations (Cadet et al. Reference Cadet, Sayavongkhamdy and Souksavatdy2019; Reference Cadet, Pryce, Dillmann, Sayavongkhamdy, Souksavatdy, Luangkhoth and Chang2022; Natapintu Reference Natapintu, Charoenwongsa and Bronson1988; Pigott et al. Reference Pigott, Weiss and Natapintu1997; Pryce et al. Reference Pryce, Pigott, Martinón-Torres and Rehren2010; Reference Pryce, Brauns and Chang2011b,Reference Pryce, Pollard, Martinón-Torres, Pigott and Pernickac). Assemblages of slag, which represents an anthropogenic and pooled LI signature of minerals (ore, gangue and flux), ceramic (crucible, tuyère and furnace) and fuel ash from these sites produced coherent and easily distinguishable LI production fields. To these fields may be added the LI signatures of raw copper artefacts, identified as ingots, excavated at the respective loci, which corresponded very closely to the associated slag fields. Given the congruence of time, location and technology, it is reasonable to assume these ingots were smelted on site from local minerals. These combined, slag and ingot, LI signatures plot closelyFootnote 3 but not exactly in the same isospace, and these margins can be calculated easily.
We generated a distribution of difference in the three LI ratios: 208Pb/204Pb, 207Pb/204Pb and 206Pb/204Pb, between every pair of samples from the KWPV and, separately, VC groups (Fig. 13). In mathematical terms, for two samples A and B and with LI ratios  $R_i^A < R_i^B $ if
 $R_i^A < R_i^B $ then
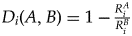 $D_i( {A, \;B} ) = 1-{{R_i^A } \over {R_i^B }}$. Thus. if ratio I for sample A is 80 and ratio I for sample B is 100, B is 20 per cent larger than A. Using the relation between these ratios allows us to account for the fact that LI ratios do not vary linearly, and samples with higher LI ratios can have larger differences in their ratio compositions while still exhibiting consistency.
In Figure 14, we see the maximum differences for our regional production-defined ratios are: 0.7 per cent for 208Pb/204Pb, 0.4% for 207Pb/204Pb, and 2.6 per cent for 206Pb/204Pb. Thus any two random samples with all three ratio differences below these thresholds would be considered provisionally consistent. However, during testing we found that using 100 per cent thresholds was giving excess attributed connectivity in the wider dataset. The reason can be seen in the non-parametric distributions in Figure 14, with large areas under the curve for low variation and disproportionately smaller areas under the curve with higher variation. We therefore experimented with variations from 75 per cent to 95 per cent. The 75 per cent threshold was too strict, eliminating potential consistency attribution from samples that would on an archaeological basis be highly expected to be consistent; ergo typologically, technologically and chronologically compatible artefacts from nearby sites. We settled on applying a 95 per cent threshold, which eliminated the unworkable levels of connectivity but retained previous inter-assemblage consistency attributions made by traditional subjective interpretation and highlighted several new consistencies to be evaluated from an archaeological perspective. A 95 per cent threshold gives the following absolute inter-sample differences for the three ratios:206Pb/204Pb of 1.603 per cent; 207Pb/204Pb of 0.213 per cent; and 208Pb/204Pb of 0.365 per cent.
Distribution of distances between KWPV and VC samples for each lead isotope ratio. Vertical dashed blue lines represent the values for the 75, 85 and 95 percentiles.

We then computed the same measure between all pairs of Myanmar archaeological copper-base consumption samples and all regional Bronze Age copper-base consumption samples, including the southern Chinese assemblages for which suitable LI data are available:Footnote 4
Yunnan – Haimenkou (HMK), Chenggong (CGG), Dabona (DAB), Dali (DL), Lijiang (LG), Lijiashan (LJ), Shizhaishan (SZH), Wanjiaba (WJB), Yangfutou (YGT) (Cui & Wu Reference Cui and Wu2008);
Guangxi – Andengyang (ADY) and Yuanlongpo (YLG) (Anon. 2020).
Following the complex networks community detection approach from Radivojević and Grujić (Reference Radivojević and Grujić2018), but focusing on lead isotope rather than elemental data, as Southeast Asia's geological diversity is more amenable to such an approach than Southeast Europe (Killick et al. Reference Killick, Stephens and Fenn2020), we conducted complex network analysis in two steps (as outlined in the methodology). First we used the LI data to estimate the number of groups with high densities of consistency. These groups represent artefacts sharing consistent isotopic signatures and thus potentially sharing same supply routes/networks: sources of raw materials, market places, producers, merchants, mediators, etc.; theoretically copper for unleaded copper or unleaded bronze, or lead for leaded copper or leaded bronze. In the second step, we linked sites/geographic areas where these artefacts were found, with the number of shared consistent artefacts as a measure of potential relatedness between two sites/areas, creating a network between them and, still following the approach from Radivojević and Grujić (Reference Radivojević and Grujić2018), extracting communities using the Leiden algorithm (Traag et al. Reference Traag, Waltman and van Eck2019). Since Radivojević and Grujić (Reference Radivojević and Grujić2018) used the Louvain algorithm, which exhibited satisfactory computing prowess and robustness, a novel and improved method appeared, the Leiden algorithm, which guaranteed faster computing and enhanced precision. While both algorithms present excellent results when applied to the same dataset (Grujić & Radivojević Reference Grujić, Radivojević, Brughmans, Mills, Munson and Peeplesforthcoming), we opted for the most recent one (Leiden). The Leiden algorithm operates by partitioning the network into clusters of spatial areas that maximize the number of links between areas within the same cluster (or modules), while minimizing the number of links between areas not in the same cluster. In other words, it extracts communities of areas that share consistent artefacts and splits into different communities of areas sharing fewer elements.Footnote 5 This community detection or modularity approach allowed us to model communities of places that may have had interacting populations, whether by means of direct or indirect material culture exchanges, complete or incomplete technological transmissions, or the actual movement of people—as individuals, groups or en masse. While evaluation of these options requires detailed assessment of chronology, typology, alloy type, production methods and socio-economic ascribed values, our approach does give us a means of rationalizing a large and unwieldy database that is otherwise underexploited.
From a regional dataset of 281 Bronze Age (or southern Chinese equivalent) samples, a total of 29 ‘groups’ (GPE, sample level patterning) were computed using the Leiden algorithm (Fig. 15). Nineteen of those consisted of only one sample (no consistency), and of the multi-member groups, GPE20 consists of only two members, CH/CGG/2 & CH/WJB/2, but presents no anomalies as the sites represented are c. 115 km distant and contact might be expected. GPE14 has three members, SEALIP/TH/BPT/4, SEALIP/TH/NNT/9 & CH/HMK/7, of which the latter is c. 1100 km distant but would not surprise regional archaeologists given the Mekong River covers much of the route. GPE21 comprises three members, CH/CGG/4, CH/YGT/1 & CH/YLG/7, of which the first two sites are c. 60 km apart but the latter c. 600 km—we do not feel qualified to comment on the probability of this group, but note that the Pearl River and its tributaries make up much of the route. GPE8 consists of three highly radiogenic samples (SEALIP/TH/PL/1, SEALIP/TH/PL/6 & SEALIP/TH/NNT/8) from northern Thailand, for which consistency is not surprising from an archaeological perspective.
Biplots of LI data from regional Bronze Age assemblages, as processed by our defined consistency thresholds to identify groups of artefacts.

Of the remaining large multi-member groups:
• GPE1 consists of 39 samples from Myanmar, Thailand, Vietnam and Yunnan;
• GPE2 consists of 52 samples from Laos, Myanmar, Thailand, Vietnam, Yunnan and Guangxi;
• GPE3 consists of 40 samples from Myanmar, Thailand, Vietnam, Yunnan and Guangxi;
• GPE4 consists of 8 samples from Myanmar, Thailand, Vietnam and Yunnan;
• GPE5 consists of 79 samples from Laos, Myanmar, Thailand, Vietnam, Yunnan and Guangxi;
• GPE6 consists of 34 samples from Myanmar, Thailand and Yunnan.
Following from groups (samples), we moved on to detecting communities (or modules), which allowed us to assess the presence and degree of connectivity between groups (and hence the sites and areas they originated from). Our schematic representation is non-geographic, but shows the three main communities of sites with metal assemblages comprised of artefacts with algorithmically-consistent LI signatures (Fig. 16). The lines drawn between the sites shows that two sites share at least one sample from the same group. The thickness of those lines is a function of the number of artefacts from similar groups shared by two sites, normalized by the total number of samples a site has.
• The yellow community is comprised of central and southern northeast Thai and north-central Myanma sites;
• The blue community is comprised of northern northeast Thai, central and northern Lao, north-central Myanma and central Guangxi sites;
• The orange community is comprised of northern northeast and southern Thai, northern Vietnamese, north-central Myanma and central and western Yunnan sites.
• The green community is comprised of north-central Myanmar, northern northeast Thai, northern Vietnamese, central Guangxi, central and western Yunnan
Network of sites based on shared artefacts from the same family: each node colour represents a different community detected by the Leuven community detection algorithm. The edges between nodes from within the same community are coloured using the colour of the community. The edges that link nodes from different communities are black.

In order to understand the implications of these computations, it is necessary to add the geographical component (Fig. 17). The dark grey lines equate to a geolocalized projection of Figure 1, the historically reconstructed seventh–thirteenth-century ad SSR, and the other colours represent our communities. What is immediately apparent is the extent of the connectedness of communities, which showcase the Bronze Age metal exchange network. It covers parts of all Mainland Southeast Asia and well into Yunnan and Guangxi, with the exception of Cambodia and central/southern Vietnam, for which there are no late second-/early first-millennium bc metals data. However, we acknowledge that we do not have metal networks extending into northeastern India or beyond Yunnan/Guangxi further north into China, which is critical as the historic SSR served to supply the imperial capital at Xi'an. The lack of an Indian connection at this juncture may be real, as current archaeological data indicate such interactions effloresced from the mid first millennium bc (Bellina Reference Bellina2014; Bellina et al. Reference Bellina, Favereau and Dussubieux2019; Dussubieux & Pryce Reference Dussubieux and Pryce2016), but these cultural exchanges could well have precedents. As concerns China, there is a dearth of archaeometallurgical data from Guangxi, Guangdong and Sichuan, the other provinces close to MSEA, though prehistoric metal assemblages there are plentiful. We acknowledge our lack of familiarity with Chinese archaeology and geology—though we hope interested Chinese colleagues pursue the idea (as they are now doing for general Neolithic and Bronze Age research: see Ma et al. Reference Ma, Lu and Dong2022; Yao et al. Reference Yao, Darré, Zhilong, Lam and Wei2020). In summary, we postulate that the geographical extent of our Bronze Age metal exchange network is equivalent to the historical SSR routes from Yunnan and possibly Guangxi, south into Vietnam, Laos, Thailand and Myanmar.

This does not imply, however, that the nature of those networks is equivalent. Firstly, we note that the reconstructed historical SSR in Figure 1 shows both places (sites and/or regions) and routes, often seen as following riverine lines of communication. Our reconstructed Bronze Age metal network shows only places, with geodesic lines representing isotopic consistency rather than transport. The routes along which Bronze Age metal (and potentially metal technologies) were moved by people is unclear, but could be montane, riverine, marine, or a combination of those (see Pryce Reference Pryce2018). Indeed, when we break down the networks by community (Fig. 18), we see quite distinct patterning that may represent overlapping networks, either contemporary or sequential within our available chronological resolution.
Maps detailing each calculated Bronze Age assemblage community. From top left, an unknown but Kunming-centred copper-consumption network (orange), an unknown southern China-centred copper-consumption network (green), the Vilabouly Complex copper-production network (blue) and the Khao Wong Prachan Valley copper-production network (yellow).

The orange network equates to an unknown primary or secondary copper production signature: thus we cannot be certain in which direction the metal was moving. That said, the major community concentration is in western and central Yunnan, from which it extends 600–800 km southwest to Oakaie in north-central Myanmar. Rivers probably account for these putative exchange networks, the Daying or Nanting and Irrawaddy/Chindwin into Myanmar, with portions of montane portage likely. These are historic SSR routes. The occurrence of the Yunnan-centred distribution community 850–1100 km south at Non Nok Tha, Phu Lon and Ban Tong in northern northeast Thailand is harder to explain as these data are not fully published and scrutinized, but a pathway including the Lancang/Mekong River via southern Yunnan is not implausible and also lies on a historic SSR route. As we have previously stated, community detection is but a guide and we discount the likelihood of Tham Than Nam Lot Yai in southern Thailand participating in this network, but it is not impossible.
The green network also equates to an unknown primary or secondary copper production signature. However, Hebuoso and Shangxihe, near Kunming, sit at what appears to be the apex of this distribution, which extends c. 350 km northwest to Lijiang, c. 600 km east to Andengyang in Guangxi, c. 500 km southeast to Dai Trach, Gò Mun and Thành Dên in northern Vietnam, c. 750 km southwest to Halin in north-central Myanmar and c. 800 km south to Ban Phak Top in northern northeast Thailand. Again, rivers probably account for much of these passages, the Pearl River to Guangxi, the Red River to Vietnam and the aforementioned river systems for the orange network to Myanmar and possibly Thailand, including montane portage. These are also historic SSR routes.
The blue community equates to the central Lao Vilabouly Complex primary copper production signature, suggesting that metal (raw, semi-finished or finished product) were transported north, south and west over scales ranging from 300 km geodesic (Ban Non Wat) to 450 km geodesic (Tham Pà Ping) to 1100 km geodesic (Tham Than Nam Lot Yai) and 1300 km geodesic (Oakaie), also by the tenth or possibly eleventh century bc. We consider it unlikely that VC copper was exchanged c. 770 km north to Yuanlongpo, but the community identification does not interpret for us and can be used to check future typo-technological associations between these areas (Ciarla Reference Ciarla2007). For the northeast Thai sites (and Ban Non Wat has VC signature metal by the Iron Age: Pryce et al. Reference Pryce, Baron and Bellina2014), river routes do seem most likely, using the Mekong and its tributaries. However, for the southern Thai and north-central Myanma assemblages it is again unknown; though marine transport is likely for the south, and even a cross-peninsular transportation and mounting the Irrawaddy River could explain the western distribution. There is no indication that VC metal was exchanged into northern Vietnam or Yunnan but Tham Pà Ping does approach the current Lao/Viet border.
The yellow community equates to the central Thai Khao Wong Prachan Valley primary copper production signature, suggesting that raw metal, semi-finished or finished goods were transported east to the relatively nearby site of Ban Non Wat at c. 180 km distance, but also to Halin and Oakaie, c. 1000 km to the north-northeast by the tenth century bc. Despite being the largest known sites for prehistoric copper production in MSEA (Pigott & Pryce Reference Pigott, Pryce, Higham and Kim2022; Pigott et al. Reference Pigott, Weiss and Natapintu1997; Pryce et al. Reference Pryce, Pigott, Martinón-Torres and Rehren2010), it has long been noted that the distribution for this copper, as reconstructed by lead isotope-based provenance studies, seems to have been limited (see Pryce et al. Reference Pryce, Brauns and Chang2011b; Reference Pryce, Baron and Bellina2014 for possible explanations) and has never been detected in Iron Age consumption assemblages. Given the lack of intermediary sites with KWPV-compatible metal assemblages, the route between central Thailand and north-central Myanmar is unknown, but is probably considerably longer than the geodesic track and may have involved multiple actors. There is no indication that KWPV metal moved north to be consumed in northern northeast Thailand, Laos, Vietnam, Guangxi and Yunnan.
While neither the yellow nor blue communities map onto historic SSR routes, they are certainly coeval with the orange and green communities, which do so map. Indeed, one might have to look at historic Maritime Silk Road pathways to explain parts of the yellow and blue community distributions; the MSR also being suspected of greater antiquity than historical data allow for (Bellina Reference Bellina2014; Dussubieux & Bellina Reference Dussubieux and Bellina2018). It is notable that while varying our threshold from 75 to 95 per cent did impact the number of groups of artefacts detected, the communities of sites remained stable. Furthermore, the proposed model is 6.34 standard deviations away from the mean of randomized model (ran 1000 times), which makes it statistically significant.
Finally, we wish to give consideration to the respective social exchange mechanisms represented by the Bronze Age metal network and the historical SSR. The SSR represented in Figure 1, for the Nanzhao-Dali period, seventh–thirteenth centuries ad, was ultimately a means of supplying required commodities, horses, tea, precious metals, from frontier regions to the imperial state capital at Xi'an. It was a tribute and/or profit-driven phenomenon of a powerful and hierarchical central state (Yang Reference Yang2008). As Yang (Reference Yang2008) also notes, this was not the origin of the historical period SSR in the third–second centuries bc, which was a process motivated by Han military ambitions to seek a direct path to central Asia. From what can be reconstructed of Early Bronze Age MSEA metallurgy, copper/bronze production and consumption behaviours were not solely motivated by market forces for commodities (Pryce Reference Pryce2009; Pryce et al. Reference Pryce, Pigott, Martinón-Torres and Rehren2010; White & Hamilton Reference White, Hamilton, White and Hamilton2019; White & Pigott Reference White, Pigott and Wailes1996). In late second–early/mid first millennium bc MSEA, and in particular the most studied MSEA regions of north-central Myanmar and northeast and central Thailand, copper-base metal has a weak but not invisible correlation with hierarchical behaviours. Instead metal was made and used by and within small, probably independent, communities, both at the few (KWPV, VC and PL) primary production sites (Cadet et al. Reference Cadet, Pryce, Dillmann, Sayavongkhamdy, Souksavatdy, Luangkhoth and Chang2022; Pigott Reference Pigott, White and Hamilton2019; Pryce et al. Reference Pryce, Pigott, Martinón-Torres and Rehren2010; Reference Pryce, Bevan, Ciarla, Rispoli, Malakie, Hassett and Castillo2011a,Reference Pryce, Pollard, Martinón-Torres, Pigott and Pernickac), and also at the more widespread secondary production and consumptions sites (Hamilton & White Reference Hamilton, White, White and Hamilton2019; White Reference White, White and Hamilton2019). There is even solid lead isotope evidence for the movement of copper-base metals and production materials (slag and/or ore) between primary production centres, strongly suggesting an at least partial basis of gifting in metal exchange (as per SEALIP/TH/NPW/1, excluded from our threshold calculation: Pryce et al. Reference Pryce, Brauns and Chang2011b; Reference Pryce, Baron and Bellina2014). With the probable exception of Ban Non Wat in southern northeast Thailand (Higham Reference Higham2011; Reference Higham2022), and possibly those of Khok Charoen in central Thailand and Oakaie/Halin in north-central Thailand (Pradier Reference Pradier2022), the appearance and adoption of copper-base metal does not seem to be coeval with noticeable shifts away from pre-existing Neolithic modes of life (Higham Reference Higham2021; Higham & Cawte Reference Higham and Cawte2021; Pradier Reference Pradier2022; Pradier et al. Reference Pradier, Aung Aung Kyaw, Tin Tin Win, Willis, Favereau, Valentin and Pryce2019; Pryce et al. Reference Pryce, Kyaw and Kyaw2018b; in press; White Reference White, White and Hamilton2019).
Notwithstanding our unwillingness to push our argument into unfamiliar archaeometallurgical territory, namely the provinces of Sichuan, Guangxi, Guangdong and Guizhou, perhaps the termination of our reconstructed networks (Figs 17 & 18) in Yunnan is indicative of the socio-political reality of late second- to early–mid first millennium bc southern China. If the Han conquest of the Dian kingdom in the second century bc was intended to subdue a ‘frontier’ territory and population, then perhaps the relatively integrated southern metal networks simply did not exist into central China 800–900 years prior. That is not to say no contact or interaction, but not of the intensity that saw KWPV and VC metals move over 1000 km geodesic from the very outset of the Myanmar Bronze Age (Pryce et al. Reference Pryce, Htwe and Georgakopoulou2018a), as well as the Yunnan-centred distributions evidenced in this paper. That the Vietnamese Bronze Age does not fit the general MSEA pattern recalls the third-century bc SSR network as reconstructed in Figure 2. In conclusion, we do not argue for a literal prehistoric incarnation of the historic SSR with all its associated economic and political associations. Rather we posit that the long-dated pre-existence of widespread connectivity of reasonable intensity, via rivers and possibly across mountain ranges, would have allowed the SSR to flourish once the Han state achieved control of Yunnan.
Acknowledgements
We offer our particular thanks to Daw Kalayar Myat Myat Htwe, who has longstanding interests in Myanmar archaeometallurgy and who helped us obtain the geological samples for this study, and also Daw Cherry Thin, who allowed us access to previously excavated material in the Halin National Musem. The freshly excavated samples came from the fieldwork of the Mission Archéologique Française au Myanmar, which was funded by the Commission Consultative de Fouilles of the Ministère de l'Europe et des Affaires Etrangères during the period 2013–2020. The analytical data in this paper derive from the Agence National de Recherche-funded project ‘BROGLASEA’ (https://anr.fr/Project-ANR-16-CE27-0011). The statistical processing of BROGLASEA data was conducted under the auspices of the Fondation Fyssen-funded project, ‘Network Analysis for Archaeometallurgy, and Beyond’ (NAAMB). We also thank the National Institute for Mathematical and Biological Synthesis (NIMBioS) for the IT support. We wish to thank the two anonymous reviewers for their constructive criticism.