Introduction
Aluminum-doped zinc oxide (AZO) thin film is one of the most promising transparent conductive oxide (TCO) materials for a front electrode in a solar cell.[Reference Liu, Avrutin, Izyumskaya, Özgür and Morkoç1] An AZO layer must have both properties of high conductivity and high transparency. In addition, to improve the efficiency of the device, the AZO front layer requires optical properties of light scattering, which is obtained by making a rough surface on the film or the substrate.[Reference Müller, Rech, Springer and Vanecek2] Some previous studies focused on the roughness of the TCO surface, which was made by wet-chemical etching using weak or diluted acids, such as hydrochloric acid.[Reference Yan, Li, Aberle and Venkataraj3–Reference Koshino, Tang, Sato, Shimizu, Fujii, Hanajiri and Shirai6] Other previous studies focused on the roughness of the substrate surface, which was produced by etching with hydrofluoric acid or a standard reactive ion etching process.[Reference Hwang, Nam, Jung, Lee, Yang and Boo7,Reference Hongsingthong, Krajangsang, Yunaz, Miyajima and Konagai8] These studies report that the haze value is increased by the formation of a rough surface; however, no studies have investigated the effect of surface roughness on other film properties. In this work, we focus on the effect of rough surface on other characteristics such as optical band gap properties, as it is one of the most important features for solar cell applications. We prepared roughened substrates by abrasive papers on a rotary polishing machine. AZO thin film was prepared by film deposition on the substrates with radio frequency (RF) magnetron sputtering, followed by post-annealing. The effect of roughness on various AZO properties has been investigated, compared with the sample on a not-roughened substrate. In addition, we employed various different substrates other than glass, including quartz plate, and investigated the possible cause of the AZO properties change.
Experimental
We prepared various types of substrates with different coefficients of thermal expansion (CTE), including glass slide (87 × 10−7/K), quartz (5.5 × 10⁻⁷/K), soda lime (87 × 10−7/K), and white plate (100 × 10−7/K). The roughened substrates were prepared by roughening the surface with two kinds of abrasive papers using a rotary polishing machine. The grit sizes of abrasive papers were 220P and 2000P, and the duration for roughening was 2 min. AZO films were deposited with RF magnetron sputtering (reactive sputtering) using a Zn target (99.9% purity) of 75 mm in diameter, where three metallic Al chips (99.99% purity) of 5 × 5 mm were positioned on the target for Al doping. For the deposition, the vacuum chamber was evacuated until attaining background pressure of 1 × 10⁻³ Pa. Both roughened and non-roughened substrates were cleaned by ultrasonic cleaning in ethanol, followed by drying in air. For sputtering, an argon gas flow of 30 sccm was used, simultaneously with an oxygen gas flow, which was also kept at 30 sccm. The RF input power was fixed at 100 W, and the substrate was not heated during deposition. The prepared AZO films were then annealed at 823 K for 30 min under a hydrogen atmosphere. After the first annealing, hydrogen atmosphere was exchanged and then the second annealing was conducted with the same condition. As-grown AZO films generally exhibit an n-type conductivity because of the existence of intrinsic defects such as Al interstitials, Zn interstitials, and oxygen vacancies, while post-annealing modifies these defects, especially increases the concentration of oxygen vacancy and improves their electrical properties.[Reference Wu, Chen and Lu9] Crystal structures of AZO films were investigated using x-ray diffractometry (XRD) with Cu Kα radiation (at 40 kV and 30 mA), operated under the θ–2θ mode (RINT 2100, Rigaku, Tokyo, Japan). Sheet resistance was measured by a four-point probe method. Surface morphology and roughness of AZO films were examined by a scanning electron microscope (SEM, HITACHI SU6600) and a digital microscope (VHX-5000, KEYENCE). Distribution of the elements in films was examined by SEM/EDS (energy-dispersive x-ray spectrometer). A UV/VIS/NIR spectrometer (Lambda 750, PerkinElmer) was used to determine the transmission spectra of AZO films ranging from 200 to 800 nm. The optical properties, both visible transmittance and haze values in the range of 380–760 nm range, were calculated from the result of the spectrometer. The haze value is one of the widely accepted parameters to represent the light-scattering capabilities of a rough surface.[Reference Venkataraj, Wang, Vayalakkara and Aberle10,Reference Yan, Venkataraj and Aberle11] It is defined as a ratio of diffuse transmittance (Tdiff) to total transmittance (Ttotal), as shown in Eq. (1):
 $${\rm Haze}\,{\rm (\%)} = \; \displaystyle{{T_{{\rm diff}}} \over {T_{{\rm total}}}}\; \times 100\%. $$
Result and discussion
Light scattering
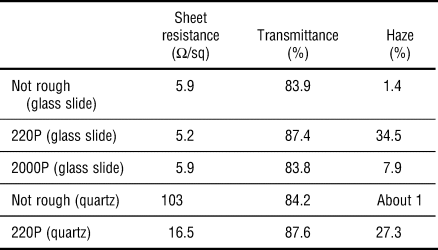
Table I shows typical electrical sheet resistance, optical transmittance, and visible-range haze values of AZO films on roughened glass slides and quartz plates, compared with those on not-roughened substrates. It is clear that, by roughening the surface, the haze value and accordingly the degree of light scattering are increased for both substrates, retaining other important properties such as sheet resistance and visible transmittance. Both films on glass slide and quartz plates roughened by 220P abrasive paper exhibit high haze values of around 30%, which is crucial for high-efficiency thin film solar cells. The grit size of 2000P abrasive paper is smaller than 220P abrasive paper, which may lead to the less-rough substrate surface for the former. The corresponding haze value for the former (with 2000P paper) is smaller than the latter (with 220P paper), as shown in Table I. Further, an AZO film on a frost glass substrate (Table S1), which had more-roughened surface, showed an even-higher haze value compared with the 220P sample (see Section 4 in the Supporting Material for details). It can be said that the degree of surface roughness is closely related to the light-scattering ability, and the rougher the substrate surface is, the higher the haze values of AZO films would be.
Electrical and optical properties of AZO films on glass slide and quartz plate.

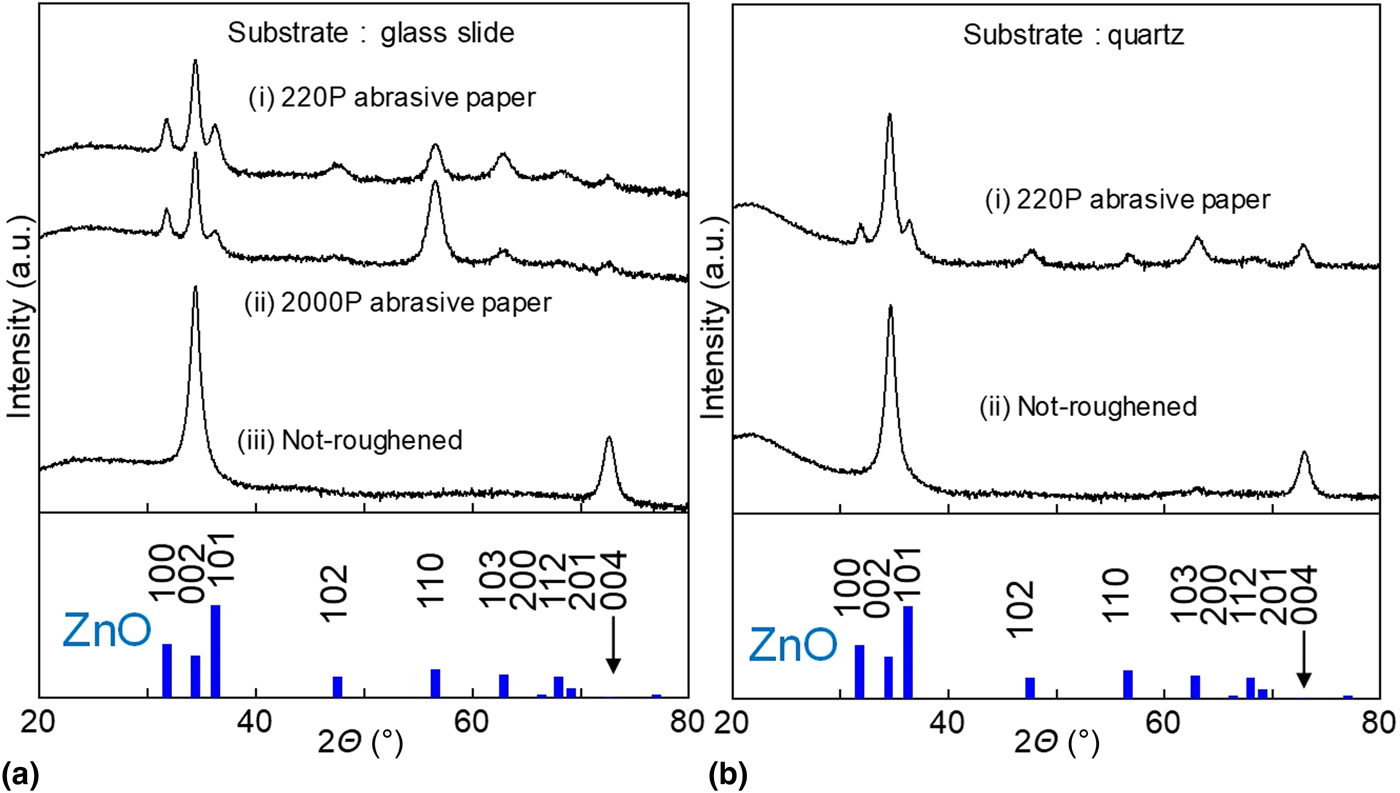
The physical properties of AZO films, in particular the sheet resistance, are also varied, depending on the roughness of the substrate surface. The sheet resistance of AZO films on quartz substrate is monotonously increased day by day at room temperature, where the degradation is mitigated by the formation of the roughened surface. The sheet resistance became unmeasurable in 20 days for an AZO film on the smooth (not-roughened) surface, while it reached only 44.8 Ω/sq (from 16.5 Ω/sq) for the 220P sample. The cause is likely originated from the difference in CTEs between AZO and quartz. The CTE of quartz is 5.5 × 10⁻⁷/K, while the CTE of ZnO is 39 × 10−7/K. The difference would induce internal tensile stress when the sample was cooled after the sputtering. Although the sample was not heated during the deposition process, the temperature should, in general, increase due to the high energy of atomic bombardment during the sputtering. This may lead to the formation of cracks in the film as the time passes, as shown in the surface analysis by SEM (Fig. S1). It is considered that the internal tensile stress is somewhat relieved by the surface roughness due to many high-angle grain boundaries and gaps of crystals derived from rather random crystal growth, as confirmed by XRD results (Fig. 1: more description in section ‘Crystalline texture’). Thus, the sheet resistance was not largely increased for the AZO films on the quartz roughened by 220P abrasive paper.
XRD spectra of various AZO films on: (a) glass slide, and (b) quartz plate. (a) (i) Roughened by 220P abrasive paper (a = 3.255, c = 0.521), (ii) roughened by 2000P abrasive paper, (iii) not roughened. (b) (i) Roughened by 220P abrasive paper (a = 3.250, c = 0.520), (ii) not roughened. Below peak spectra are from the reference of ZnO.[Reference Deshmukh, Patil, Yusuf, Rajarajan and Lalla12]

Crystalline texture
Figure 1 shows XRD spectra of various AZO samples on (a) glass slide substrates, and (b) quartz plate, where both roughened and not roughened substrates are used for glass slide and quartz plate. Many peaks are confirmed for surface-roughened samples. It suggests that crystals grow various directions by roughening the surface of substrates.
Blue shift of band gap by surface roughening
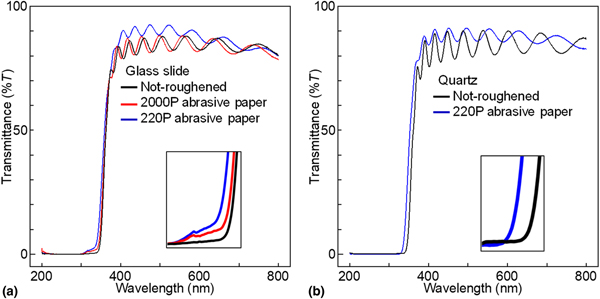
Figure 2 shows a typical variation of optical transmittance of AZO films, measured by the spectrometer, on both roughened and non-roughened substrates of (a) glass slide, and (b) quartz plate. For each sample, clear interferences of light waves are observed. The absorption edges in both (a) and (b) figures exhibit clear blue shifts for the roughened samples (roughened with abrasive papers) compared with the not-roughened samples. Band gap values were estimated from these results on various AZO films using Tauc plot (Fig. S4): from Fig. 2(b), 3.56 eV for pristine (not-roughened) quartz sample and 3.68 eV for roughened (220P) quartz sample.
Optical transmittance of various AZO films on: (a) glass slide, and (b) quartz plates. Black line indicates not-roughened sample, blue line roughened by 220P paper, and red line roughened by 2000P. The inset figures show enlarged absorption edges.
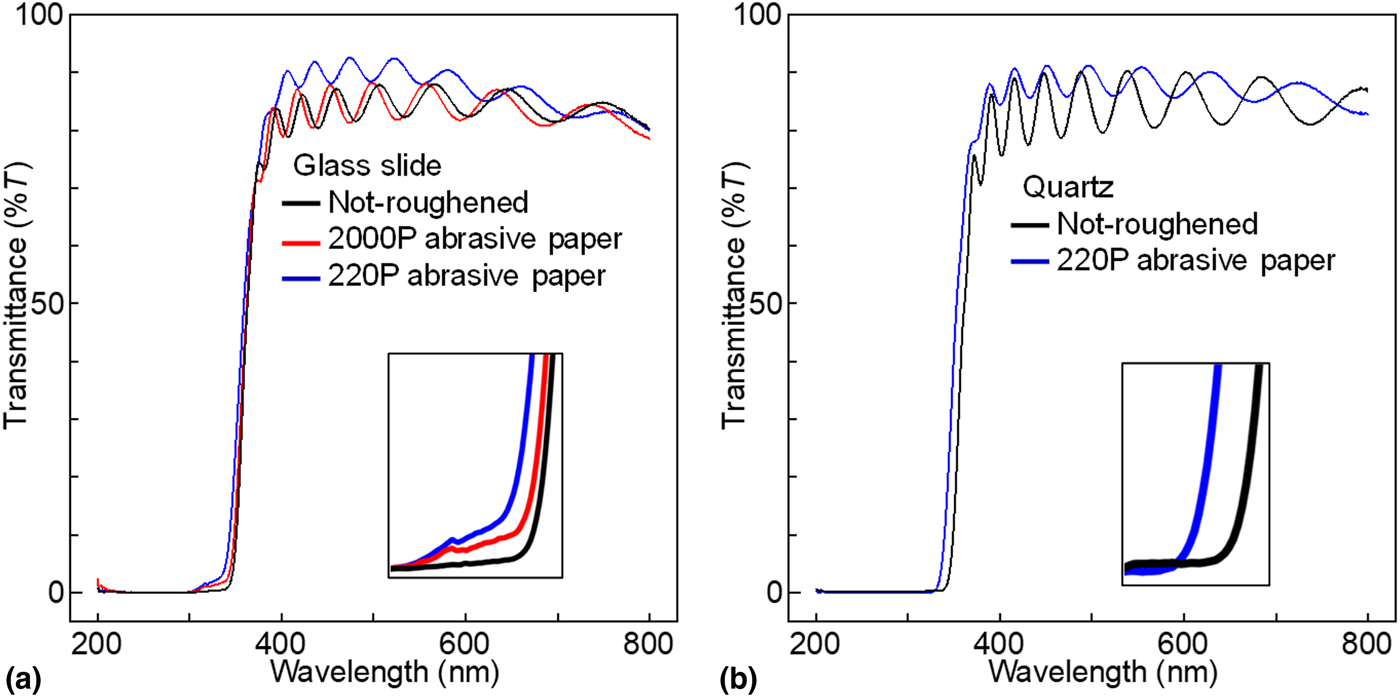
One of the possible causes of this blue shift could be the change of the crystalline texture detected by XRD results. As the optical path is varied inside AZO crystals, with various defect structures, the optical properties might be modified. According to our thought experiment below, however, it is speculated that this is not likely the case. We measured the optical properties of AZO films on pristine (not roughened) glass slides, with varying incident light angles (Fig. S5). As the sample exhibits strong (002) texture, as shown in Fig. 1(a)(iii), this experimental setup can be considered partially similar to the optical measurement on different crystal orientations. As shown in Fig. S6, absorption edges were not modified with varying the angles from 0° to 17.4°, where the light interference effect is rightly varied. Thus, it can be said that there is likely no direct relationship between crystal orientation and the blue shift.
Another possible cause of this blue shift is the difference in CTEs between the substrate and the AZO film (the CTE of AZO is assumed similar to ZnO). The residual stress inside films is often discussed as the cause of the band gap shift. Our results strongly indicate, however, that this is unlikely the case. Figure S7 shows optical properties (transmittance) of AZO films on four kinds of substrates with various CTEs, measured by the spectrometer. All four absorption edges coincide well. Hence, there is likely no relationship between CTE and the blue shift.
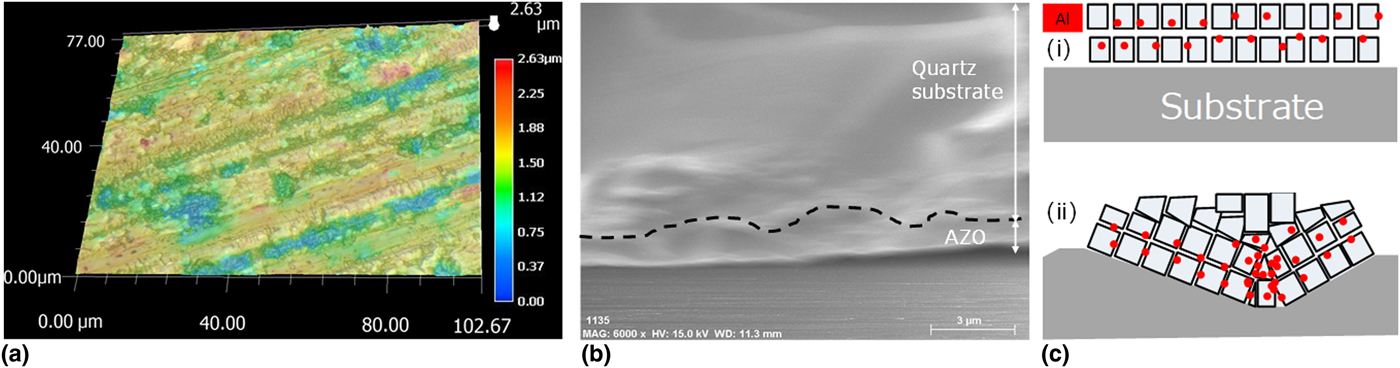
The most plausible explanation of the blue shit is the so-called Burstein–Moss (BM) effect due to the change of Al content in AZO films. In a heavily-doped n-type semiconductor, the bottom of the conduction band is fully occupied by donor electrons, and the optical transitions from the valence band may only occur for higher photon energies due to blocking of low-energy transitions, resulting in an apparent band gap widening. Figure 3(a) shows a digital microscope image (plan view) of AZO film on the glass slide roughened by 220P abrasive paper, and Fig. 3(b) shows an SEM cross-sectional observation of AZO film on the quartz plate roughened by 220P abrasive paper. From these results, it is expected that AZO was deposited on the rough surface as shown in Fig. 3(c)(ii) of the schematic diagram. It means that a fraction of the high-angle grain boundary was increased by continuous deposition of Al, Zn, and O atoms on the rough surface (through nucleation and growth of crystals) rather than AZO on the plane surface [Fig. 3(c)(i)]. It is speculated that Al would be segregated at the grain boundaries (or amorphous-like regions) during sputtering, and the following post-annealing would cause Al diffusing into the grains, as well as formation and/or growth of AZO crystals. This speculation is also consistent with the XRD results of post-annealed AZO films (Fig. 1), in that roughened substrates lead to macroscopically less-textured AZO films. Then, the total (or average) Al content would be slightly higher in the film on the rough substrate, compared with the not-roughened sample, leading to the blue shift of the absorption edges due to the BM effect.
Surface condition of AZO films. (a) Digital microscope image (plan view) of AZO film on the glass slide roughened by 220P abrasive paper. (b) SEM cross-sectional observation of AZO film on quartz plate roughened by 220P abrasive paper. The broken line indicates a boundary between substrate and AZO film (confirmed with EDS analysis). (c) Schematic diagram of AZO deposition: red dots indicate Al content.

Although the above scenario is one plausible explanation, there are many unknowns, particularly the location of Al atoms and the special effect on the AZO properties. It is known that the band gap shift of AZO films depends on the production method. There is a possibility that this band shift does not occur by other methods or conditions except for RF sputtering. If the cause of the shift is the Al segregation during the deposition, the method and the condition of AZO film production should have a strong impact on other AZO properties as well. Upon considering the application of AZO material, especially for a thin film solar cell, our work presented here may cast a new perspective on this subject.
Conclusion
AZO films were deposited on various roughened substrates using an RF magnetron sputtering method. The films on glass slides roughened by 220P abrasive paper exhibited high haze values around 34.5%, retaining other important properties such as conductivity and transparency, which is crucial for a high-efficiency thin film in solar cells. The haze value was increased with the degree of substrate surface roughness. Optical band gap properties are modified as well, where the absorption edges show a clear blue shift by roughening the surface of substrates. The cause can be originated from variation in the Al content due to the different deposition and post-annealing mechanisms of AZO films on the roughened surface. Substrate surface roughening can thus improve the performance of a thin film solar cell through increasing the haze values, while it may change the mechanism of crystal growth of AZO. This may lead to affecting the band gap that is one of the most important properties of a thin film solar cell.
Supplementary material
The supplementary material for this article can be found at https://doi.org/10.1557/mrc.2019.66.