Giant ragweed is an erect, summer annual, broadleaf weed species belonging to the Asteraceae family. The two main characteristics endowing weediness of giant ragweed are abundant pollen production and the capacity to reduce crop yields. Over a billion pollen grains may be disseminated from a single plant throughout anthesis (Johnson et al. Reference Johnson, Loux, Nordby, Sprague, Nice, Westhoven and Stachler2007), with such prolific pollen production being the primary cause of allergic rhinitis and bronchial asthma in humans (Bassett and Crompton Reference Bassett and Crompton1982; Makra et al. Reference Makra, Juhász, Béczi and Borsos2005). The competitiveness of giant ragweed in corn (Zea mays L.) and soybean [Glycine max (L.) Merr.] production is attributable to an early and prolonged emergence period, rapid growth rate, high leaf area index compared with other weeds and crops, plastic growth habit, and the structural cellular components required to grow up to 6 m in height (Abul-Fatih and Bazzaz Reference Abul-Fatih and Bazzaz1979a, Reference Abul-Fatih and Bazzaz1979b; Johnson et al. Reference Johnson, Loux, Nordby, Sprague, Nice, Westhoven and Stachler2007).
Grain yield losses from giant ragweed interference are generally greater in soybean than corn and have been reported as greater than those of any other summer annual weed (Moechnig Reference Moechnig2003; Schutte Reference Schutte2007). Soybean grain yield loss was 48% when competing with giant ragweed at a density of 1 plant 3.42 m−2, and higher giant ragweed densities resulted in near-complete grain yield loss (Baysinger and Sims Reference Baysinger and Sims1991). At a density of 1 giant ragweed plant m−2, Webster et al. (Reference Webster, Loux, Regnier and Harrison1994) reported a 45% to 77% grain yield loss in soybean. Furthermore, the critical weed-free period in soybean competing with giant ragweed is approximately twice as long as that seen with other common weeds (Baysinger and Sims Reference Baysinger and Sims1991; Van Acker et al. Reference Van Acker, Swanton and Weise1993).
Grower surveys regularly report giant ragweed as one of the most problematic weeds throughout the Midwest. In 2005 and 2006, giant ragweed was one of the three most troublesome weeds in Illinois, Iowa, and Indiana fields with a glyphosate-resistant (GR) corn–soybean rotation (Kruger et al. Reference Kruger, Johnson, Weller, Owen, Shaw, Wilcut, Jordan, Wilson, Bernards and Young2009b). In Indiana, a survey conducted by Gibson et al. (Reference Gibson, Johnson and Hillger2006) concluded giant ragweed was the most problematic weed in corn–soybean rotations in addition to continuous corn systems. A survey of certified crop advisors throughout the Corn Belt rated giant ragweed as one of the most troublesome weeds in nearly half of responding counties (Regnier et al. Reference Regnier, Harrison, Loux, Holloman, Venkatesh, Diekmann, Taylor, Ford, Stoltenberg, Hartzler, Davis, Schutte, Cardina, Mahoney and Johnson2016). A primary cause of being a sustained nuisance is the existence of giant ragweed biotypes that have developed resistance to both acetolactate synthase (ALS)-inhibiting herbicides and glyphosate (Johnson et al. Reference Johnson, Loux, Nordby, Sprague, Nice, Westhoven and Stachler2007); 57% of responding counties throughout the Corn Belt cite giant ragweed populations with resistance to either or both of these herbicide groups (Regnier et al. Reference Regnier, Harrison, Loux, Holloman, Venkatesh, Diekmann, Taylor, Ford, Stoltenberg, Hartzler, Davis, Schutte, Cardina, Mahoney and Johnson2016).
Resistance to ALS-inhibiting herbicides (ALS-R) in giant ragweed was first reported by Patzoldt and Tranel (Reference Patzoldt and Tranel2002) in a population from Seymour, IN. This population displayed resistance to the sulfonylurea, imidazolinone, and triazolopyrimidine chemical classes, and DNA sequencing of ALS confirmed a Trp-574-Leu mutation known to endow resistance. Giant ragweed biotypes with this mutation are highly resistant to ALS inhibitors (>500-fold), and moreover, resistant plants have equal competitive ability, fecundity, and seed viability compared with susceptible plants (Marion et al. Reference Marion, Davis and Stoltenberg2017). Currently, ALS-R giant ragweed has been reported in seven states in the United States and Ontario (Heap Reference Heap2017).
The first report of GR giant ragweed was in Ohio in 2004 and was later characterized by Stachler (Reference Stachler2008). Populations of GR giant ragweed have been found that display a unique herbicide resistance response whereby mature leaves rapidly become necrotic within 2 to 6 h after glyphosate treatment, and the immature tissue of these plants turns chlorotic, but the plants resume growth in a matter of days (Moretti et al. Reference Moretti, Van Horn, Robertson, Segobye, Weller, Young, Johnson, Sammons, Wang, Ge, d’Avignon, Gaines, Westra, Green, Jeffery, Lesperance, Tardif, Sikkema, Hall, McLean, Lawton and Schulz2017; Van Horn et al. Reference Van Horn, Moretti, Robertson, Segobye, Weller, Young, Johnson, Schulz, Green, Jeffery, Lesperance, Tardif, Sikkema, Hall, McLean, Lawton, Sammons, Wang, Westra and Gaines2017). In addition to the rapid-response (RR) biotype, GR giant ragweed populations have also been discovered that display a non–rapid response (NRR) in which plants become chlorotic at the apical meristem and have stunted growth but resume growth within 1 to 2 wk (Norsworthy et al. Reference Norsworthy, Jha, Steckel and Scott2010, Reference Norsworthy, Riar, Jha and Scott2011; Van Horn et al. Reference Van Horn, Moretti, Robertson, Segobye, Weller, Young, Johnson, Schulz, Green, Jeffery, Lesperance, Tardif, Sikkema, Hall, McLean, Lawton, Sammons, Wang, Westra and Gaines2017). Therefore, it is likely that two distinct GR mechanisms exist in giant ragweed. At present, GR giant ragweed has been reported in 13 states and Ontario; however, no distinction has been made with respect to the specific phenotypic responses to glyphosate within these populations (Heap Reference Heap2017).
The magnitude of glyphosate resistance (MOR), as determined by dose–response experiments, has ranged from 3.3 in Wisconsin to 3.5 in southwestern Ontario for NRR giant ragweed and from 2.3 in Indiana to 7.5 in southwestern Ontario for RR giant ragweed based on GR50 estimates (Van Horn et al. Reference Van Horn, Moretti, Robertson, Segobye, Weller, Young, Johnson, Schulz, Green, Jeffery, Lesperance, Tardif, Sikkema, Hall, McLean, Lawton, Sammons, Wang, Westra and Gaines2017). However, such research on the MOR in giant ragweed has not been conducted in the presence of nonsterilized field soil, a factor likely to lead to erroneous conclusions, as has been elucidated by Schafer et al. (Reference Schafer, Hallett and Johnson2012). Reduced translocation is at least partially the cause of glyphosate resistance in RR plants, as 20% less [14C]glyphosate was mobilized compared with glyphosate-susceptible (GS) plants at 48 h after treatment (HAT) (Moretti et al. Reference Moretti, Van Horn, Robertson, Segobye, Weller, Young, Johnson, Sammons, Wang, Ge, d’Avignon, Gaines, Westra, Green, Jeffery, Lesperance, Tardif, Sikkema, Hall, McLean, Lawton and Schulz2017). In both RR and NRR populations, glyphosate resistance was not related to mutations in EPSPS sequence, EPSPS copy number, EPSPS abundance, or EPSPS activity (Van Horn et al. Reference Van Horn, Moretti, Robertson, Segobye, Weller, Young, Johnson, Schulz, Green, Jeffery, Lesperance, Tardif, Sikkema, Hall, McLean, Lawton, Sammons, Wang, Westra and Gaines2017). Thus, glyphosate resistance in giant ragweed distinctly differs from previously characterized glyphosate resistance mechanisms in other weed species.
The objectives of this study were to: (1) identify the distribution and frequency of ALS-R and GR giant ragweed biotypes in Indiana; (2) develop a rapid, high-throughput, nondestructive assay to simultaneously screen for ALS-R plants in conjunction with whole-plant glyphosate resistance testing; (3) determine whether the phenotypic response to glyphosate influences the MOR in the presence of nonsterilized field soil; and (4) characterize the photo-oxidative stress response in GR biotypes by measuring photosystem II (PS II) efficiency and H2O2 generation.
Materials and Methods
Seed Collection and Sources
Giant ragweed seed was collected during the fall of 2014 from putative GR plants in Indiana corn and soybean fields. Fields were selected by three predominant methods: (1) contact from growers experiencing poor glyphosate performance, (2) contact from agricultural retailers and agronomists, and (3) personal observations of fields with poor giant ragweed control. Therefore, collection was nonrandom but is consistent with other herbicide-resistant weed surveys (Burgos et al. Reference Burgos, Tranel, Streibig, Davis, Shaner, Norsworthy and Ritz2013; Ellis et al. Reference Ellis, Steckel, Main, de Melo, West and Mueller2010; Falk et al. Reference Falk, Shoup, Al-Khatib and Peterson2005; Vink et al. Reference Vink, Soltani, Robinson, Tardif, Lawton and Sikkema2012). At each field, GPS coordinates were recorded and seed heads were clipped from 10 plants following the methods outlined by Burgos et al. (Reference Burgos, Tranel, Streibig, Davis, Shaner, Norsworthy and Ritz2013) for allogamous species such as giant ragweed. Seed heads from each field were combined in paper bags and treated as composite samples. Samples were dried at 30 C in the greenhouse for 2 wk and processed using a soybean thresher, and clean seed was stored in plastic bags at 4 C. Additional seed from giant ragweed populations in Illinois, Nebraska, and Ontario were provided by Stephen Weller, Fred Roeth, and Peter Sikkema to be used in the glyphosate dose–response experiment.
Plant Propagation
Before planting, seed lots were stratified in a 3:1 mixture of sand to soil for 8 wk following a process described by Westhoven et al. (Reference Westhoven, Davis, Gibson, Weller and Johnson2008) to alleviate dormancy. Each population was sown in 25- by 50-cm flats containing commercial potting media (Sun-Gro® seedling mix, Sun-Gro Horticulture, Bellevue, WA 98008) and placed in the greenhouse with day and night temperatures of 30 and 25 C, respectively. Natural lighting was supplemented by high-pressure sodium bulbs delivering 1,100 μmol m−2 s−1 photon flux density set to a 16-h photoperiod. Once seedlings reached the 1-node growth stage (first true leaves fully expanded), they were transplanted to 10-cm2 pots containing growing media consisting of 50% potting media, 25% nonsterilized field soil, and 25% nonsterilized sand. Soil microbes have been shown to influence glyphosate efficacy in giant ragweed (Schafer et al. Reference Schafer, Hallett and Johnson2012); therefore, field soil was included in the growing media to more accurately represent in situ circumstances. To maintain optimum growth, plants were watered daily and fertilized weekly with a macro- and micronutrient fertilizer (Jack’s Classic Professional 20-20-20, JR Peters, Allentown, PA 18106).
Screening of Putative Herbicide-Resistant Populations
Each giant ragweed population was screened for resistance to glyphosate using a whole-plant bioassay and for resistance to ALS inhibitors using a newly designed single-nucleotide polymorphism (SNP) genotyping method for giant ragweed described later. Plants were treated with glyphosate at the 4- to 5-node growth stage and arranged in a randomized complete block design with 10 replications. Three plants from each population were used as nontreated controls. The screening was conducted twice.
Glyphosate-Resistance Testing
A discriminatory dose of glyphosate (Touchdown HiTech®, Syngenta Crop Protection, Greensboro, NC 27419) was applied at 2.5 kg ae ha−1. This dose has been used previously to differentiate GS from GR giant ragweed and minimizes the risk for false positives (Westhoven et al. Reference Westhoven, Davis, Gibson, Weller and Johnson2008). A nonionic surfactant (NIS) (Activator-90, Loveland Products, Loveland, CO 80538) was added at 0.25% v/v. Treatment was applied using a single-nozzle spray booth calibrated to deliver 140 L ha−1 at a pressure of 207 kPa.
Characterization of GR populations closely followed methods used by Davis et al. (Reference Davis, Gibson and Johnson2008) and Kruger et al. (Reference Kruger, Davis, Weller, Stachler, Loux and Johnson2009a). Individual plants were considered GR with a visual injury rating of 70% or less at 21 d after treatment (DAT). Any population with at least one GR plant in both experimental runs was classified as a GR population. Glyphosate-resistant populations were further classified as RR, NRR, or segregating between both (Seg) based on their phenotypic response to glyphosate.
Development of a SNP Genotyping Method to Detect ALS-R Giant Ragweed
Ten known ALS-R and ALS-S giant ragweed plants were used to develop a high-throughput, nondestructive assay following the TaqMan® technique to screen for resistant individuals. This methodology has been used by other researchers to detect SNPs conferring herbicide resistance in a number of weeds (Délye et al. Reference Délye, Michel, Bérard, Chauvel, Brunel, Guillemin, Dessaint and Le Corre2010; Warwick et al. Reference Warwick, Xu, Sauder and Beckie2008, Reference Warwick, Sauder and Beckie2010), but has yet to be adapted for ALS-R giant ragweed. The primary advantage of this method is that resistant and susceptible alleles may be differentiated in a single reaction by fluorescent probes via qRT-PCR, thus bypassing the need for gel electrophoresis.
Genomic DNA was extracted from young leaf tissue following a modified cetyl timethylammonium bromide (CTAB) method originally designed by Saghai-Maroof et al. (Reference Saghai-Maroof, Soliman, Jorgensen and Allard1984). Primers and TaqMan® probes were synthesized by ABI (Applied BioSystems, Grand Island, NY 14072) to flank amino acid position 574 of ALS and discriminate between resistant and susceptible alleles using the cDNA sequence deposited at http://weedscience.org/sequence/sequencedetails.aspx?SequenceID=54. Forward and reverse primers were 5′-ACTTAACAATCAGCATTTGGGTATGGT-3′ and 5′- CTAAGTAGGTATGAGCCCGATTCG-3′, respectively. Probes used to overlap the mutation site were 5′-CCGATCCTCCCACTGAA-3′ [carboxyfluorescein (FAM) fluorophore] and 5′-CCGATCCTCCAACTGAA-3′ [4,7,2-trichloro-7-phenyl-6-carboxyfluorescein (VIC) fluorophore].
A 10-µl reaction was prepared for each sample using 2 µl 5X GoTaq Flexi buffer, 1.2 µl 25 mM MgCl2, 0.5 µl 10 mM dNTP, 0.5 µl 20X primers and TaqMan® probes, 0.2 µl GoTaq Flexi polymerase (5 U µl−1), and 1 µl genomic DNA. Reactions were amplified with the use of a CFX384 RT-PCR detection system (Bio-Rad Laboratories, Hercules, CA 94547), and cycling conditions were as follows: 2 min at 95 C; 39 cycles of 95 C for 15 s and 60 C for 1 min; followed by a plate read after every cycle. Bio-Rad CFX Manager software was used to distinguish between homozygous-resistant, homozygous-susceptible, and heterozygous ALS alleles based on the relative fluorescence of each probe.
ALS Inhibitor–Resistance Testing
Young leaf tissue was collected before glyphosate application from the same 10 plants used in the GR screen described earlier. DNA extraction and qRT-PCR procedures were as described earlier. Three no-template controls and three positive controls each from known ALS-R and ALS-S individuals were included in each reaction. The ALS-R population was collected from a soybean field near Fowler, IN, and survived a discriminating dose of 54 g ai ha−1 cloransulam in the greenhouse. Samples identified to be heterozygous were classified as ALS-R, as these individuals survive field use rates of ALS inhibitors (Patzoldt and Tranel Reference Patzoldt and Tranel2002).
Glyphosate Dose Response
To determine whether the RR or NRR biotypes of giant ragweed differ in their magnitude of glyphosate resistance, a greenhouse glyphosate dose–response experiment was conducted. Using field-collected seed, six populations were evaluated: IL 01 (GS), IN 23 (GS), NE 01 (NRR), IN 16 (NRR), CAN 06 (RR), and IN 03 (RR). These populations were selected based on their homogeneous response to glyphosate in preliminary experiments, as no segregation was found within populations. Glyphosate was applied to 4- to 5-node giant ragweed; doses were as follows: 0, 0.007, 0.03, 0.06, 0.11, 0.22, 0.45, 0.90, and 1.79 kg ha−1 for GS populations; and 0, 0.08, 0.33, 0.66, 1.31, 2.63, 5.25, 10.5, and 21.0 kgha−1 for GR populations. All treatments included NIS at 0.25% v/v and were applied as previously described. The experiment was arranged as a randomized complete block design consisting of six replications and was performed twice. Plants were assessed visually for injury at 1, 3, 7, 14, and 21 DAT. Plant survival (presence or absence of green tissue) was recorded at 21 DAT, followed by shoot tissue harvest. This material was dried at 45 C until constant weight to determine dry weight reduction compared with the nontreated control.
Photo-Oxidative Stress Assays
The following assays were used to characterize the degree of photo-oxidative stress present in GS, RR, and NRR giant ragweed biotypes following glyphosate application.
Chlorophyll Fluorescence Imaging
Five-node plants from populations IN 23 (GS) and IN 13 (RR) were sprayed with 0.7 kg ha−1 glyphosate plus NIS at 0.25% v/v as previously described. A leaf on the third node was detached at 0, 6, and 12 HAT. The maximum quantum yield of PS II (F v/F m) was measured using an Imaging-PAM fluorometer IMAG-MAX/GS with a mounted LED-array illumination unit IMAG-MAX/L and CCD camera and analyzed with ImagingWin software (Heinz Walz GmbH, Eichenring 6, 91090, Effeltrich, Germany). Plants were dark acclimated for 10 min before measurements to enable plastoquinone QA of PS II to become oxidized and allow for maximal photochemical quenching. Each leaf was measured at three areas of interest (AOI) in the intercostal regions close to the main vein and intercostal regions close to secondary veins. ImagingWin software records the values of all pixels within a single AOI and calculates the average. To determine minimum fluorescence yield (F o), a reading was taken using weak, nonactinic modulating light. A saturation pulse was then applied to reduce QA, and a measurement was taken to determine maximum fluorescence yield (F m). Equation 1 was used to calculate maximum quantum yield where F v is variable fluorescence:
 $${\scale92%{{\rm Maximum}\,{\rm PS}\,{\rm II}\,{\rm quantum}\,{\rm yield\,{\equals}}\,{{F_{\rm v}} \over {F_{\rm m}}}\,{\equals}\,{{\left( {F_{\rm m}\,{\minus}\,F_{\rm o}} \right)} \over {F_{\rm m}}}$$
The experiment consisted of five replications and was conducted three times.
H2O2 Accumulation
DAB (3, 3′-diaminobenzidine) staining was used to detect the presence of H2O2 over time in IN 23 (GS), IN 03 (RR), and IN 16 (NRR) after treatment with 0.42 and 1.68 kg ha−1 glyphosate. Each treatment contained NIS at 0.25% v/v. At 0, 0.5, 2, 4, 16, 36, 72, and 168 HAT, two 7.9-mm leaf disks were collected from the intercostal region of 10 replicate plants on the second node of 4-node plants and placed in 1.5-ml centrifuge tubes. Plants within each collection period were arranged in a completely randomized design. The DAB staining procedure followed Thordal-Christensen et al. (Reference Thordal-Christensen, Zhang, Wei and Collinge1997). Drops of HCl were added to water to attain pH 3.62 before creating a DAB solution of 1 mg ml−1 water-HCl; the low pH is required to dissolve DAB. Leaf disks were suspended in solution for 8 h by placing centrifuge tubes atop a laboratory gyrating shaker. Because DAB is light sensitive, the centrifuge tubes were covered with aluminum foil. Following incubation, leaf disks were placed in boiling ethanol (100%) for 15 min to destroy chlorophyll, as this enables visual confirmation of the brown precipitate that forms if H2O2 is present. Drops of 50% glycerol solution were applied to leaf disks to facilitate handling, as disks are brittle following chlorophyll removal. Digital photos were taken of each leaf disk and analyzed for percent area stained using APS Assess image analysis software (v. 2.0, American Phytopathological Society, St Paul, MN 55121). The experiment was performed twice.
Statistical Analyses
Data for experimental runs were combined when run by treatment interactions were absent (α=0.05). Percent dry weight reduction and survival data from the glyphosate dose–response experiment were fit to a four-parameter log-logistic model using PROC NLIN (SAS v. 9.3, SAS Institute, Cary, NC 27513) shown in Equation 2, where b is the slope of the curve around e, C is the lower limit, D is the upper limit, and e is the glyphosate dose necessary to reduce dry weight or survival by 50% (Seefeldt et al. Reference Seefeldt, Jensen and Fuerst1995).
 $$Y\,{\equals}\,C{\plus}{{D\,{\minus}\,C} \over {1{\plus}{\rm exp}\left[ {b\,\left( {\log \,x\,{\minus}\,\log \,e} \right)} \right]}}$$
Assessment data with subsamples for the chlorophyll fluorescence experiment were analyzed using PROC TTest; PROC UNIVARIATE was used to test for normality, and Levene’s test used to confirm homogeneity of variance. For the H2O2 accumulation experiment, percent area of leaf disk stained was fit to a two-parameter exponential rise to maximum model using PROC NLIN, shown in Equation 3, where Y o is the maximum percent area stained, k is the rate constant that determines the steepness of the curve, and t is time (Archontoulis and Miguez Reference Archontoulis and Miguez2015).
 $$Y\,{\equals}\,Y_{\rm o} \left[ {1\,{\minus}\,{\rm exp}\,\left( {{\minus}kt} \right)} \right]$$
Results and Discussion
Herbicide Resistance Screening
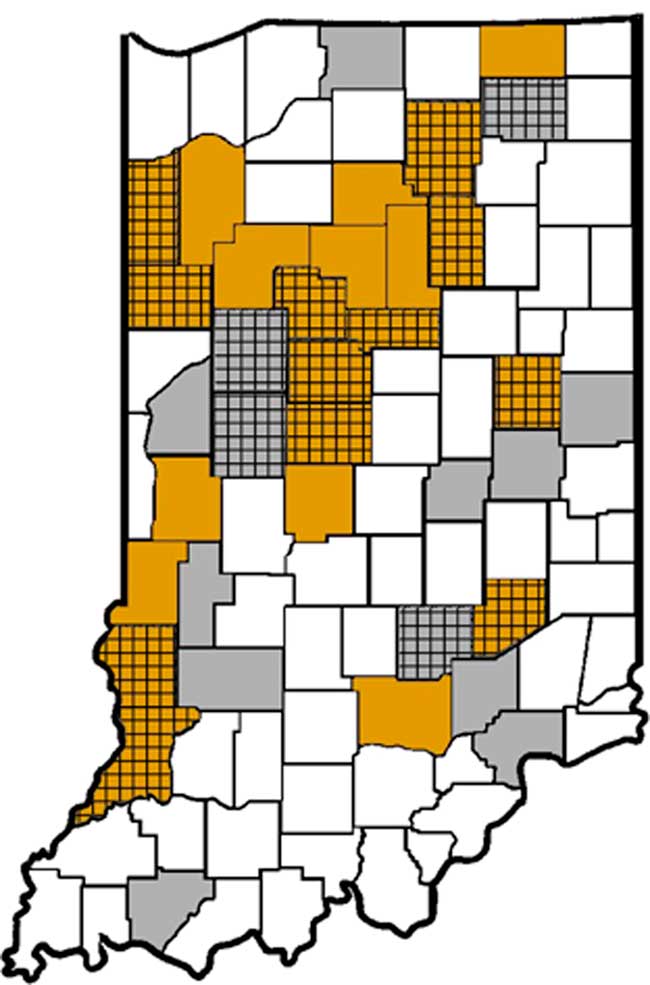
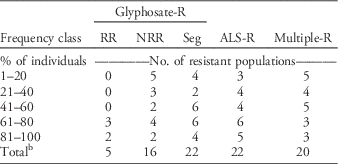
To assess the spread of GR giant ragweed in Indiana over time, results were compared with those collected from a 2006 survey performed by Westhoven et al. (Reference Westhoven, Davis, Gibson, Weller and Johnson2008). In 2006 at least one GR giant ragweed population was present in 15% of Indiana counties, while the current study confirmed presence in 39% of counties (Figure 1). Of 52 putative GR populations investigated, 43 were confirmed to be GR, with all but 8 of these being collected from soybean fields. Only 5 of the 43 GR populations uniformly displayed the RR phenotype when treated with glyphosate, but the frequency of GR individuals in these populations was not less than 60% (Table 1). Sixteen populations were identified in which GR individuals solely displayed the NRR phenotype, while 22 populations contained both RR and NRR individuals. Half of the NRR populations had a frequency of GR individuals therein of ≤40%. This suggests that although the NRR biotype is currently more widespread than the RR biotype in terms of population number in Indiana, the frequency of GR individuals in RR populations is greater.
Indiana counties with confirmed glyphosate-resistant (GR) giant ragweed, assessed through a whole-plant phenotypic screen. Light gray counties are those in which glyphosate resistance had been detected by a previous survey in 2006 by Westhoven et al. (Reference Westhoven, Davis, Gibson, Weller and Johnson2008). Gold counties are those newly identified to contain at least one GR population from a survey performed in fall 2014. Shaded counties containing a box pattern indicate the presence of rapid-response GR individuals.

Frequency of herbicide-resistant giant ragweed in a fall 2014 survey of problematic fields infested with giant ragweed in Indiana.Footnote a

a Abbreviations: glyphosate-R, glyphosate resistant; RR, rapid-response biotype; NRR, non–rapid response biotype; Seg, segregating between RR and NRR biotypes; ALS-R, ALS-inhibitor resistant; multiple-R, glyphosate and ALS-inhibitor resistant.
b Out of 52 populations collected.
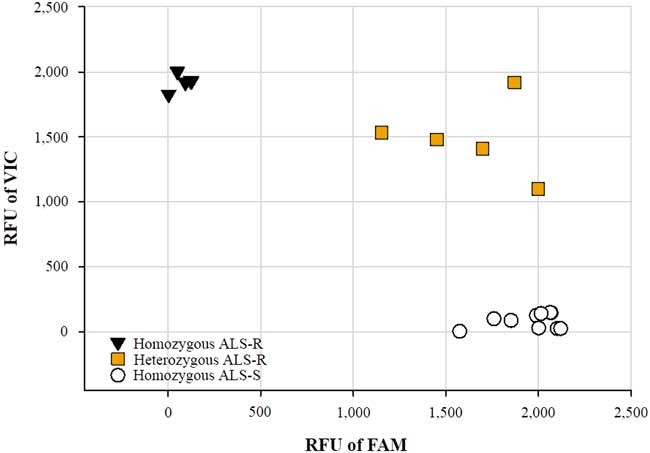
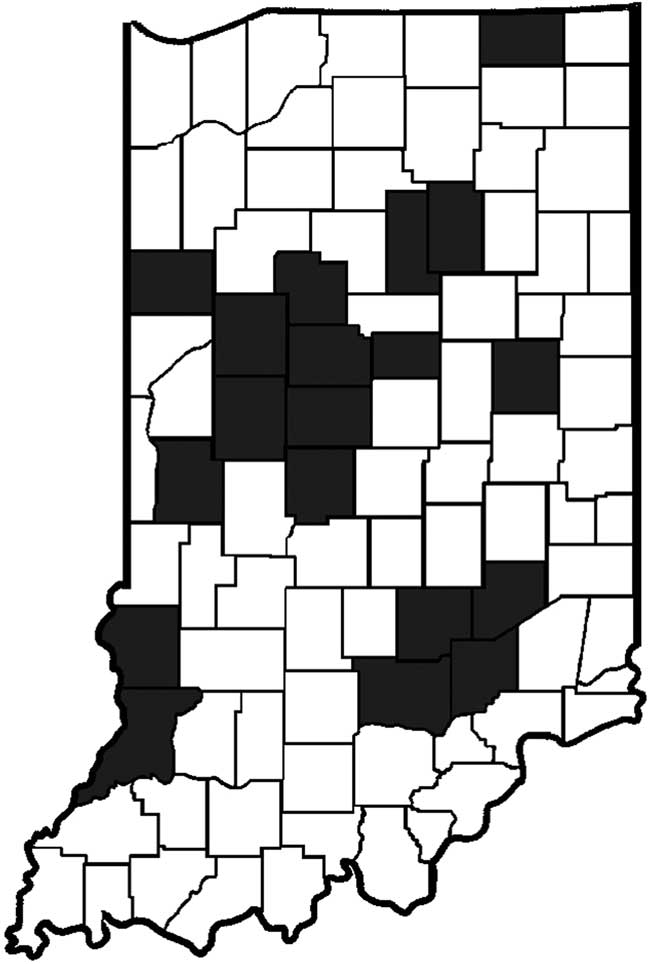
The TaqMan® SNP genotyping assay successfully discriminated known ALS-S from ALS-R individuals, thus validating the use of this assay for herbicide-resistance screening (Figure 2). Resistance to ALS inhibitors was not examined in the 2006 survey, but in the current study was found in 21% of Indiana counties (Figure 3). Of the 22 confirmed ALS-R populations, 11 contained a frequency of ALS-R individuals therein of greater than 60% (Table 1). Because seed collection from problematic fields was driven primarily by the prospect of glyphosate resistance, the distribution of ALS-R giant ragweed is likely even wider than what is reported here. The Trp-574-Leu mutation in ALS demonstrates cross-resistance to the sulfonylurea, imidazolinone, and triazolopyrimidine classes of ALS-inhibiting herbicides, thus severely impacting the number of effective herbicides for management of these biotypes (Tranel and Wright Reference Tranel and Wright2002). Of the 22 ALS-R populations, only two were not resistant to glyphosate (Table 1).
TaqMan® single-nucleotide polymorphism genotyping assay using 10 known acetolactate synthase inhibitor–resistant (ALS-R) and ALS-susceptible (ALS-S) giant ragweed plants. Relative fluorescence units (RFU) indicate excitation of VIC (ALS-R allele, Trp-574-Leu mutation) and/or FAM (ALS-S allele, wild type) fluorophores. Known ALS-R plants survived treatment with cloransulam at 54 g ai ha−1 in a whole-plant greenhouse screen.

Indiana counties with confirmed ALS inhibitor–resistant giant ragweed are highlighted. Seed was collected in fall 2014 as part of a survey of glyphosate-resistant giant ragweed and assessed using a newly designed single-nucleotide polymorphism genotyping method.

Glyphosate Dose Response
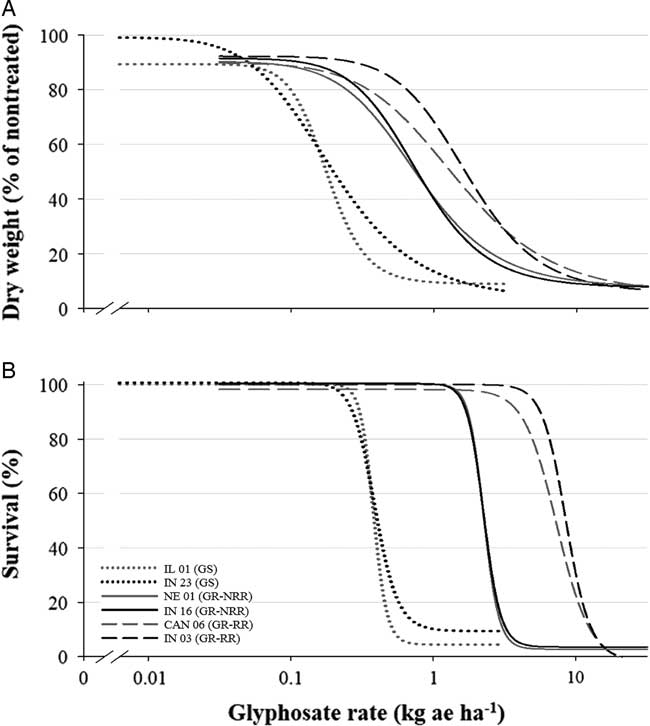
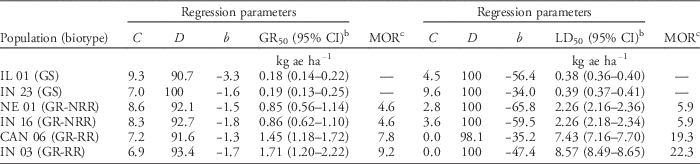
The RR was observed in CAN 06 and IN 03 within 4 h after glyphosate treatment for all doses except 0.08 and 0.33 kg, for which 10 h elapsed before similar symptoms were observed (unpublished data). The average GR50 and LD50 values between IL 01 and IN 23 were used to calculate the MOR values (Table 2; Figure 4). Based on GR50 values, the NRR populations NE 01 and IN 16 each had a MOR of 4.6, while CAN 06 and IN 03 had MOR values of 7.8 and 9.2, respectively. Furthermore, the dose of glyphosate required to be lethal to 50% of individuals (LD50) was 3.3 to 3.8 times greater in RR populations than in NRR populations. As 95% confidence intervals between NRR and RR populations did not overlap (Table 2), these results confirm the MOR in giant ragweed is contingent upon the phenotypic response to glyphosate.
Glyphosate dose response of glyphosate-susceptible and glyphosate-resistant giant ragweed populations 21 d after treatment on (A) shoot dry weight and (B) survival. Data were fit to a four-parameter log-logistic model (Equation 2); GR50 and LD50 values with associated 95% confidence intervals are listed in Table 2. Abbreviations: GS, glyphosate susceptible; GR-NRR, glyphosate-resistant non-rapid response; GR-RR, glyphosate-resistant rapid response.

Regression parameter estimates of glyphosate dose resulting in 50% reduction of shoot dry weight (GR50) or survival (LD50) in glyphosate-susceptible and glyphosate-resistant giant ragweed populations and the calculated magnitude of resistance (MOR) determined at 21 d after treatment and based on a four-parameter log logistic model (Equation 2).Footnote a

a Abbreviations: b, slope of the curve; C, lower limit; D, upper limit; GR-NRR, glyphosate-resistant non-rapid response; GR-RR, glyphosate-resistant rapid response; GS, glyphosate susceptible.
b The 95% confidence interval of the mean (n=12). Populations with confidence intervals that do not overlap were concluded to differ in their response to glyphosate.
c Magnitude of glyphosate resistance was calculated by dividing the GR50 or LD50 of the glyphosate-resistant population by the average of the GR50 or LD50 of the glyphosate-susceptible populations.
Reports on the MOR in giant ragweed have been variable. Both NRR and RR biotypes have been investigated by Green (Reference Green2014), who found the MOR values for a single NRR population and a single RR population were 19 and 16, respectively, based on LD50 values. Norsworthy and colleagues (Reference Norsworthy, Jha, Steckel and Scott2010, Reference Norsworthy, Riar, Jha and Scott2011) determined the MOR based on LD50 values in multiple NRR populations to range from 2.3 to 7.2. More recently, it was found that an NRR population from Mississippi had a MOR of 1.5 as determined by GR50 values (Nandula et al. Reference Nandula, Wright, Van Horn, Molin, Westra and Reddy2015). Across multiple accessions, the MOR for NRR accessions was 3.3 to 3.5, and for RR accessions it was 2.3 to 7.5, according to GR50 values (Van Horn et al. Reference Van Horn, Moretti, Robertson, Segobye, Weller, Young, Johnson, Schulz, Green, Jeffery, Lesperance, Tardif, Sikkema, Hall, McLean, Lawton, Sammons, Wang, Westra and Gaines2017). However, a caveat shared by all the previous studies is that plants were grown solely in commercial potting media and in the absence of nonsterilized field soil. As shown by Schafer et al. (Reference Schafer, Hallett and Johnson2012), these conditions favor false-positive GR results in giant ragweed and should be avoided. Thus, results reported here are the first in which multiple, geographically diverse populations of both NRR and RR biotypes were evaluated according to these guidelines.
Chlorophyll Fluorescence Imaging
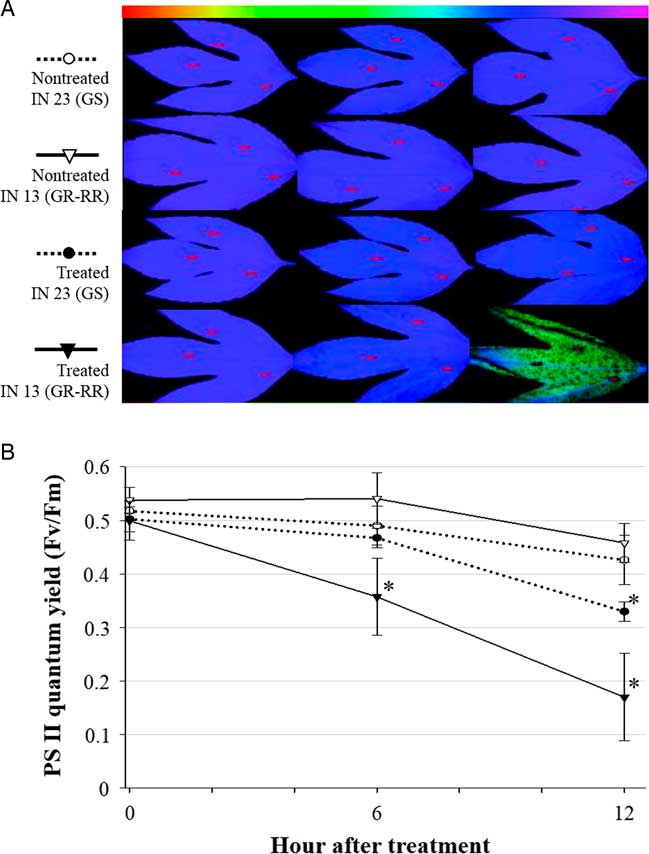
The use of the Imaging-PAM and ImagingWin software used in these experiments provided the ability to assess spatial heterogeneity across the entire leaf and analyze multiple leaf areas simultaneously (Figure 5a). Chlorophyll fluorescence measurements are among the most useful means to elucidate plant stress response. Maximum quantum yield of PS II (F v/F m), a parameter determined by these measurements, is an indicator of photosynthetic efficiency, as this represents the probability that absorbed light energy will be chemically fixed and used for photosynthesis (Maxwell and Johnson Reference Maxwell and Johnson2000).
Leaves of glyphosate-susceptible (GS) and glyphosate-resistant, rapid response (GR-RR) giant ragweed were excised at 0, 6, and 12 h after treatment with glyphosate at 0.7 kg ae ha−1. (A) Imaging-PAM fluorometer output. Three areas of interest, indicated by red rectangles, were determined in which fluorescence measurements were recorded and used for analysis of photosystem II (PS II) quantum yield (F v/F m). Values are represented according to the color scale shown at the top, with F v/F m increasing from left to right. (B) F v/F m values measured by an Imaging-PAM fluorometer. An asterisk (*) denotes a significant difference between treated and nontreated plants of the same population according to a Student’s t-test (α=0.05).

No differences in basal F v/F m were observed between IN 23 and IN 13 giant ragweed populations before glyphosate treatment (Figure 5b). Reduction in photosynthetic activity was much greater and occurred sooner in IN 13, as F v/F m was 36% lower in treated versus nontreated plants at 6 HAT. For IN 23, only a 4% reduction was detected at 6 HAT. Treated plants from IN 23 and IN 13 both showed a decrease in F v/F m relative to nontreated plants at 12 HAT; however, the magnitude of this decrease was much greater in IN 13. These results indicate chlorophyll fluorescence imaging via the Imaging-PAM platform to be a viable method to assess the response of giant ragweed to glyphosate and differentiate at an early stage between GS and RR plants. Additionally, as this platform can be modified to evaluate multiple plant samples simultaneously, it could be adapted for large-scale herbicide-resistant phenotyping screens (Murchie and Lawson Reference Murchie and Lawson2013).
H2O2 Accumulation
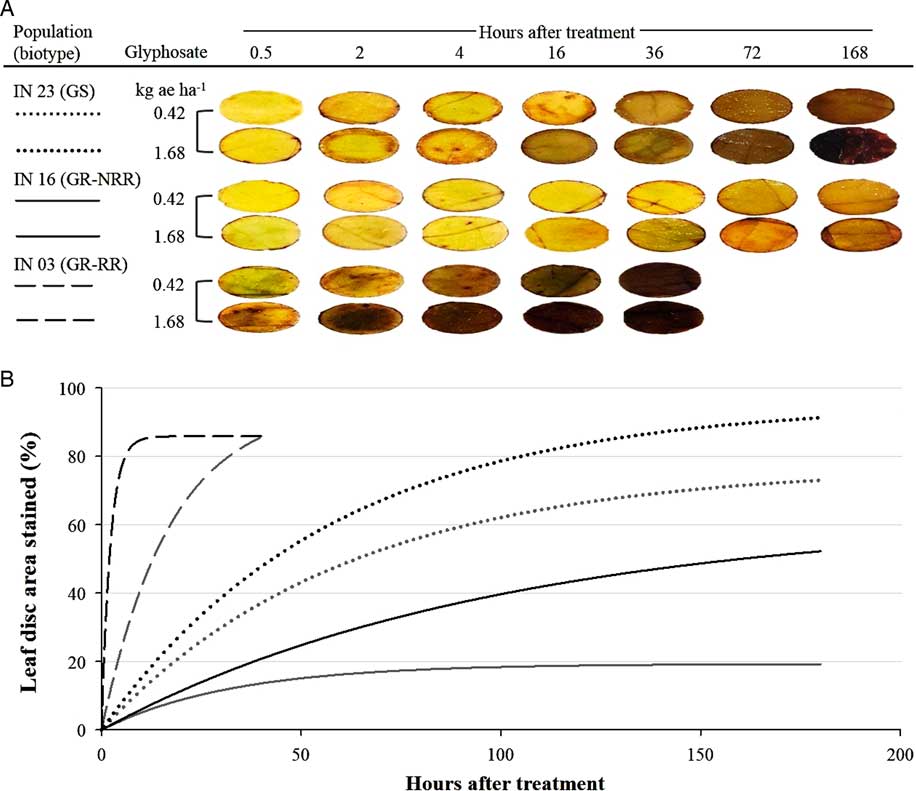
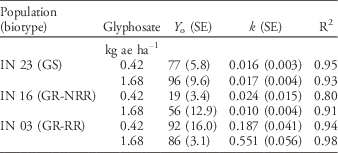
The presence of H2O2 in leaf disks, as indicated by the formation of a brown precipitate following DAB staining, was detected in as little as 0.5 HAT in IN 03 when treated with 1.68 kgha−1 glyphosate (Figure 6). For IN 03, generation of H2O2 increased more rapidly over time for the 1.68 kgha−1 glyphosate treatment (k=0.551) compared with the 0.42 kg ha−1 treatment (k=0.187) (Table 3). Beyond 36 HAT, leaves of IN 03 were fully necrotic for both glyphosate doses. Although the rate of H2O2 production was greater across both glyphosate doses in IN 03 compared with IN 23 and IN 16, this indicates the RR present in IN 03 is induced to a greater degree when a high dose of glyphosate is applied. While the rate of H2O2 accumulation for IN 23 and IN 16 was similar across both glyphosate doses, by 168 HAT, the maximum percent area stained remained lower for IN 16 compared with IN 23 (Table 3; Figure 6).
Leaf disks were collected over time from glyphosate-susceptible (GS), glyphosate-resistant non–rapid response (GR-NRR), and glyphosate-resistant rapid response (GR-RR) giant ragweed populations after being treated with glyphosate and stained with 3,3′-diaminobenzidine. (A) Representative samples of leaf disks after the staining procedure. Brown precipitate indicates presence of H2O2. Leaf disks were no longer attainable at 72 and 168 h after treatment in the GR-RR population due to complete leaf necrosis. (B) Leaf disks were analyzed for percent area stained using image analysis software, and data were fit to a two-parameter exponential model (Equation 3). Parameter estimates are listed in Table 3.

Regression parameter estimates (Equation 3) for percent area of leaf disks containing H2O2, determined via 3,3′-diaminobenzidine staining and quantified using APS Assess v. 2.0 image analysis software, collected from glyphosate-susceptible and glyphosate-resistant giant ragweed populations following treatment with glyphosate.Footnote a

a Abbreviations: k, rate constant that determines steepness of the curve; GR-NRR, glyphosate-resistant non-rapid response; GR-RR, glyphosate-resistant rapid response; GS, glyphosate susceptible; R2, coefficient of determination; Y o, maximum percent area of leaf disks stained.
This work has established the majority of GR giant ragweed populations infesting agronomic fields in Indiana consist of either the NRR biotype or a mixture of NRR and RR biotypes. However, under selection pressure put forth by continuous glyphosate use, it is plausible the RR biotype may become more widespread, as results reported here confirm individuals with this phenotypic response have a higher level of glyphosate resistance, even when originating from dissimilar geographic locations. Moreover, no fitness penalty associated to seed production was found for RR individuals (Brabham et al. Reference Brabham, Gerber and Johnson2011; Segobye Reference Segobye2013) and transfer of this form of glyphosate resistance is in part pollen mediated (Brabham et al. Reference Brabham, Gerber and Johnson2011). Taken together with the large differences observed in photo-oxidative stress response to glyphosate, these results are strongly suggestive of distinct GR mechanisms between NRR and RR biotypes. Indeed, investigations toward elucidating these mechanisms continue to be a prudent area of research (Moretti et al. Reference Moretti, Van Horn, Robertson, Segobye, Weller, Young, Johnson, Sammons, Wang, Ge, d’Avignon, Gaines, Westra, Green, Jeffery, Lesperance, Tardif, Sikkema, Hall, McLean, Lawton and Schulz2017; Van Horn et al. Reference Van Horn, Moretti, Robertson, Segobye, Weller, Young, Johnson, Schulz, Green, Jeffery, Lesperance, Tardif, Sikkema, Hall, McLean, Lawton, Sammons, Wang, Westra and Gaines2017).
Acknowledgments
The authors extend gratitude to Burkhard Schulz for his assistance with the Imaging-PAM operation.