



Nomenclature
- P
-
pressure (Pa)
-
 ${C_i}$
-
equation constant
-
$\mu$
-
relative density
- E
-
internal energy (J)
-
${\rho _0}$
-
initial density (kg/m3)
- A
-
intact normalised strength parameter
- c
-
strength parameter
-
$\Delta {\varepsilon ^p}$
-
plastic strain increment
-
${d_i}$
-
material constant
-
$\beta$
-
elastic energy loss
- B
-
fracture normalised strength parameter
- m
-
JH-2 material constant
- n
-
JH-2 material constant
-
$\sigma _i^*$
-
intact equivalent stresses (Pa)
-
$\sigma _f^*$
-
fracture equivalent stress (Pa)
- D
-
damage parameter
-
${\sigma _{HEL}}$
-
equivalent stress at the Hugoniot elastic limit (Pa)
-
${\dot \varepsilon ^*}$
-
normalised plastic strain rate
- T
-
maximum tensile pressure strength (Pa)
- P HEL
-
pressure component at Hugoniot elastic limit (Pa)
-
$\varepsilon _f^p$
-
plastic strain to fracture under constant pressure
-
${k_i}$
-
material constant
-
${\alpha _i}$
-
material constant in hyperelastic ogden model
-
${D_i}$
-
material constant in hyperelastic Ogden model
-
${\mu _i}$
-
material constant in hyperelastic Ogden model
-
${g_i}$
-
the spring constant in hyperelastic Ogden model
-
${\tau _i}$
-
relaxation time of the element


1.0 Introduction
The collision between birds and airplanes presents a critical challenge within the aviation industry, posing substantial threats to passenger safety and well-being. This issue primarily arises from the presence of birds within the aircraft’s flight trajectory, which complicates the possibility of diverting them away from the aircraft’s path. Any encounter with avian species can result in severe structural and operational damage to the aircraft and its integral components. To mitigate the risk of bird strikes, various measures have been adopted. These include implementing navigational directives to reduce bird-aircraft collisions, avoiding flight routes with elevated bird-strike risks, employing methods to disperse birds from flight paths and reinforcing aircraft windows with enhanced thickness and durability [Reference Zhou, Sun and Cai1].
Among the various components of an aircraft susceptible to bird strikes, the aircraft’s windshield holds particular significance. The term windshield pertains to the frontal window or the pilot’s viewing area of the aircraft. The windshield acts as a protective barrier between the pilot and potential bird impacts, and any compromise to its integrity poses risks to the pilot’s safety, consequently affecting the passengers as well. The formidable speed of bird collisions is a contributing factor to the extensive damage inflicted upon an aircraft when the windshield is struck [Reference Zhang and Lu2]. Furthermore, encounters with flocks of birds elevate the probability of not only bird strikes but also the potential for multiple consecutive strikes to the windshield, or other parts of the aircraft. This occurrence amplifies the likelihood of windshield damage. While windshields are typically engineered to endure a single impact, the scenario of consecutive strikes significantly heightens the potential for severe aircraft damage. A similar phenomenon can also arise during hailstorms. Though the impact force of hailstones is generally lower than that of birds, the cumulative effect of successive impacts, particularly at lower altitudes where hailstones attain greater acceleration, can introduce substantial risks. Thus, the imperative for research into windshields’ resistance against repeated collisions is evident, considering the critical role they play in maintaining aircraft safety and the need to mitigate the repercussions of such incidents. In certain instances, when an aircraft encounters a flock of birds, more than one bird may strike the windshield, causing damage. The nature of this collision can occur in two ways: simultaneous or repeated. This is contingent on the birds’ flight pattern, which may include V-shaped formations, J-shaped formations or a mass flight. In a mass movement, multiple birds can collide with the windshield simultaneously. While in a V-shaped or J-shaped flight pattern, it is possible for birds to hit the windshield successively [Reference Lissaman and Shollenberger3, Reference Jha, Sathyamoorthy and Prakash4].
On the other hand, considering the various flight patterns of birds, the possibility of one or more birds colliding with different parts of the windshield exists. These points can include the central area of the windshield or its peripheries. In other words, when a flock of birds encounters a windshield, the possibility of their collision with all parts of the windshield exists. Along the peripheries, during the installation of the windshield on the aircraft, damages such as crack formation may occur, increasing the vulnerability of these areas to bird strikes. But both the probability of sequential impacts on these points and the standard test does not specify them as the target. Therefore considering that the standard bird strike test designates the centre of the windshield as the target point, in this article, the central point of the windshield has also been chosen as the impact target point in accordance with the standard.
One of the major challenges in bird impact numerical simulation is accurately defining a bird model. Various techniques, such as Lagrangian, Euler, Arbitrary Lagrangian-Euler (ALE) and smooth particle hydrodynamics (SPH) methods, can be employed for this purpose, each with its own advantages and disadvantages. The SPH method stands out as a highly effective approach for simulating bird impacts. Given that most birds have a body structure similar to fluids, the SPH method adeptly captures the motion of particles in such substances. In this study, the SPH method is used to construct a bird model. Unlike methods with a lattice, SPH is a Lagrangian method that utilises separate yet efficient particles in place of a solid finite element lattice. This makes it particularly suitable for modeling scenarios involving large and complex deformations. Moreover, due to its modified Lagrangian nature, it can be easily integrated into commonly used coding software [Reference Hedayati5].
In 2011, Heimbs conducted an extensive review of computational methods employed in simulating bird strikes. The review encompassed diverse computational approaches, such as finite element analysis, SPH, and other numerical techniques, evaluating their efficacy in modeling bird-aircraft interactions. Additionally, the review delved into progress made in material modeling, impact metrics and validation methodologies for bird impact simulations. This thorough analysis of computational methods offers valuable insights for researchers and practitioners in the realms of safety and aeronautical engineering [Reference Heimbs6].
In recent years, researchers have undertaken experiments and computer simulations to develop strategies for mitigating the risk of bird collisions with aircraft windshields. Numerous articles have explored the subject of bird interactions with glass surfaces, the various types of glass, and strategies for diminishing bird-glass collisions. For instance, in 2016, Liu et al. conducted a study on a car windshield incorporating a layer of polyvinyl butyral (PVB), examining its energy absorption mechanism in response to bird impact. The research encompassed both experimental and simulated modeling of bird collisions, investigating energy absorption processes within a velocity range of 6.6–11.2m/s. The authors outlined the energy absorption process by the windshield after impact, delineating it into the following three stages:
1. Outer Layer Fracture: At this initial stage, the impact energy has not yet reached the middle layer.
2. Significant Deformation in the Middle Layer: At this stage, the middle layer absorbs impact energy through crack propagation and extensive deformation.
3. Material Elastic Return: In this phase, owing to the viscoelastic nature of PVB, a portion of the material’s deformation is elastically reversed.
These three stages are anticipated to occur in the event of a bird collision with an airplane windshield, too. Due to their viscoelastic characteristics, polymer interlayers undergo substantial elastic deformations upon impact. Even in cases where the interlayer does not tear, these reversible deformations can exert pressure on the inner glass layer, potentially leading to its breakage and entry into the pilot’s cockpit [Reference Liu, Xu, Xu, Wang, Sun and Li7].
In 2018, Projoth and Renish analysed bird impacts on aircraft windshields, specifically focusing on the effect of increased windshield thickness on bird strikes. Due to the high cost of experimental testing, NASRAN simulation was employed. The simulation investigated Von Mises stress, force, time and displacement as outputs, and after comparing the results to the experimental data, the accuracy of the simulation was confirmed [Reference Niruban Projoth, Rohith Renish, Sivarathinabala and Vinulakshmi8]. In the present research, some of the parameters utilised in Ref. [Reference Niruban Projoth, Rohith Renish, Sivarathinabala and Vinulakshmi8], such as fracture stress and displacement of elements, are employed to validate the simulation and practical test results.
In 2018, Liu et al. designed a robust aircraft structure to withstand bird impact by focusing on three goals: enhancing the energy absorption capacity of the structure during the impact, increasing the damping capability of the structure and designing a multi-layer structure. Both experimental and simulation results were utilised in their research, with simulations conducted using the SPH method. Different materials, such as aluminum alloys, honeycomb composites, and foam materials, were used in the simulations, and specific properties were determined for each material [Reference Liu, Li, Yu, Gao and Liu9]. Although this study was focused on the design of aircraft structures, the method employed in this research to determine the optimal order and thickness of layers can be utilised to design a secure windshield with a layered structure comprised of glass layers and polymer interlayers.
In 2018, Sanan et al. conducted a study on the influence of incorporating metal layers on the energy absorption characteristics of aircraft structures featuring glass and aluminum layers [Reference Khan, Sharma, Kitey and Parameswaran10]. The structure was constructed using glass fiber reinforcement combined with aluminum, and subjected to low-speed impacts. The researchers analysed four distinct configurations, each incorporating a metal layer of varying thickness and placement while maintaining a consistent final thickness for the structure. Upon comparing the simulation outcomes with experimental results, the accuracy of the material behaviour in the simulation was confirmed. Subsequently, the study examined the material behaviour during impact and failure, as well as the structural response. The findings indicated that the pattern of delamination (disintegration) in the structure varied with the alteration of metal placement within the structure. Greater incorporation of metal in the structure led to reduced fracture resistance but an increase in impact energy absorption and a reduction in material layering. Additionally, thicker metal layers resulted in lower fracture resistance, and the time of failure was also influenced by the distribution of metal within the material.
In 2018, Firdaus et al. employed the SPH method to simulate bird impact on a flat plate, both rigid and deformable [Reference Firdaus, Prayoga and Jusuf11]. They characterised the geometric shape of the bird into three conventional forms (flat cylinder with two flat ends, cylindrical cylinder with two ends and oval), along with a compound shape resembling a bird more closely. Notably, the study incorporated multiple materials to represent the bird, with its mechanical behaviour characterised as hydrodynamic. The findings revealed that the utilisation of multiple material models demonstrated better alignment with experimental results compared to the traditional standard models.
Mohaghegian et al. (2018) studied the soft impact of an aerofoil traveling at speeds between 100 to 180m/s. In their research, finite element and SPH methods were employed to simulate bird impact, while in experimental testing, gelatin and silicone rubber were utilised as stand-ins for birds. The windshield was composed of four layers, consisting of glass – PU – PU – glass. The research revealed that two factors impacted bird impact results: the order and the thickness of glass layers. Both glass layers would break if the thicker glass layer was placed in front (as the outer layer). However, if the thinner layer was placed in front with the same impact speed, only the outer layer would break, while the inner, thicker layer remained undamaged [Reference Mohaghegian, Wang, Zhou, Yu, Guo, Yan, Charalambides and Dear12].
In 2014, Hedayati and Ziaei-Rad examined critical bird directions in bird impacts on the tail of an aircraft [Reference Hedayati and Ziaei-Rad13]. In 2019, in another study, Dar et al. investigated the impact direction of a bird on the windshield and the cockpit structure of an aircraft, obtaining similar results. The researchers employed hydrodynamic behaviour to model the properties of the bird and compared the effects of the bird’s geometric shape with previous standard shapes. The modeling was carried out using the SPH method, and the impact was simulated first on a rigid plate and then on the windshield. Pressure points on the target were compared to equivalent pressure points in experimental testing, and the results’ accuracy was confirmed. According to both A Dar and Hedayati’s reports, the worst type of bird impact is from the bird’s belly area. In other words, an impact from the belly area requires a lower speed than impacts from other directions to break the glass [Reference Dar and Zhang14]. In the present research, the model used in Ref. [Reference Dar and Zhang14] will be employed to describe the mechanical behaviour of the bird in FEM simulation.
In 2020, Cwiklak examined the results of numerical analyses of different bird model collisions with the windshield of a helicopter. Three different numerical bird models were described. According to the literature, the use of a suitable equation of state affects the impact parameters. The SPH method is used to simulate the impact of the bird. In the research, three different state equations of Groningen, polynomial and tabulated were used and the results showed that the polynomial model describes the behaviour of the bird well in the bird collision [Reference Cwiklak15], which is similar to the result of Ref. [Reference Dar and Zhang14].
Cwiklak, et al. in 2022, investigated the experimental and numerical models of birds when they collide with rigid and deformable targets. In this research, simulations were developed in LS-DYNA using the SPH method for the shape of a cylindrical bird model with a hemispherical end at a speed of 116m/s. The results of studies on parameters like impact force, pressure and deformation of the bird model were compared. In addition, the results of the authors and other researchers were evaluated. They concluded that the impact force curves obtained as a result of numerical analysis have a good correlation with the experimental curves, and the resulting force values obtained during the numerical studies reflect the experimental values well, regardless of the parameters of the bird’s equation of state (EOS) equation [Reference Ćwiklak, Kobiałka and Goś16]. Based on this, it can be concluded that parameter changes in the descriptive equation of states of the bird model will not have much effect on the response of the impacted windshield.
In 2023, Kholoosi and Alavi Nia experimentally and numerically evaluated the impact of a bird on the windshield of an aircraft. The windshield was made of glass with SentryGlas (SG) and polyurethane (PU) interlayers. The thickness of the windshield, the impact speed of the bird and the impact angle were 33.1mm, 155m/s and 45 degrees, respectively. The results showed that for the windshield with SG-PU hybrid interlayer, despite the better resistance compared to the windshield with pure SG body, the back glass layer was broken and separated in the impact area. Based on the simulation results, the panel with the pure PU interlayer resulted in the best windshield performance. In addition, panel centre deflection was lower when using thinner glass layers on the impact side. The effect of the impact angle was also simulated, which introduced the normal impact angle as the most critical state [Reference Kholoosi and Alavi Nia17]. Considering that SG and PU are used in the present article to form new windshield layers, the obtained results can be compared with the results of Ref. [Reference Kholoosi and Alavi Nia17].
In a study, Rezaei et al. [Reference Kholoosi and Alavi Nia17] investigated the simultaneous impact of three birds on an aircraft’s windshield. Their research demonstrated that simultaneous bird strikes caused severe tearing among the interlayers, leading these tearing to connect and expand. Hence, the current windshields lack the ability to withstand simultaneous impacts. By altering the thickness of the windshield layers, they succeeded in proposing a new design that offers higher resistance against simultaneous bird strikes. However, the material composition of the layers was not addressed in this study, and the new layers maintained the same material as the original ones [Reference Rezaei, Arezoo and Ziaei-Rad18].
In this study, following an assessment of the existing windshield structure, an endeavor is undertaken to introduce a novel windshield configuration featuring distinct materials, layer arrangement and thickness. The objective is to enhance the new windshield’s ability to withstand bird collisions effectively as well as predict the number of impacts the windshield can withstand. The windshield examined in this manuscript is from a P3F ORION aircraft, which is generally used for maritime patrol.
2.0 Material model & methods
2.1 Bird model
In many articles related to the topic of bird collision with aircraft, bird modeling is used to analyse the impact of the collision. This modeling is usually done using mathematical models and computer simulations. The most common method in bird modeling is to use impact force to simulate the collision of the bird with the aircraft. In other articles, bird biology modeling may be used. In this method, the physical characteristics of the bird such as the concentration and mass of the body, body temperature and contact surface with the aircraft are considered and according to the characteristics of the bird and the aircraft, the effects of the collision on the aircraft are calculated. However, standard models such as the spherical double-headed cylinder model have also been used in many articles related to the collision of a bird to model it [Reference Zhu, Wang, Tong and Pan19–Reference Zhou, Sun and Huang21]. Although substitute bird impactors have been used for many years in bird strike tests and simulations by a variety of organisations there is no standardised artificial bird shape [Reference Heimbs22].
In this research, the bird’s substance is modeled as uniform with homogeneous density and behaviour similar to water, and an elastic-plastic hydrodynamic material model along with a polynomial EOS is used. A pressure-dependent plasticity model is utilised to construct the bird model. This equation can be expressed as follows:
 \begin{align}P = {C_0} + {C_1}\mu + {C_2}{\mu ^2} + {C_3}{\mu ^3} + \left( {{C_4} + {C_5}\mu + {C_6}{\mu ^2}} \right)E\end{align}
where
 $P$
is the pressure in the matter,
 $E$
is the internal energy,
 ${C_i}$
is the equation constant and
 $\mu $
is the relative density. Relative density is the ratio of instantaneous density to initial density minus one, which is defined by the following equation:
 \begin{align}\mu = \left( {\frac{\rho }{{{\rho _0}}}} \right) - 1\end{align}
The constants of the equation and other parameters are obtained from Ref. [Reference Dar and Zhang14]. It is important to highlight that
 ${C_0}$
represents the initial equilibrium pressure, and its value is zero. The constants
 ${C_4}$
,
 ${C_{5,}}$
and
 ${C_6}$
are likewise presumed to be zero to reflect water-like behaviour. These specific constants are detailed in Table 1.
Bird material parameters and EOS coefficients [Reference Dar and Zhang14]

In the experimental bird impact test, the bird is placed in a bag and put inside the firing tube. Since the bag containing the bird is almost cylindrical with a curved end, the best geometric shape to describe it is the spherical double-headed cylinder model. In this model, the length of the cylinder is twice the radius of the hemisphere at each end, as shown in Fig. 1. The values for L and R are 150 and 75mm, respectively, according to the experimental bird projectile. In this research, instead of using the classic finite element mesh, the SPH technique is used to model the bird. SPH is one of the numerical simulation methods, in which the body is simulated in the form of small particles and each of these particles, using a density distribution function such as the kernel function, interacts with its neighbor particles. The kernel function in this method is used to transfer properties (such as density and pressure) between particles and determines how much each particle interacts with its neighboring particles. The SPH method is superior to other methods such as the ALE method due to its numerical stability, constant time step, and no mesh distortion [Reference Chen, van de Waerdt and Castro23].
Standards spherical double-headed cylinder model of a bird in bird impact simulations.

2.2 Windshield model
The windshield examined in this research consists of five layers, including three layers of glass and two layers of polyurethane. The properties of these two materials are obtained as follows:
Polyurethane
To ascertain the mechanical properties of polyurethane (PU), two tests involving axial tension and the SHPB technique are conducted to evaluate stress-strain behaviour at elevated strain rates. Figure 2 shows the specimen of an axial tensile, while Fig. 3 displays the SHPB device employed in the experimentation. The SHPB test is executed using the Hopkinson pressure device fabricated by Hamadan Boali University of Technology. The test sample holds a diameter of 25mm. ASTM D638 [24] standard procedures are followed for the preparation of the PU sample in both test cases. The SHPB device provides output in terms of voltage over time. To derive strain rates for various voltage levels (a process typically accomplished by conducting a series of tests with distinct pressures applied to the sample), Hooke’s law and formulas for converting time to strain are employed. (For more information, refer to Ref. [Reference Khosravani and Weinberg25]. The stress-strain curve, resulting from both the tensile and SHPB tests performed under varying strain rates, is depicted in Fig. 4. In Fig. 4, for each strain rate, a minimum of five tests are performed and the accurate results are averaged and reported. Following the testing, the requisite mechanical parameters of the PU material are determined based on the outcomes.
Polyurethane specimen for tensile test.

Hopkinson’s pressure test device.

PU stress-strain diagram in different strain rates.

In order to characterise the mechanical response of PU, the chosen constitutive equation must possess two essential attributes: the ability to anticipate substantial non-linear deformations and the capacity to incorporate strain rate dependency. Consequently, the hyper-viscoelastic-plastic behavioural model is adopted for this material. Notably, the Ogden model exhibited a superior alignment with outcomes derived from practical testing, prompting its selection for describing the hyperelastic behaviour of PU. Furthermore, the viscoelastic aspect of the model is represented by Kelvin’s general model, grounded in the Prony series. For a detailed understanding of the interrelations and equations pertinent to each of these models, Refs. [Reference Ferry26, Reference Tschoegl27] can be consulted. The parameters are established based on the failure strain to elucidate the failure characteristics of the PU material. The essential parameters of the Prony series to describe viscoelastic properties of PU in finite element software are reported in Table 2.
Glass
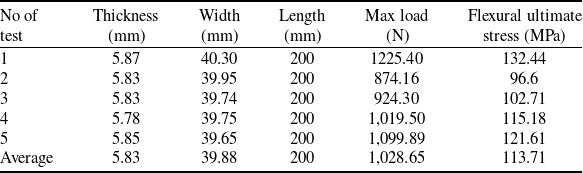
The type of glass used in this study is the soda-lime glass (manufactured by Gazvin Glass Factory). To acquire the mechanical properties of glass, uniaxial tension, SHPB, three-point bending and pressure difference tests are employed. The configuration of the three-point bending test apparatus is depicted in Fig. 5. The three-point bending test is performed according to the ASTM-C158-02 [28]. In the three-point bending test, the SANTAM-400 machine is used. This device consists of two parts, including the support fixtures and the force application fixtures. The distance between the jaws of both fixtures is also adjusted according to the standard (ASTM-C158-02)[28]. The specifications of the glass samples used in this test are shown in Table 3. This test is employed to extract the stress-strain behaviour of glass at low strain rates.
The three-point bending test device.

In the pressure difference test, five sheets of glass are prepared and at each test, strain gauges are affixed to the glass specimens in accordance with the standard protocol. During this test, pressure is incrementally increased, and at each pressure stabilisation point, the corresponding strain and the maximum load (pressure multiplied by the cross-sectional area of each glass specimen) are recorded. The flexural ultimate stress is obtained from the applied force at the failure point. The pressure testing apparatus is illustrated in Fig. 6. In this way, the mechanical properties of glass are extracted and used in finite element software. The stress-extension diagram obtained from multiple glass samples in a three-point bending test is displayed in Fig. 7. The voltage-time graph resulting from the glass Hopkinson test is presented in Fig. 8. The observed pulse shapes in both the incident and transmitted bars align with typical outcomes in Hopkinson tests. Furthermore, the time interval between the two graphs (two pulses) illustrates the temporal relationship between these bars, affirming the validity of the experimental test.
The pressure test device.

The stress-extension diagram of glass samples in three-point-bending test.

Output pulses of incident and transmitted bars in glass Hopkinson test.

In order to characterise the behaviour of glass, an elastic-plastic-based damage model known as Johnson-Holmquist-2 is employed. This model is well-suited to simulate the behaviour of brittle materials subjected to high strains, high strain rates, and large pressures [Reference Johnson and Holmquist29]. The model comprises three primary components to describe the strength, damage and pressure-volume behaviour of the material. The material’s strength can be represented as follows:
 \begin{align}{\sigma ^*} = \sigma _i^* - D\left( {\sigma _i^* - \sigma _f^*} \right)\end{align}
where
 $\sigma _i^{\rm{*}}$
and
 $\sigma _f^{\rm{*}}$
are the normalised intact and fracture equivalent stresses, respectively, and D is the damage parameter (0 ≤ D ≤ 1). All equivalent stresses are in the general form
 ${\sigma ^{\rm{*}}} = \sigma /{\sigma _{HEL}}$
, where σ represents the actual equivalent stress, and
 ${\sigma _{HEL}}$
is the equivalent stress at the Hugoniot elastic limit (HEL). The normalised intact and fracture stresses can be expressed as:
 \begin{align}\sigma _i^* = A{\left( {{p^*} + {t^*}} \right)^n}\left( {1 + c\ln {{\dot \varepsilon }^*}} \right)\end{align}
 \begin{align}\sigma _f^* = B{\left( {{p^*}} \right)^m}\left( {1 + c\ln {{\dot \varepsilon }^*}} \right)\end{align}
Parameters and its value of PU hyper viscoelastic model

The superscript ‘*’, denotes a normalised quantity. The stresses are normalised by the equivalent stress at HEL, the pressures are normalised by the pressure at HEL, and the strain rate is normalised by the reference strain rate (
 ${\dot \varepsilon _0}$
) defined in the input. In these equations, A and B represent the intact and fracture normalised strength parameters, respectively, c represents the strength parameter for strain rate dependence,
 ${\dot \varepsilon ^*}\;$
represents the normalised plastic strain rate, and,
 \begin{align}{t^*} = \frac{T}{{{P_{HEL}}}}\end{align}
 \begin{align}{p^*} = \frac{p}{{{P_{HEL}}}}\end{align}
where T is the maximum tensile pressure strength,
 ${P_{HEL}}$
is the pressure component at the HEL and p is the pressure [Reference Pashmforoush and Esmaeilzare30]. The damage parameter is defined as:
The glass sample parameters used in the three-point bending test
 \begin{align}D = \sum \frac{{\Delta {\varepsilon ^p}}}{{\varepsilon _f^p}}\end{align}
where
 $\Delta {\varepsilon ^p}$
is the plastic strain increment and
 $\varepsilon _f^p$
is the plastic strain to fracture under constant pressure as given by Equation (8):
 \begin{align}\varepsilon _f^p = {d_1}{\left( {{p^*} + {t^*}} \right)^{{d_2}}}\end{align}
where
 ${d_1}$
and
 ${d_2}$
are material constants. Element deletion is also considered in the JH-2 model based on the total plastic strain such that an element is removed when the plastic strain exceeds the specified failure strain (FS). Using the equation of state, the hydrostatic pressure can be defined as:
 \begin{align}P = {k_1}\mu + {k_2}{\mu ^2} + {k_3}{\mu ^3}\end{align}
where
 ${k_1}$
,
 ${k_2}$
, and
 ${k_3}$
are material constants, μ is the density increase (
 $\mu = \frac{\rho }{{{\rho _0}}} - 1$
),
 ${\rho _0}$
is the initial density, and
 $\rho $
is the current density. When damage starts to occur, there is an increase in pressure. A fraction, between 0 and 1, of the elastic energy loss,
 $\beta$
, is converted into hydrostatic potential energy (pressure). The details of this pressure increase are given in the Ref. [Reference Grujicic, Bell, Pandurangan, Cheeseman, Fountzoulas, Patel, Templeton and Bishnoi31].
The coefficients derived from the above equations, essential for implementing the JH-2 model along with other necessary parameters for simulating JH-2 behaviour, are outlined in Table 4. Given the unavailability of the JH-2 behavioural model in FE software, a subroutine is developed and employed.
Glass parameters of JH-2 model used for FEM simulation

*β (0 ≤ β ≤ 1) is the fraction of the elastic energy loss converted to potential energy.
In the ongoing phases of this research, additional polymer materials such as PVB and SG are introduced as interlayers, while polycarbonate (PC) and polymethyl methacrylate (PMMA) serve as the main layers, acting as substitutes for the glass layers. In order to derive the mechanical properties of these materials, SHPB and uniaxial tensile tests are conducted. Each of the tests conducted in this research has been repeated at least three times to ensure its accuracy. Also, in all SHPB tests, (both for glass and for polymers), a cylindrical sample with a diameter of 12mm and a length of 25mm is used. The stress-strain diagram obtained for each of the aforementioned materials is presented in Fig. 9. For characterising the mechanical response of PVB and SG, the consistent hyper-viscoelastic-plastic model is applied. While, the mechanical behaviour of PC and PMMA is represented through a strain rate-dependent elasto-plastic material model, as detailed in Ref. [Reference Siviour and Jordan32]. Some PC data for a high strain rate can be found in Ref. [Reference Ganzenmüller, Langhof and Hiermaier33]. Figure 10 depicts the strain diagram over time (with removing the noises) in the incident and transmitted bars during the Hopkinson test of PC material. This diagram reveals the sequential occurrence of generated strains, including the influence of the return strain within the returning wave. These findings align with the diagrams documented in several scientific articles, including references [Reference Song, Chen, Antoun and Frew34, Reference Bagaria35].
The true stress-true strain diagrams of (a) PMMA, (b) PC, (c) PVB and (d) SG.

The strain-time diagram of incident and transmitted bars in PC Hopkinson test.

3.0 Experiments
The actual bird impact test is conducted using a bird test apparatus equipped with a 12-meter-long tube gun. This device propels the projectile by generating abrupt pressure at the rear of the bird. To establish reliability, three distinct tests are carried out. For each trial, a freshly deceased chicken weighing 1.8kg is employed as the bird specimen. Adhering to the guidelines set by the Federal Aviation Administration (FAA) standards (FAR/JAR/CS/25.775), the impact velocity is set at 144m/s to simulate the effect on the target windshield [Reference Dar and Zhang14]. The bird is positioned within a shell case with its head facing outward, and this assembly is subsequently inserted into the gun tube. Upon firing, air pressure is generated behind the shell case, propelling it along with the enclosed bird at a predetermined speed. The shell case comes to a halt upon reaching the end of the tube, owing to a built-in barrier. However, the bird continues its forward trajectory and collides with the target at the designated speed. Due to the constrained movement of the bird within the shell case and the short distance between the tube head and the target, the bird remains in a fixed posture after exiting the tube. Consequently, the bird collides with the windshield in the same orientation as within the shell case. The configuration of the impact gun and the shell case is illustrated in Fig. 11, while Fig. 12 shows speedometer sensors that calculate the bird’s velocity in kilometers per hour. Figure 13 presents the windshield before the bird impact, featuring 15 strain gauges installed to measure inner glass layer strain. The secured windshield frame is affixed to the structure using clamps instead of screws. The arrangement of the windshield during the bird impact test and the accompanying equipment is depicted schematically in Fig. 14. Post-impact, the outer glass layer shatters completely. However, the presence of the PU interlayer prevents the dispersion of glass fragments and the fracture of additional glass layers. Strain data from the inner layer is captured by sensors, facilitating validation of simulation outcomes. Ultimately, Fig. 15 displays the collided windshield after the impact test. The execution of three practical bird impact tests is undertaken to ensure result accuracy.
(a): Bird impact gun, (b): Shell case.

The speedometer sensors which measured the speed of bird in bird impact experiment.

Intact windshield before test.

Schematic location of windshield and other equipment in bird impact test.

Windshield after bird impact test.

4.0 Numerical simulation and results
The windshield is modeled according to its actual dimensions and geometry. Comprising five layers, the windshield is structured as follows: outer glass layer, first PU interlayer, middle glass layer, second PU interlayer and inner glass layer. In the simulation, the ‘tie’ constraint is employed between the glass and PU layers, considering that the PU serves as both an interlayer and adhesive between the glass layers. PU layers create a stable shear bond between the glass layers during impact [Reference Liao, Yao, Zhang, Hossain, Wang and Zang36]. Since the windshield is placed inside the test device frame and then securely fastened with screws, it is no longer capable of moving within the frame. The frame material is also made of high-strength steel, which is much stiffer compared to the windshield. Therefore, this frame can be considered a relatively solid body. In the simulation, the boundary regions of the windshield are considered to be fixed, equivalent to its placement in the solid frame. The boundary conditions are modeled as a clamp (replacing screws), and the bird collision is simulated for 5ms. It’s noteworthy that the element size for each constituent of the windshield is determined through iterative simulations, selecting dimensions that yield convergent outcomes. The results of the mesh study are depicted in Fig. 16. For each component of the windshield, the element size is as follows: glass elements: 4mm, PU elements: 4mm. All components are modeled as solid parts and meshed by 8-node linear brick, reduced integration and hourglass control elements. Furthermore, at least three elements are utilised in the thickness direction of each component of the windshield to account for bending effects. The number of particles used in the bird geometry is 16,329, and the distance between the centre of each particle and the adjacent ones is 1.8mm. The simulation conditions dictate the removal of each glass element once its strain surpasses the breaking strain threshold. Figure 17 displays the damage results of the impact simulation, allowing for a direct comparison with the experimental observations illustrated in Fig. 15. According to Fig. 15, upon bird impact at the centre of the windshield, the outer glass layer shatters completely. Although the presence of the PU interlayer prevents the glass particles from dispersing, the outer layer fractures entirely. Since the bird impacts precisely at the centre of the windshield and the shockwave propagates radially, the density of cracks in this area is too high, and as they move away from the centre towards the periphery, the density of cracks decreases radially. The same observation can be made in Fig. 16. After the impact, there is a significant level of damage and crack growth at the centre of the outer glass layer, and as it moves from the centre towards the periphery, the density of cracks decreases, even reaching undamaged areas below the frame. This phenomenon also occurs in the middle and inner layers of the glass, where cracks have a higher density at the centre and decrease radially. However, the presence of the PU interlayers reduces the extent of fracture and crack growth in these layers compared to the outer glass layer.
Mesh study results in simulation.

Damage results of bird impact simulation.

The simulation results are compared to the results obtained from strain gauges in the practical test, which recorded the strain in the elements of the inner glass layer. Strain gauges stored the strain-time diagram of corresponding elements in the simulation and three experiments as shown in Fig. 18. In this figure, the graph of experiment 3 exhibits a time difference compared to experiments 1 and 2, as well as the simulation. The onset of recorded strain in experiment 3 occurs approximately 0.5–0.6ms later than the previous two experiments. However, the pattern of movement in the graph is similar to the other two. It appears that this difference may be due to a time delay between the process of experiment 3 and the others, which could have various reasons. For instance, there might be a delay in signal transmission by the strain gauge. However, since the behavioural pattern of all four graphs is the same, with a peak followed by a strain drop, the mentioned difference can be attributed to the time delay in signal transmission. Certainly, in the graph of experiment 3, a negative value can also be observed, which is most likely due to an error in the strain gauge. However, this error does not affect the overall pattern of the graph.
Strain-time diagram of three experiments and simulation.

In Fig. 19, the displacement of the centre strain gauge (number 8) in three experiments is compared with the corresponding element displacement in the simulation. The average error between the simulation and experimental test results of displacement values in all 15 strain gauges is less than 10%, which is an acceptable agreement between the two methods. Consequently, this model can be effectively employed to investigate the repercussions of repeated impacts on the same location of the windshield.
Comparing corresponding displacement results in experimental and simulation, at the centre point of the windshield.

5.0 Repeated bird impact simulation on current windshield
After confirming the congruence between simulation and experimental bird impact results, the process of two repeated bird impacts at the windshield’s centre point is subsequently modeled. In practical scenarios, flocks of birds often maintain consistent speeds. In cases where an aircraft encounters a flock of birds, the speed at which the birds impact the windshield approximates the relative speed between the bird and the aircraft. Consequently, the impact speeds for consecutive birds are assumed equal during the simulation process. The impact point for both birds is set at the windshield’s centre, in accordance with established bird impact testing standards. The geometries of the windshield and the birds, the element sizes, material parameters and other boundary conditions remain identical to those employed in the single bird impact simulation. The sole distinction is the inclusion of two identical birds instead of one, positioned successively for impact. The second bird is situated behind the first, and both collide with the windshield while moving at a constant speed, mirroring the standard impact test velocity. The dynamic simulation unfolds in two steps. In the initial step, bird No. 1 (B1) makes contact with the windshield. Subsequently, in the second step, bird No. 2 (B2), having reached the location initially occupied by B1, advances towards the windshield and collides with it while B1 is still impacting. This dynamic interaction means that the impacts of the two birds could influence each other. The spacing between the two birds and the timing of the steps are determined such that each bird’s impact sequence spans 5ms.
The simulation results unequivocally indicate that the current windshield configuration lacks the resistance to withstand the impact of two birds. Consequently, during the second bird’s collision, the windshield is breached, leading to B2 partially penetrating the cockpit. This outcome results from the combined effects of glass layer breakage and the tearing of the PU interlayer upon the second bird’s impact. In light of the repeated double impact simulation’s findings, it is evident that the existing windshield design cannot endure the impact caused by two consecutive bird collisions, thereby posing a risk to the pilot’s safety. Figure 20(a) illustrates the arrangement of the two birds relative to the windshield, while the outcomes of the repeated impact simulation are presented in Fig. 20(b).
(a) The arrangement of the two birds and windshield. (b) The results of the repeated bird impact simulation.

6.0 New design of windshield
The new windshield design encompasses two fundamental aspects aimed at enhancing resistance against frequent collisions. Firstly, there is a reevaluation of the arrangement of the windshield’s layers and the material used in each one. Secondly, the thickness of each layer is strategically determined. Two fundamental principles underscore the design of this novel windshield:
Incorporation of an interlayer between every adjacent pair of main layers to function as an adhesive.
Maintenance of the overall thickness of the windshield without alteration.
a) Establishing the New Layer Composition
In the existing windshield configuration, the layer sequence follows a glass-PU-glass-PU-glass arrangement. As such, the first, third and fifth layers are designated as main layers, while the second and fourth layers are referred to as interlayers. Drawing from the materials available in the aviation industry and the prevalent windshield types, the main layers can consist of glass, PMMA and PC, whereas the interlayers can be composed of PVB, SG and PU. For the sake of analysis, the assumption is made that the layer thickness remains constant. Thus, each layer of the windshield can be represented by three potential types. Given that there are five three-level factors in this arrangement, the total number of potential configurations amounts to
 ${3^5}$
, or 243 configurations. To address the considerable number of test cases, the Taguchi test design methodology is employed to reduce the number of tests to 27, utilising the
 ${L_{27}}$
array.
Consequently, 27 simulations are executed following Taguchi’s test design approach. Within each simulation, the first bird collision takes 5ms. Subsequently, if the second interlayer remains unscathed and prevents bird penetration, a subsequent bird collision occurs at the standard speed. This process unfolds until a breach transpires in the second interlayer. Should this interlayer rupture, the simulation sequence terminates, yielding the number of collisions and the maximum strain within the inner layer as output parameters. Figure 21 graphically illustrates the progression of these simulations. To identify the layer combination exhibiting the greatest resistance to frequent bird impacts, Taguchi’s optimisation criterion, ‘the smaller, the better,’ is employed. In essence, among the simulations involving the most frequent bird collisions, the optimal solution is the one in which the maximum strain value within the inner layer is minimised.
Schematic steps of repeated bird impact simulations.

b) Determine the thickness of each layer
The thickness of each layer is established upon the completion of the preceding step and the selection of the optimal layer combination. To ascertain the thickness of each layer, specific conditions are delineated in accordance with the established standard. These conditions are detailed below:
The total thickness of the existing windshield is 30mm. Since the new windshield needs to be installed within the frame of the current aircraft, the total thickness of the new windshield must also be maintained at 30mm.
Following the EN572 standard, the glass layer must adhere to standard thicknesses. Consequently, the glass layer can only have thicknesses of 3, 4, 5, 6, 8, 10, 12, 15, 19 and 20mm. Any thickness exceeding 20mm cannot be considered for this windshield as it would necessitate the removal of a layer or interlayer.
In order to ensure adequate strength in the interlayer, it must possess a minimum thickness of 2mm and a maximum thickness of 10mm. Additionally, the interlayer thickness should be an integer.
The outer glass layer is equipped with a thermal heater that warms the windshield’s exterior surface during extremely low temperatures (around -50 degrees Celsius). Hence, the thickness of the outer glass layer should not exceed 7mm. Otherwise, the heat will not dissipate from the thermal element, resulting in the glass freezing at -50 degrees Celsius, becoming brittle and prone to breakage. Conversely, the outer glass layer is subjected to thermal shocks and necessitates a minimum thickness. Consequently, the thickness of the outer glass layer cannot be less than 4mm. Thus, the thickness of the outer glass layer can only fall within the range of 4–6mm.
In the current windshield, the middle glass layer bears the aircraft’s loads, particularly the pressure differential between the interior and exterior. Therefore, the structural layer, known as the middle layer, must have a minimum thickness of 10mm to effectively withstand these external forces.
The inner glass layer is also equipped with a thermal element. Therefore, similar to the outer layer, the thickness of this layer must range between 4 and 6mm to ensure proper heat conduction.
According to the above conditions, three levels of thickness are considered for each main layer as follows:
Outer and inner layers thickness: 4, 5, and 6mm
Middle layer thickness: 10, 15, and 20mm
Hence, there exist three factors, each with three levels, resulting in a total of 27 configurations for the main layers. However, owing to the initial stipulation of maintaining a consistent overall thickness (30mm), and the interdependency between interlayer and main layer thicknesses, each of these 27 configurations encompasses multiple variations. For example, when the outer, middle and inner layers possess thicknesses of 5, 15 and 4mm, respectively, the cumulative thickness of these layers amounts to 24mm. With the total windshield thickness set at 30mm, the collective thickness of the two interlayers would be 6mm. Subsequently, guided by the third condition, the interlayer thicknesses can take on any of the following combinations: (2mm, 4mm), (3mm, 3mm) or (4mm, 2mm). This results in a total of 78 feasible configurations. To curtail the need for an exhaustive number of simulations, the Taguchi method can be employed. Considering the 27 configurations for the main layers involving three factors with three levels each (27 configurations), the number of main configurations can be condensed to L9 using the
 ${L_9}$
orthogonal array. By incorporating the potential interlayer thickness values, the overall simulation count is reduced to 27 cases. These 27 scenarios are outlined in Table 5.
Considered states for the thickness of each layer

Analogous to the preceding step, the criteria to prevent bird penetration into the cockpit involve inspecting the second interlayer for any tear in each simulation. If no tear transpires and, consequently, bird penetration is averted, the subsequent collision is initiated. This sequence persists until a tear occurs in the second interlayer. In the ultimate phase of each simulation, the output encompasses the count of collisions and the highest strain experienced by the inner layer. By adhering to the Taguchi optimisation principle of the smaller, the better, the optimal thickness configuration is ascertained.
It is evident that in an ideal scenario, the simulations pertaining to steps 1 and 2, encompassing the arrangement of layers with new materials and the determination of layer thicknesses, should be integrated to explore the reciprocal impacts of layer thickness and material composition. Nevertheless, in this instance, the potential configurations become exceptionally extensive (243 × 78 = 18,954), rendering the comprehensive resolution of all scenarios practically unfeasible. Furthermore, due to the varying factor levels and their interdependencies, the practical application of experimental design methodologies such as Taguchi is implausible. Consequently, the interplay between the material of each layer and its thickness is not taken into account, and the aforementioned two steps are investigated independently.
7.0 Results and discussion
Out of the 27 simulations executed during the initial stage, only three simulations exhibit distinct combinations in which the windshield demonstrates adequate resistance to repeated impacts from three birds. Among these scenarios, only one instance, characterised by the lowest value of maximum strain within the inner layer, is identified as the optimal solution. The maximal strain values and the layer sequencing for these three distinct simulations are presented in Table 6. Concurrently, the windshield formulated using the glass-PU-PC-PU-PMMA combination showcases the least strain magnitude within the inner layer, thus being chosen as the optimal result for the first stage. This novel composition is subsequently employed in the simulations conducted during the second stage.
The new arrangement of layers in the resistant windshield against three consequent bird strikes

During the simulations in the second stage, there are four instances where the novel windshield effectively withstands the consecutive collision of three birds, with no occurrence of tearing in the second interlayer. These four successful cases are detailed in Table 7. Following the optimisation criterion of the smaller, the better inherent to the Taguchi method, only one of these cases is identified as the optimal solution for the second stage. As a result, a new windshield design emerged, showcasing distinct material compositions and layer thicknesses for each component, as depicted in Fig. 22. The Von Mises stress results arising from the sequential impact of three birds on this redesigned windshield are also illustrated in Fig. 23, offering three different perspectives. The noteworthy point is that by normalising the weights, the weight of the new recommended windshield is reduced. In the combination depicted in Fig. 20, the weight will be 41% less than that of the current windshield, due to the replacement of the middle and inner layers with a polymer instead of glass, coupled with the higher density of glass compared to polymers. The schematic diagram of consecutive bird impacts in simulations is illustrated in Fig. 24.
The new thicknesses of layers in the resistant windshield against three consequent bird strikes

The new windshield with new arrangement and thicknesses of layers schematically.

The Von Mises stress results in new designed windshield against three consequent bird impacts: (a) front view, (b) side view and (c) rear view.

Number of consecutive bird impacts along time, schematically: each diagram corresponds to the time of impact for one bird.

8.0 Conclusions
This research endeavors to enhance the resistance of a flat windshield against frequent bird collisions. To achieve this objective, initially, the mechanical properties of the windshield materials are determined through tests such as simple tension, SHPB testing and three-point bending, conducted in accordance with relevant standards. Subsequently, these material properties are incorporated into finite element software to model their mechanical behaviour. These insights are then employed to simulate bird-windshield collisions under real conditions. Furthermore, practical tests involving three instances of bird impacts on the windshield are executed. These tests yield valuable data concerning strain and displacement outcomes for each impact test. Through a meticulous comparison of these empirical results with the simulation outputs from bird collision scenarios, a notable correspondence is evident. This alignment indicates that the strain and displacement values derived from simulations closely match those observed in practical tests. Consequently, the simulation methodology is validated as a means to assess the consequences of successive bird collisions on the windshield’s integrity.
The windshield under investigation consists of a layered arrangement: glass-PU-glass-PU-glass. Conforming to the standards set forth by the FAA, the failure of the glass layers in isolation is insufficient to trigger failure in the windshield during the bird crash test. In scenarios where the glass layers sustain damage, as long as the PU interlayers (even if they undergo plastic deformation) remain intact, the cockpit remains safeguarded from bird penetration. Thus, the windshield successfully meets the criteria of the bird impact test. However, the simulation outcomes derived from subjecting the present windshield to repeated bird collisions reveal its susceptibility to such incidents. Specifically, the impact inflicted by the second bird results in tears within both PU interlayers and the failure of all glass layers. Consequently, the birds successfully penetrate the cockpit area.
In order to increase the resistance of the windshield against repeated collisions, both the material and thickness of each layer are considered as two design parameters. The new windshield is designed in such a way that the least amount of strain occurs in the inner layer with the largest number of consequent birds hitting it, in addition to not tearing the second interlayer (as a barrier against the penetration of the bird inside). For this purpose, glass, PC and PMMA are considered as main layers, and PU, PVB and SG as interlayers. To explore the full spectrum of potential solutions, a comprehensive set of 243 tests is conceivable. However, employing Taguchi’s test design methodology permits the reduction of this set to 27 tests. Similarly, in the determination of new thickness configurations, using Taguchi’s method causes the potential 78 configurations to be reduced to 27 configurations. By executing simulations for each configuration and extracting the maximum strain values obtained within the inner layer, the Taguchi optimisation approach is leveraged. Under the principle of the smaller, the better, an optimal solution is pinpointed for each configuration, where the maximum strain within the inner layer is minimised among all the values. A comprehensive analysis of the simulations conclusively highlights a novel windshield design, characterised by specific combinations and thicknesses of layers, as the top performer against the challenge of repeated collisions involving up to three birds. The material and thickness of each layer of the new windshield is as follows:
-
– Outer layer: glass with a thickness of 4mm
-
– First interlayer: PU with a thickness of 2mm
-
– Middle layer: PC with a thickness of 15mm
-
– Second interlayer: PU with a thickness of 4mm
-
– Inner layer: PMMA with a thickness of 5mm
In the proposed windshield design, the weight will be 41% less than that of the current windshield. This reduction is attributed to the replacement of the middle and inner layers with polymer materials instead of glass, as polymers generally have lower density compared to glass.
These results can be applied in the formulation of novel windshield designs intended to withstand bird impacts and repeated collisions. Furthermore, the methodology employed in this study holds potential for designing windshields that exhibit ample durability against other potential hazards, such as hailstones or consecutive impacts from bullets.
Supplementary material
To view supplementary material for this article, please visit https://doi.org/10.1017/aer.2024.33
Availability of data and material
The data that support the findings of this study are available from the corresponding author, Behrouz Arezoo, upon reasonable request.
Acknowledgements
We would like to express our sincere gratitude to all the individuals and organisations who have contributed to the publication of this research paper. We are grateful to the mechanical engineering department at Amir Kabir University of Technology for supporting us needed to complete this project, and we would like to thank all the participants in this study for their time and willingness to share their experiences. Their contributions have been invaluable in helping us to understand the topic and draw meaningful conclusions.
Author contributions
All authors contributed to the concept and design of the study, preparation, collection and analysis of data. All authors read and approved the final manuscript.
Funding
No funding was received from any source to conduct the research for this article.
Competing interests
The authors declare that they have no known competing financial interests or personal relationships that could have appeared to influence the work reported in this paper.
Consent for publication
All authors express their consent to publish the text, items, and details of this article in the Aeronautical Journal.



