INTRODUCTION
Research conducted to determine the nutritional requirements of broiler breeder pullets has been limited. One of the main reasons is because controlled feeding is used and therefore the pullets do not grow at the maximum rate (NRC 1994). Continued genetic improvement for rapid broiler growth, feed efficiency and meat yield has generally implied a need for constant adaptation of the management and feeding regimen of broiler parent stock (broiler breeders) to avoid potential negative effects on reproductive performance of overweight birds (Romero-Sanchez et al. Reference Romero-Sanchez, Plumstead and Brake2007). In general, overweight broiler breeders show poor egg production, fertility and hatchability, an increased likelihood of producing eggs with shell defects or multiple yolks, and more than one egg laid per day (Wilson et al. Reference Wilson, Robinson, Robinson and Hardin1995). Therefore, adequate knowledge and prediction of nutrient requirements have implications for economic benefit. Among the nutritional factors determining an animal's growth rate, dietary energy (DE) and crude protein (CP) content are the most important. Experiments designed to investigate strategies to optimize the productivity of broiler breeders are relatively long term and expensive to conduct. As the cost of research increases, mathematical models become valuable tools to answer research and development questions. Although growth curves have been shown to be useful tools for analysing the growth response to genetic selection and environmental change, the disadvantage is that they consider the animal as a system with output only. Animal production systems are input–output systems; therefore, empirical growth curves give no information on the mechanisms involved in animal growth.
Jull & Titus (Reference Jull and Titus1928) and Titus (Reference Titus1928) applied the law of diminishing returns to describe the relationship between live weight (LW) and feed consumption in growing chickens and ducklings. Parks (Reference Parks1982) also showed that a diminishing returns function of the monomolecular type can be used to describe change in size with age. Blaxter & Wainman (1961) proposed the monomolecular equation for describing the relationship between energy retention and feed intake, based on a detailed analysis of over 80 calorimetric experiments with sheep and cattle. This presupposes that the response of energy retention rate to increments in (the rate of) feed intake obeys the law of diminishing returns over all levels of intake. The monomolecular equation forms an integral part of the metabolizable energy (ME) system currently used in feeding dairy cows in the UK (Agnew et al. Reference Agnew, Yan, France, Kebreab, Thomas and Thomas2004). There are many studies with poultry suggesting that a limiting nutrient is utilized with constant efficiency over the range of intakes from maintenance to that required for maximal growth or egg production (e.g. Hurwitz et al. Reference Hurwitz, Sklan and Bartov1978, Reference Hurwitz, Frisch, Bar, Eisner, Bengal and Pines1983; Sakomura et al. 2003; Baker et al. Reference Baker, Fernandez, Parsons, Edwards, Emmert and Webel1996; Edwards et al. Reference Edwards, Baker, Fernandez and Parsons1997, Reference Edwards, Fernandez and Baker1999; Edwards & Baker Reference Edwards and Baker1999; Sakomura Reference Sakomura2004). In contrast, Vazquez & Pesti (Reference Vazquez and Pesti1997), Baker et al. (Reference Baker, Batal, Parr, Augspurger and Parsons2002), Fatufe et al. (Reference Fatufe, Timmler and Rodehutscord2004), Fatufe & Rodehutscord (Reference Fatufe and Rodehutscord2005) and Romero et al. (Reference Romero, Zuidhof, Renema, Robinson and Naeima2009) demonstrated that the utilization of a nutrient declined as intake approached optimum. Specially re-parameterized models (France et al. Reference France, Dhanoa, Cammell, Gill, Beever and Thornley1989) that partition nutrient intakes into requirements for maintenance and growth have been demonstrated to be useful in ruminants, pigs, chickens and turkeys (Darmani Kuhi et al. Reference Darmani Kuhi, Kebreab, Owen and France2001, Reference Darmani Kuhi, Kebreab, Lopez and France2003, Reference Darmani Kuhi, Kebreab, Lopez and France2004, Reference Darmani Kuhi, Porter, Kebreab, Lopez and France2007, Reference Darmani Kuhi, Kebreab, Lopez and France2009; Kebreab et al. Reference Kebreab, France, Agnew, Yan, Dhanoa, Dijkstra, Beever and Reynolds2003, Reference Kebreab, Schulin-Zeuthen, Lopez, Soler, Dias, De Lange and France2007, Reference Kebreab, France, Darmani Kuhi and Lopez2008; Schulin-Zeuthen et al. Reference Schulin-Zeuthen, Kebreab, Dijkstra, Lopez, Bannink, Darmani Kuhi and France2008). These models were considered advantageous because they could predict the dietary nutrient requirements for maintenance and growth on a daily basis for the entire growth period. The objective of the current study was to compare the most suitable of these models (monomolecular and rectangular hyperbola) and estimate CP and ME requirements for maintenance and growth in male and female broiler breeder pullets.
MATERIALS AND METHODS
Data source
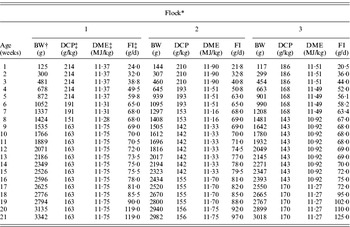
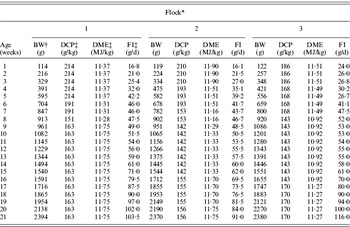
A total of six time course profiles for growing male and female breeder pullets (Ross 308 between 1 and 21 weeks of age, n=63 for each sex) obtained from a local farm were used in this analysis. A detailed description of data used in the current study is summarized in Tables 1 and 2.
Data profiles of male broiler breeders used with the study

* Feed was provided for unrestricted daily consumption during the first 4 weeks of age and then a 6–1 and 5–2 feed allocation programme was used from 6 to 10 and from 10 to 21 weeks of age, respectively. During the rearing period, the house temperature (initial house temperature was 29°C, house temperature reduced in line with 3 d interval to achieve a final house temperature of 21°C at 24 d of age and kept constant afterwards), ventilation and day length and light intensity were managed based on the guideline of Ross stock company.
† The weekly body weight records are based on a random sample (0·05) taken from the flocks.
‡ DCP, dietary crude protein; DME, dietary metabolizable energy; FI, feed intake.
Data profiles of female broiler breeders used in the study

* Feed was provided for unrestricted daily consumption during the first 4 weeks of age and then a 6–1 and 5–2 feed allocation programme was used from 6 to 10 and from 10 to 21 weeks of age, respectively. During the rearing period, the house temperature (initial house temperature was 29°C, house temperature reduced in line with 3 d interval to achieve a final house temperature of 21°C at 24 d of age and kept constant afterwards), ventilation and day length and light intensity were managed based on the guideline of Ross stock company.
† The weekly body weight records are based on a random sample (0·05) taken from the flocks.
‡ DCP, dietary crude protein; DME, dietary metabolizable energy; FI, feed intake.
The models
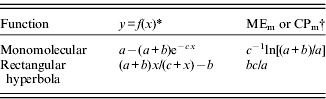
Monomolecular and rectangular hyperbola functions with diminishing returns behaviour (Table 3) were used to investigate the relationship between scaled body weight gain (BW gain, g/g LW/d) and ME (kJ/kg LW/d), and CP (g/kg LW/d) intake in male and female broiler breeder pullets. Simple scaling by LW was used in the current study because expression of maintenance as a function of body weight to the power of 0·75 has been subjected to criticism, especially for fast-growing animals like broilers. The use of metabolic body weight (BW0·75) is well established in nutrition, to the extent that reliance upon it might be regarded as excessive (Wiseman Reference Wiseman1994). Indeed, calculation of the relationship between energy losses and LW frequently does not yield the value 0·75 (Graham & Searle Reference Graham and Searle1972; Kielanowski Reference Kielanowski and Cole1972; Williams & Jenkins Reference Williams and Jenkins2003). BW gain, ME and CP intake were calculated for each data profile as follows:
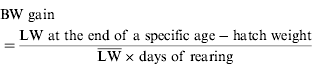
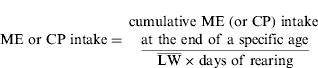
where  is average LW. Average LW for different ages was calculated as the mean of weights at hatch (with a mean value of 40 g) and means at the end of each week. The equations were fitted separately to the data and the parameters estimated. From these parameter estimates, ME and CP requirements for maintenance [MEm (kJ/g LW/d) and CPm (g/g LW/d), where LWG=0] and average efficiency of ME (
 , g of BW gain/kJ of ME intake) and CP (
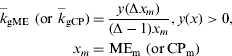
 , g of BW gain/g of CP intake) utilization for gain were calculated. The instantaneous efficiency of ME and CP utilization for gain, k gME (g of BW gain/kJ ME intake) and k gCP (g of BW gain/g CP intake), is given by

and the average efficiency between maintenance and Δ times maintenance (Δ>1) by
The functional forms used to describe the relationship between live-weight gain, f(x), and ME or CP intake, x
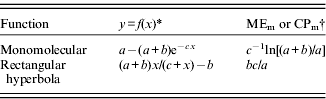
* The parameters a, b and c are positive entities, with y max=a and y min=−b.
† MEm and CPm, respectively, are ME and CP intake at maintenance.
Statistical procedures
The data were pooled and the non-linear mixed model procedure of SAS (PROC NLMIXED; Littell et al. Reference Littell, Milliken, Stroup and Wolfinger1996; SAS 2000) was used to estimate the parameters for the two functions. Mixed model analysis was chosen because the data were gathered from various breeder broiler flocks reared under different management conditions; therefore it was necessary to consider analysing not only fixed effects of the dependent variable but also random effects. Flocks were coded as a random effect because they represent a random sample of a larger population. Distribution of random effects was assumed to be normal and the dual quasi-Newton technique was used for optimization with adaptive Gaussian quadrature as the integration method. Goodness of fit of models was determined using mean square error (MSE), coefficients of determination (R 2) and Bayesian information criterion (BIC).

BIC is a measure that combines fit and complexity. Fit is measured negatively as –2×ln(likelihood); the larger the value, the worse the fit. Complexity is measured positively as ln(N)×k.
RESULTS
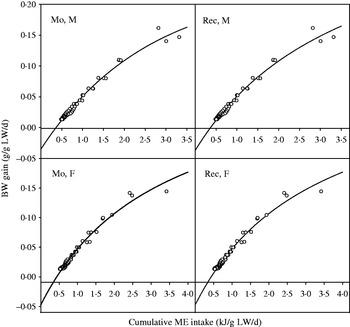
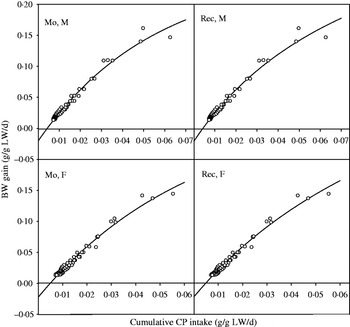
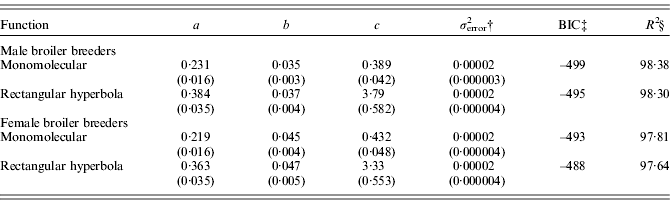
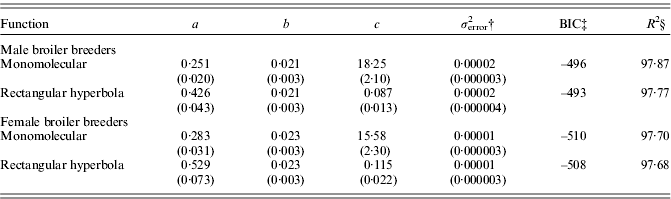
The results of fitting monomolecular and rectangular hyperbola models to the data (Figs 1 and 2) show that they are capable of describing the relationship between ME (or CP) intake and BW gain in broiler breeder pullets with a high degree of accuracy (Tables 4 and 5). The low standard error values of the growth parameters indicate narrow confidence intervals, which is a measure of the overall fit of the model and it is further evidence of the close agreement that can be obtained between observed and predicted BW gain in response to ME and CP intake using these models.
Plots of ME intake (kJ/g BW/d) against BW gain (g/g BW/d), showing fits of monomolecular (Mo.) and rectangular hyperbola (Rec.) equations to data from male (M) and female (F) broiler breeder pullets.

Plots of CP intake (g/g BW/d) against BW gain (g/g BW/d), showing fits of monomolecular (Mo.) and rectangular hyperbola (Rec.) equations to data from male (M) and female (F) broiler breeder pullets.

Parameter estimates obtained using the different models to regress body weight gain (g/g of LW/d) against ME intake (kJ of MEI/g of LW/d). Standard errors are given in brackets*
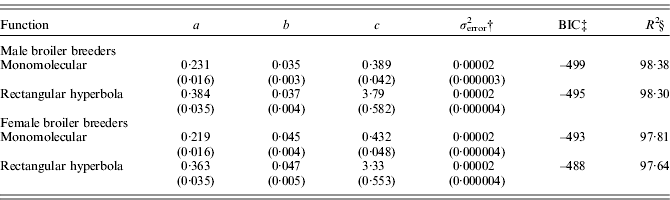
* Number of observations=63.
† Variance of error estimate.
‡ BIC: Bayesian information criteria.
§ Adjusted.
Parameter estimates obtained using the different models to regress body weight gain (g/g of LW/d) against CP intake (g of CPI/g of LW/d). Standard errors are given in brackets*
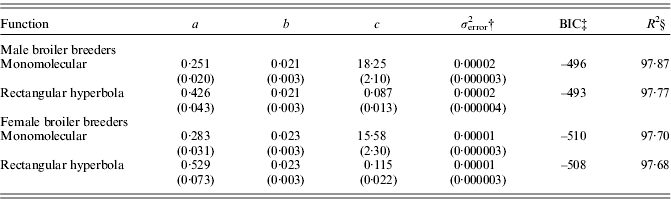
* Number of observations=63.
† Variance of error estimate.
‡ BIC: Bayesian information criteria.
§ Adjusted.
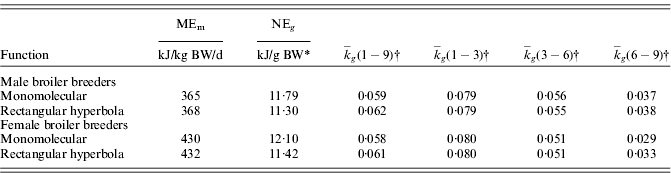
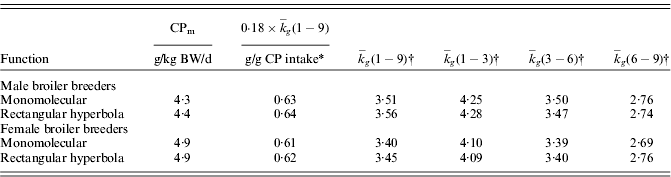
Biological indicators calculated from the parameter estimates for the models are shown in Tables 6 and 7. The points of intersection of the different curves with the x-axis represent the maintenance requirements for ME and CP. For each sex, the values determined for ME and CP intake at maintenance (MEm and CPm) varied slightly between two models (Tables 6 and 7). However, the variations for the determined values of MEm and CPm were higher between sexes. The range was 365–432 kJ/kg LW/d for MEm and 4·3–4·9 g/kg LW/d for CPm, with a higher determined value of MEm and CPm for female broiler breeder pullets. The value of average net energy and protein utilization for producing gain in BW varied from 11·42 to 12·10 kJ/g BW for energy and from 0·61 to 0·64 g/g for protein, depending on the model and sex (Tables 6 and 7). The utilization of ME and CP for gain is more efficient at low levels of energy and protein intake, and gradually decreases as the level of energy and protein intake is increased.
Growth traits calculated from parameter estimates obtained using the different models to regress body weight gain (g/g of LW/d) against ME intake (kJ of MEI/g of LW/d)
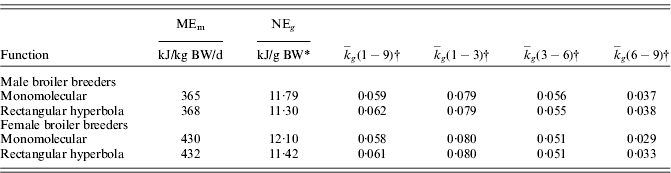
* The average net energy requirement for growth between 1 and 9 times maintenance calculated as  based on the assumption that the average efficiency of utilization of ME for growth is c. 0·70 for balanced diets in poultry (McDonald et al. Reference McDonald, Edwards, Greenhalgh and Morgan2002).
† The average efficiency of utilization of ME for growth (g BW gain/kJ) between 1–9, 1–3, 3–6 and 6–9 times maintenance.
Growth traits calculated from parameter estimates obtained using the different models to regress body weight gain (g/g of BW/d) against CP intake (g of CPI/g of BW/d)
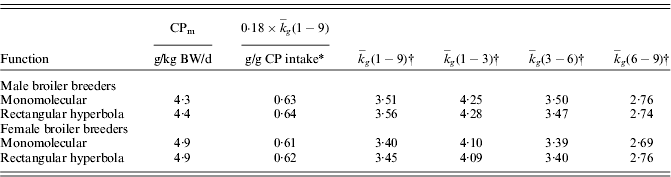
* The average net protein utilization for growth between 1 and 9 times maintenance expressed as a coefficient calculated based on the assumption that the carcass of chicken contains c. 180 g CP/kg.
† The average efficiency of utilization of CP for growth (g BW gain/g CP intake) between 1–9, 1–3, 3–6 and 6–9 times maintenance.
A comparison of the models based on R 2 values shows little difference between them in their ability to describe the relationship between BW and ME (or CP) intake. However, based on BIC values, the monomolecular was superior to the rectangular hyperbola because fitting it to the data led to a smaller numerical value of BIC and therefore a better fit (Tables 4 and 5).
DISCUSSION
The potential and validity of specially re-parameterized models (France et al. Reference France, Dhanoa, Cammell, Gill, Beever and Thornley1989) to partition nutrient intakes between requirements for maintenance and growth has been demonstrated in relation to ruminants, pigs, chickens and turkeys (Darmani Kuhi et al. Reference Darmani Kuhi, Kebreab, Owen and France2001, Reference Darmani Kuhi, Kebreab, Lopez and France2003, Reference Darmani Kuhi, Kebreab, Lopez and France2004, Reference Darmani Kuhi, Kebreab, Lopez and France2009; Kebreab et al. Reference Kebreab, France, Agnew, Yan, Dhanoa, Dijkstra, Beever and Reynolds2003, Reference Kebreab, Schulin-Zeuthen, Lopez, Soler, Dias, De Lange and France2007, Reference Kebreab, France, Darmani Kuhi and Lopez2008; Schulin-Zeuthen et al. Reference Schulin-Zeuthen, Kebreab, Dijkstra, Lopez, Bannink, Darmani Kuhi and France2008). In the current study, models that exhibited statistically superior fit to data from monogastric animals in previous work, i.e. models representing diminishing returns behaviour (monomolecular and rectangular hyperbola), were applied to male and female broiler breeder pullets (aged between 1 and 21 weeks) to provide estimates of their energy and protein needs for maintenance and growth. The resultant curves and overall calculated goodness of fit criteria showed that the fits of the models to the data were acceptable (Figs 1 and 2 and Tables 4 and 5). In spite of similarity in biological indicators calculated for each sex using parameter estimates of two models (Tables 6 and 7), quantitative examination of the predictive ability of both models by error measurement indices showed superiority for monomolecular equation. These findings are in agreement with the same category of studies which expressed the monomolecular equation as the best in describing response curves in animals (Darmani Kuhi et al. Reference Darmani Kuhi, Kebreab, Owen and France2001, Reference Darmani Kuhi, Kebreab, Lopez and France2003, Reference Darmani Kuhi, Kebreab, Lopez and France2004, Reference Darmani Kuhi, Kebreab, Lopez and France2009; Kebreab et al. Reference Kebreab, France, Agnew, Yan, Dhanoa, Dijkstra, Beever and Reynolds2003, Reference Kebreab, Schulin-Zeuthen, Lopez, Soler, Dias, De Lange and France2007, Reference Kebreab, France, Darmani Kuhi and Lopez2008; Schulin-Zeuthen et al. Reference Schulin-Zeuthen, Kebreab, Dijkstra, Lopez, Bannink, Darmani Kuhi and France2008). For each sex, the values determined for MEm and CPm varied slightly between the two models (Tables 6 and 7). With regard to the estimates of ME requirements for maintenance (from 365 to 432 kJ/kg LW/d) and average ME utilization obtained using the models, these estimates lie in the range reported by previous researchers (Johnson & Farrell Reference Johnson and Farrell1983; Sakomura Reference Sakomura2004). Depending upon the study, the energy cost of 1 g gain in BW in poultry is between 8·80 and 13·55 kJ (Wiseman Reference Wiseman1994; Sakomura et al. Reference Sakomura, Silva, Couto, Coon and Pacheco2003). This range is in good agreement with 11·42–12·10 kJ estimated in the current study for the average values of net energy requirements for producing of 1 g gain in BW between 1–9 times maintenance (Table 6). The value of average net protein utilization for producing gain in BW calculated between 1 and 9 times maintenance varied from 0·61 to 0·64 g/g, depending on the model and sex (Table 7). The energy and protein cost of gain in BW were higher in female than in male broiler breeder pullets. The energy (or protein) efficiency of female broilers will usually be lower than male birds of corresponding weight after about 30 days of age. Female birds tend to deposit proportionally more fat in the carcass. It takes nine times as much energy from feed to produce body fat as it does muscle. The reason for this is that fat contains more energy than protein per unit of weight, and more importantly, muscle is only about 0·20 protein by weight, the remainder being water (Leeson Reference Leeson2000). The same finding was reported by Eggert & Nielsen (Reference Eggert and Nielsen2006), working with three lines of mice selected for heat loss. From the values of average net energy and protein utilization for producing gain in BW at different multiples of maintenance, it can be seen that efficiency of utilization of ME and CP is greatest at low intake levels and decreases as intake is increased. These results are supported by conventional wisdom, namely that a gradual decrease in efficiency of utilization of nutrients for producing gain occurs as intake increases (Gahl et al. Reference Gahl, Crenshaw and Benevenga1994; Fatufe & Rodehutscord Reference Fatufe and Rodehutscord2005; Romero et al. Reference Romero, Zuidhof, Renema, Robinson and Naeima2009). This is partly due to a slight fall in digestive efficiency of the animal with increased feeding level and partly to the fact that anabolic processes are less efficient than catabolic ones. Protein turnover is higher as protein intake is increased, as any excess in amino acid supply causes a rise in amino acid degradation rates (Riis Reference Riis and Riis1983a, Reference Riis and Riisb; Pannemans et al. Reference Pannemans, Halliday, Westerterp and Kester1995). Therefore, successive increments of daily intake of nutrients result in progressively smaller increments in daily gain (Blaxter & Boyne 1978).
The NRC (1994) committee stated that it would be desirable to have mathematical models available that would facilitate the selection of the most economical combinations of dietary concentrations of protein/amino acids (and other nutrients) and energy to achieve poultry production goals. Pesti & Miller (Reference Pesti and Miller1997) and Sterling et al. (Reference Sterling, Vedenov, Pesti and Bakalli2005) have discussed some theoretical concepts behind least-cost and maximum-profit feed formulation models. They state that the typical formulation model for poultry feed used today simply calculates the combination of ingredients that meet given specifications at a minimum cost. This model is assumed to result in maximum profits, based on the idea that birds will eat the correct amount of nutrients as long as feed ingredients provide the right proportion of ME. Models built on the premise that the growth rate determines requirements based on some fixed rate of nutrient utilization do not adequately represent the biological phenomenon involved and that dynamic models (such as the law of diminishing returns) which can determine the protein and energy levels that result in the most economical use of feed ingredients need to be incorporated into each firm's model for such diverse functions as enterprise planning, planning feed ingredient purchases, and scheduling feed diversity and slaughter. In conclusion, the models described herein were considered advantageous because they could predict the magnitude and direction of the responses of growing broiler breeder pullets to dietary ME and CP intake, which can be used in choosing and developing special feeding programs to decrease production costs.