Introduction
The occurrence of abnormal body weight in children and adults is a common problem all over the world. Underweight, as well as overweight and obesity, are currently highlighted as being among the most important threats to human health. According to UNICEF, Southern Asia, including India, has some of the highest levels of child undernutrition and underweight in the world (UNICEF & WHO, 2017). This has also been shown to be the case by extensive research on underweight in children and adolescents in the Indian population (Bamji, Reference Bamji2003; Nandy et al., Reference Nandy, Irving, Gordon, Subramanian and Smith2005). Moreover, these problems more often affect those from the lower social classes and those living in low-income environments (Chaturvedi et al., Reference Chaturvedi, Kapil, Gnanasekaran, Sachdev, Pandey and Bhanti1996; Nandy et al., Reference Nandy, Irving, Gordon, Subramanian and Smith2005; Bisai et al., Reference Bisai, Bose and Ghosh2008).
At the same time, India, as a developing country, is currently undergoing numerous socioeconomic changes, which are reflected in modifications in the lifestyles and diets of children (Yajnik, Reference Yajnik2004). For example, the vast majority of teenagers in the country are opting to travel by car or bus rather than biking or walking (Gamit et al., Reference Gamit, Moitra and Verma2015; Arora et al., Reference Arora, Shinde and Patwardhan2017). In addition, nearly 16% of children aged 10–15 declare that they do not participate in any form of physical activity, and almost 65% exercise for less than 4 hours a week (Hussain et al., Reference Hussain, Tenglikar and Nigudgi2016). Moreover, nearly half of Indian adolescents watch TV for more than 7 hours a week (Hussain et al., Reference Hussain, Tenglikar and Nigudgi2016). Other studies have shown that over 15% of adolescents spend at least 3 hours a day in front of a computer (Yadav et al., Reference Yadav, Yadav, Gautam, Manohar, Yadav and Gupta2015). Changes in the socioeconomic environment also include the increase in poor eating habits. For example, Hajare et al. (Reference Hajare, Deoke and Saoji2016) found that over 36% of teenagers in India eat ‘junk food’ more than three times a week.
All these factors are contributing to the rising prevalence of overweight and obesity, as well as increasing amount of fat tissue in the body composition. This, in turn, is associated with the already observed growing risk of many diseases of affluence in India. In 2000 it was estimated that more than 12% of the Indian population had Type II diabetes, and a similar proportion was affected by impaired glucose tolerance (Ramachandran et al., Reference Ramachandran, Snehalatha, Kapur, Vijay, Mohan and Das2001). In addition, cardiovascular disease, which is closely correlated with increased adiposity and body weight, has been predicted to be the leading cause of premature death of adults in India by 2025 (Reddy, Reference Reddy1993). Such phenomena are especially concerning as they also affect children, who are also becoming increasingly overweight and obese (Khadilkar et al., Reference Khadilkar, Yadav, Agrawal, Tamboli, Banerjee and Cherian2015). About 10% of all Indian teenagers are estimated to be overweight and 5–6% are obese (Gamit et al., Reference Gamit, Moitra and Verma2015; Ghonge et al., Reference Ghonge, Patel, Nagar and Thakor2015). Additionally, it has recently been suggested that, of all South Asian countries, India has the highest proportion of overweight among adolescents (Jayawardena et al., Reference Jayawardena, Ranasinghe, Wijayabandara, Hills and Misra2017).
The increased prevalence of overweight and obesity in India is related to the socioeconomic situation in the country – for instance, the level of education and occupation of parents, and consequently the social position of the family (Gamit et al., Reference Gamit, Moitra and Verma2015). Therefore, abnormalities connected with excessive weight are of particular concern to the upper and middle classes in society. Obesity has been found to affect over 32% of males and 50% of females in these socioeconomic groups (Sharma et al., Reference Sharma, Sharma and Mathur2007). A similar problem has also been shown in the children of wealthy families living in urban areas and attending private schools (Ramachandran et al., Reference Ramachandran, Snehalatha, Vinitha, Thayyil, Kumar and Sheeba2002; Marwaha et al., Reference Marwaha, Tandon, Singh, Aggarwal, Grewal and Mani2006). Moreover, the desire to obtain an appropriate education, profession and therefore social prestige is correlated with decreasing time spent in school doing any form of physical activity (Hussain et al., Reference Hussain, Tenglikar and Nigudgi2016).
Overweight and obesity in children increases the likelihood of the incidence of excess body weight in adulthood (Marwaha et al., Reference Marwaha, Tandon, Singh, Aggarwal, Grewal and Mani2006), and also results in a greater risk of diseases such as gallbladder dysfunction, hypertension, osteoarthritis and dyslipidaemia (Sharma et al., Reference Sharma, Sharma and Mathur2007).
Thus India, as a developing country, is currently facing the co-existence of the dual problems of underweight and overweight/obesity. This issue is deepened by the class differences in Indian society. The aim of the present study was to analyse selected anthropometric features of children, adolescents and young adults from middle-class families residing in Kolkata, India, and to compare the values of these characteristics in different BMI and adiposity categories.
Methods
The study population consisted of 4194 Bengali children, adolescents and young adults (1999 males and 2195 females) aged 7–21 years from middle-class families residing in Kolkata, India. The participants attended 66 schools and colleges in Kolkata and applied to participate in the study in response to an appeal made through the administration of the respective academic institutions. The male sample was collected from thirteen schools in north Kolkata and its sixteen colleges; the females were from 28 schools and nine colleges located in both the south and north of Kolkata. All individuals were generally healthy. Underage students participated in the study with the consent of their parents or legal guardians.
Measurements were carried out between the years 2005 and 2011, followed the protocol of the International Biological Programme (1969) and were conducted according to Martin’s technique (Martin & Saller, Reference Martin and Saller1957). A set of anthropometric tools manufactured by GPM (Switzerland) consisting of an anthropometer (1 mm accuracy), small spreading calliper (1 mm accuracy) and anthropometric steel tape (5 mm accuracy) was used. Also, a Lange skinfold calliper (Beta Technology, USA) with a constant pressure of 10 g/mm2 (1 mm accuracy) and an electronic weight by Libra (India) with an accuracy of 0.5 kg, were used. Details of the methodology and socioeconomic characteristics of the sample have been described in previous publications (Dasgupta et al., Reference Dasgupta, Nube, Sengupta and de Onis2015; Das et al., Reference Das, Das, Datta Banik, Saha, Chakraborty and Dasgupta2016).
Body height, sitting height and humerus and femur breadths were measured. The thicknesses of triceps, subscapular and suprailiac skinfolds were also recorded, as well as upper-arm and calf circumferences and body weight. Body mass index (BMI: body weight [kg]/body height [m]2) and the sum of skinfolds thicknesses (triceps, subscapular and suprailiac) were calculated.
The subjects were then categorized by BMI values according to WHO categories: overweight (+1 z-score), normal weight (between +1 and −1 z-score) and underweight (−1 z-score) (WHO, 2014). Adiposity category was determined on the basis of the standard deviation of the sum of skinfolds, with the norm between +1 and −1 z-score. High body fat was observed above +1 z-score, and low body fat below −1 z-score. The skinfold thickness values were normalized by logarithm transformation before the analysis. The calculated z-scores were then compared between the described BMI and adiposity categories. The significances of the differences were analysed using a two-way ANOVA, with significance set at p ≤ 0.05, and the relationship between the BMI and adiposity was assessed by linear regression analysis. All calculations were performed in Statistica 12.0.
Results
BMI categories
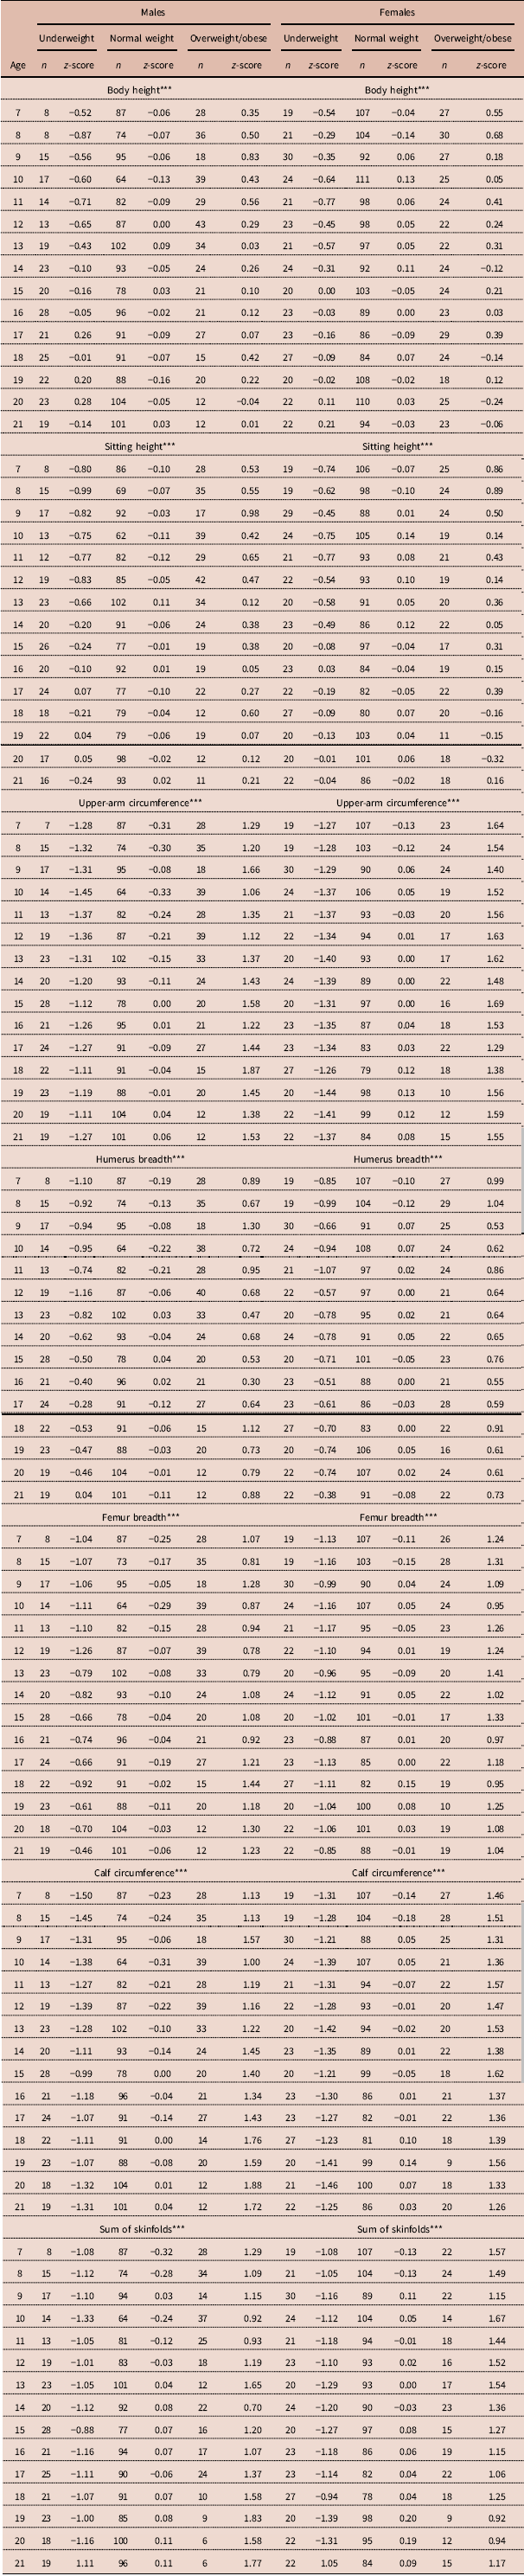
Table 1 shows the mean anthropometric measure z-scores of the study participants by BMI category, age and sex. The average body height in both sexes differed between BMI categories (p ≤ 0.001 in both sexes). The standardized body height values were lowest in the underweight participants and highest in the overweight group. This was observed up to 9 years of age in the overweight girls and up to 14 years of age in the underweight ones. In males, the described changes between BMI categories occurred up to around 12 years of age in the overweight group, and up to 14 years of age in the underweight participants.
Mean anthropometric characteristic z-scores of study participants by BMI category

*** p ≤ 0.001.
Body mass index differentiated the sitting height of subjects (p ≤ 0.001 in both sexes). The highest mean values were observed in overweight participants, and the lowest in underweight ones. Again, this tendency was present in both sexes in the younger age groups.
As for upper-arm circumference, the highest values were recorded for overweight/obese participants, and the lowest for the underweight group (p ≤ 0.001 in both sexes). Similarly, the highest average values of calf circumference were reported for overweight participants, and the smallest for those with the lowest BMI (p ≤ 0.001 in both sexes).
In the case of humerus breadth, the overweight/obese participants had the highest values, while the lowest was observed in underweight participants (p ≤ 0.001 in both sexes). Measurements of femur breadth also presented the highest scores in overweight and the lowest among underweight participants (p ≤ 0.001 in both sexes).
The differences between BMI categories were also present for the mean sum of skinfold thicknesses (p ≤ 0.001 in both sexes). The highest values were observed in overweight participants and the lowest in those who were underweight. Among females, the biggest differences between the groups in overweight and normal BMI were observed in the youngest children, and their level decreased with age. The opposite trend was observed in underweight females.
Adiposity categories
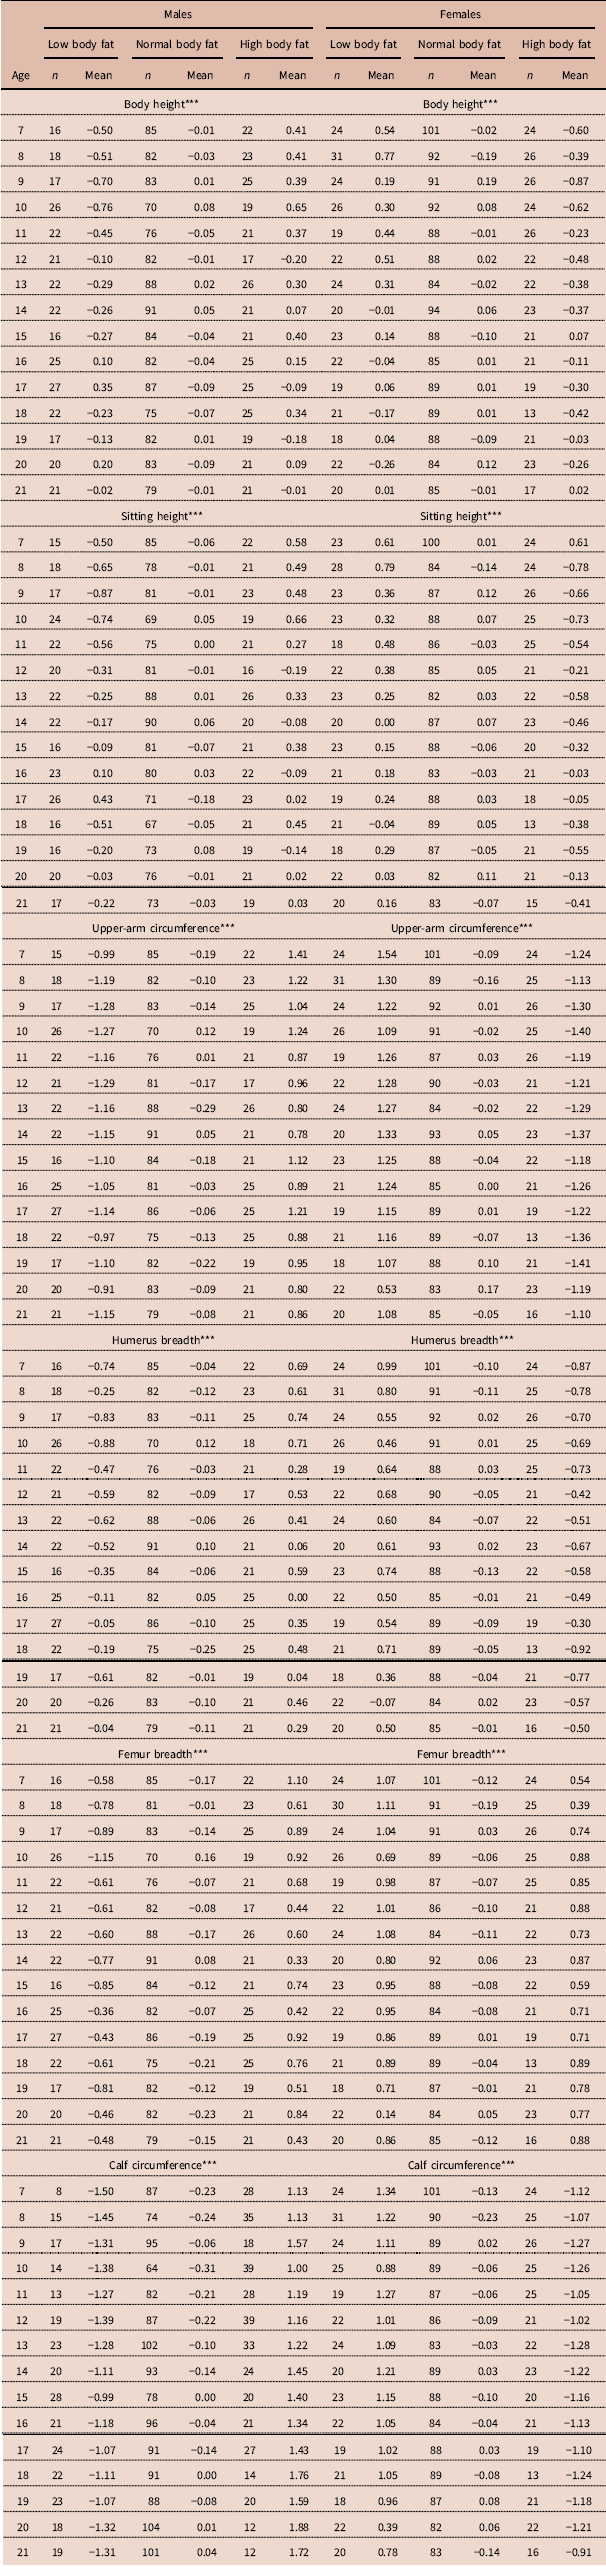
Table 2 shows the mean anthropometric measure z-scores of study participants by adiposity category, age and sex. Participants with varying adiposity differed in body height (p ≤ 0.001 in both sexes). Groups with low body fat content were characterized by the lowest values of this feature, and the highest were observed among participants with high body fat. In females, this was present up to 9 years of age in a group with excessive adipose tissue, and 14 years for those with low body fat. In males, the differences between adiposity categories disappeared around 12 years of age.
Mean anthropometric characteristic z-scores of study participants by adiposity category

*** p ≤ 0.001.
The level of body fat differentiated also the sitting height (p ≤ 0.001 in both sexes). The highest sitting height was observed in participants with excessive adiposity, while the lowest occurred in those with low body fat. This pattern was present in both sexes until about 13 years of age.
For upper-arm circumference, the highest values were recorded in children with high body fat, and the lowest among those with low adiposity (p ≤ 0.001 in both sexes). The described pattern persisted in all participants with low and normal body fat, in all age categories. Among females with excessive adiposity, the differences from the norm decreased with age.
The largest mean calf circumference was noted for individuals with high body fat, and the smallest for those with the lowest adiposity (p ≤ 0.001 in both sexes). The described pattern persisted in all males, and in females with low and normal body fat, in all age categories. Among females with excessive adiposity, the differences from the norm decreased with age.
Individuals in different adiposity categories also differed significantly in mean humerus breadth (p ≤ 0.001). This was highest in the group with high body fat, and lowest in the group with low adiposity. This remained at similar levels in females in almost every age group and in males up to about 14 years.
Mean femur breadth also showed differences between the different adiposity categories (p ≤ 0.001 in both sexes). Participants with excess body fat were characterized by the highest femur breadth values; those with low adiposity had the lowest values. This pattern was present at similar levels in almost all age categories in both females and males with high and normal body fat. Among males with low adiposity, the differences generally decreased with age.
Due to the similarities observed in the BMI and adiposity categories, a linear regression was performed to establish if BMI is a good predictor adiposity. The analysis showed that there was a significant relationship between BMI value and adiposity. The estimated function explained 66% of the body fat ratio variation regardless of sex, 76% in females and 59% in males. The positive values of the slopes suggested that with increasing BMI, the sum of skinfold thicknesses also increased. This was especially visible in females, for whom the slope value was highest (Table 3).
Linear regression between BMI and adiposity

*** p ≤ 0.001.
Discussion
This study shows similar patterns of changes in individuals’ anthropometric characteristics in both BMI and adiposity categories. Furthermore, the linear regression analysis confirmed the presence of a significant relationship between BMI and adiposity. This suggests that BMI is, at least in the analysed population, a good predictor of body fat percentage. However, in the literature a contrary conclusion may be encountered (Bray et al., Reference Bray, DeLany, Volaufova, Harsha and Champagne2002; Brambilla et al., Reference Brambilla, Bedogni, Heo and Pietrobelli2013). This is mainly due to the fact that BMI only takes into account total body mass, and not body composition (Prentice & Jebb, Reference Prentice and Jebb2001; Demerath et al., Reference Demerath, Schubert, Maynard, Sun, Chumlea and Pickoff2006). However, at the same time, other sources report relatively high effectiveness of BMI as a method of predicting the level of body fat in children, especially those with overweight/obesity (Lindsay et al., Reference Lindsay, Hanson, Roumain, Ravussin, Knowler and Tataranni2001; Freedman et al., Reference Freedman, Thornton, Mei, Wang, Dietz, Pierson and Horlick2004, Reference Freedman, Wang, Maynard, Thornton, Mei and Pierson2005; Mei et al., Reference Mei, Grummer-Strawn, Wang, Thornton, Freedman and Pierson2007; Freedman & Sherry, Reference Freedman and Sherry2009; Martin-Calvo et al., Reference Martin-Calvo, Moreno-Galarraga and Martinez-Gonzalez2016). For overweight/obese boys and girls, BMI can reach as much as 90% specificity and 70–80% predictive value for body fat content (Freedman & Sherry, Reference Freedman and Sherry2009). It is also worth noting that BMI values by themselves, as well as their z-scores, are a good reference for predicting the body composition of children (Kakinami et al., Reference Kakinami, Henderson, Chiolero, Cole and Paradis2014). In addition, the usefulness of this index as a predictor of adiposity, although relatively poor for lean children, increases with higher levels of body fat (Lindsay et al., Reference Lindsay, Hanson, Roumain, Ravussin, Knowler and Tataranni2001; Mast et al., Reference Mast, Langnäse, Labitzke, Bruse, Preuss and Müller2002; Freedman & Sherry, Reference Freedman and Sherry2009).
The finding in the presented analysis that high BMI is a good proxy for adiposity may, therefore, result from the specificity of the studied population. The examined children came from India, where average body fat content is relatively higher than, for example, in the European population (Lear et al., Reference Lear, Humphries, Kohli, Chockalingam, Frohlich and Birmingham2007, Reference Lear, Kohli, Bondy, Tchernof and Sniderman2009). Additionally, the ethnic group of the study population is characterized by a relatively low proportion of lean mass in the total weight (Lear et al., Reference Lear, Kohli, Bondy, Tchernof and Sniderman2009), and this applies to children too, especially boys (Katzmarzyk et al., Reference Katzmarzyk, Barreira, Broyles, Champagne, Chaput and Fogelhom2015). The association of the observed results with the origin of the study group can be also confirmed by the fact that BMI appears to be better correlated with adiposity in more homogeneous populations than, for example, ethnically heterogeneous ones (Javed et al., Reference Javed, Jumean, Murad, Okorodudu, Kumar and Somers2015).
The study also found that participants with higher BMI values and greater adiposity were characterized by larger upper-arm and calf circumferences. Underweight individuals with low body fat content were, in contrast, characterized by relatively low upper-arm and calf circumferences. A similar correlation between BMI and upper-arm circumference was observed in another study in a South Asia population (Dasgupta et al., Reference Dasgupta, Butt, Saha, Basu, Chattopadhyay and Mukherjee2010). Together these findings may prove the usefulness of these circumference measurements, not only as a tool for the diagnosis of undernutrition but also as a predictor of excessive weight and adiposity (Mazıcıoğlu et al., Reference Mazıcıoğlu, Hatipoğlu, Oztürk, Ciçek, Ustünbaş and Kurtoğlu2010; Chaput et al., Reference Chaput, Katzmarzyk, Barnes, Fogelholm, Hu and Kuriyan2017). Upper-arm circumference as a determinant of overweight/obesity was also confirmed by a recent study of Indian children and adolescents carried out by Jaiswal et al. (Reference Jaiswal, Bansal and Agarwal2017), who found that, as a determinant of overweight/obesity, it was characterized by 95% sensitivity and a specificity of 90%.
In addition, the present study found that calf circumference correlated with BMI and adiposity categories. Therefore, this measurement could also be helpful as an additional indicator of underweight, overweight/obesity and adipose tissue content. This observation is in line with the results of research conducted by Almeida et al. (Reference Almeida, Furtado, Mascarenhas, Ferraz, Silva and Ferreira2016). It is important to stress that calf circumference has already been used for such purposes, but mainly in elderly populations (Gavriilidou et al., Reference Gavriilidou, Pihlsgård and Elmståhl2015; Júnior et al., Reference Júnior, da Coqueiro, Carneiro, Pereira, Barbosa and de Magalhães2016). The results of the present study show that it can also be useful in children, adolescents and young adults.
This study showed that overweight and obese individuals also had high humerus and femur breadths, with the lowest values being noted in those who were underweight and with low body fat. These results confirm the findings of Parkinson et al. (Reference Parkinson, Drewett, Jones, Dale, Pearce, Wright and Adamson2011), who showed a significant correlation between BMI and bone breadths in children aged 6–8 years. This phenomenon can also be a result, as often observed in overweight/obesity, of relatively high muscle mass, which is linearly linked to body strength (Ducher et al., Reference Ducher, Bass, Naughton, Eser, Telford and Daly2009). According to Mechanostat theory, changes in bone tissue dimensions follow dynamic load, and are therefore the result of muscle force (Frost, Reference Frost2003). Consequently, persons with a relatively higher weight will be characterized by higher bone measurements. At the same time, however, it is worth stressing that this is not a positive tendency, as the increasing surface area of bone does not cause its higher density. Moreover, obese people are often characterized by a relatively lower bone density than those in other BMI categories (Wetzsteon et al., Reference Wetzsteon, Petit, Macdonald, Hughes, Beck and McKay2008). This is probably due to the higher risk of micro-damage associated with excessive skeletal load. In addition, the constant need to repair such damage, at least temporarily, increases the porosity of bone, leading to its greater susceptibility to fractures and breakage (Donahue & Galley, Reference Donahue and Galley2006).
The described differences in limb circumferences and bone breadths were found to be similar in all analysed age groups. However, differences in body height measurements between BMI and adiposity categories were only observed during the pre-pubertal years. In adolescence, these differences gradually disappeared, but at different rates for each category. Underweight girls and boys achieved heights similar to those of children of normal weight but later than their peers with overweight/obesity and high body fat. This suggests that the content of adipose tissue influences the regulation of the biological maturation – a finding supported by the results of other studies (De Leonibus et al., Reference De Leonibus, Marcovecchio, Chiavaroli, de Giorgis, Chiarelli and Mohn2014; Prokopowicz et al., Reference Prokopowicz, Matusik, Szymczyk, Dziurok, Cogiel and Francuz2014; Holmgren et al., Reference Holmgren, Niklasson, Nierop, Gelander, Aronson and Sjöberg2017). It has also been proven that children with high BMI and adiposity not only reach puberty earlier, but that it also lasts longer than in their peers in other BMI/adiposity categories (De Leonibus et al., Reference De Leonibus, Marcovecchio, Chiavaroli, de Giorgis, Chiarelli and Mohn2014; Holmgren et al., Reference Holmgren, Niklasson, Nierop, Gelander, Aronson and Sjöberg2017).
The present results suggested a relatively faster growth of overweight/obese children during the pre-pubertal years. Similar results have been observed in other studies, such as De Leonibus et al. (Reference De Leonibus, Marcovecchio, Chiavaroli, de Giorgis, Chiarelli and Mohn2014), Godfrey et al. (Reference Godfrey, Umapathy, Latha Ravichandran and Shilpa Senthil2016) and Zheng et al. (Reference Zheng, Suzuki, Sato, Yokomichi, Shinohara and Yamagata2014). Interestingly, this is not an effect of excess growth hormone (GH), as the level of this in children with high BMI and adiposity is relatively low. It is therefore defined as GH-independent growth, and is attributed to other factors, such as increased insulin and leptin levels, excess amounts of insulin-like growth factor (IGF), IGF and GH binding proteins, and adrenal androgens (Godfrey et al., Reference Godfrey, Umapathy, Latha Ravichandran and Shilpa Senthil2016; Holmgren et al., Reference Holmgren, Niklasson, Nierop, Gelander, Aronson and Sjöberg2017). In addition, the overload of calories in the diet of overweight/obese children may also be a source of accelerated growth. Importantly, these factors influence not only the growth of the fat but also of other tissues, such as muscles and bones. Therefore, as previously suggested, high adiposity co-exists with increased limb circumferences and bone breadths, as observed in overweight/obese pre-pubertal children. Acceleration of bone growth before adolescence is also often associated with increased bone age (Marcovecchio & Chiarelli, Reference Marcovecchio and Chiarelli2013; Prokopowicz et al., Reference Prokopowicz, Matusik, Szymczyk, Dziurok, Cogiel and Francuz2014; Godfrey et al., Reference Godfrey, Umapathy, Latha Ravichandran and Shilpa Senthil2016). This, in turn, may cause children who are relatively tall in their pre-pubertal years to not achieve their optimum final height, because their bone fusion occurred too early (Godfrey et al., Reference Godfrey, Umapathy, Latha Ravichandran and Shilpa Senthil2016). This phenomenon is also visible in the results of the present work. Despite the similarity of the final values, it can clearly be noted that both underweight and normal weight children are taller than overweight/obese ones in the oldest age groups. It is also suggested that boys and girls with excess weight and adiposity are characterized by a lower pubertal height gain, which too may be the cause of the described outcome (Marcovecchio & Chiarelli, Reference Marcovecchio and Chiarelli2013; Holmgren et al., Reference Holmgren, Niklasson, Nierop, Gelander, Aronson and Sjöberg2017).
In conclusion, children, adolescent and young adults in different categories of BMI and adiposity were found to differ significantly in the analysed somatic traits. Some of these differences remain almost constant throughout the development period, while others, such as height measurements, disappear during puberty. Such divergences in individual traits make some of them effective tools for relatively easy, quick and inexpensive diagnosis of underweight, overweight/obesity or abnormal levels of body fat. They may also be an additional criterion used together with other measurements to improve the accuracy of the applied methods.
Ethical Approval.
The authors assert that all procedures contributing to this work comply with the ethical standards of the relevant national and institutional committees on human experimentation and with the Helsinki Declaration of 1975, as revised in 2008.
Conflicts of Interest.
The authors have no conflicts of interest to declare.
Funding.
This study has been sponsored by the Neys van Hoogstraten foundation, The Netherlands (ID158), and Indian Statistical Institute, Kolkata, India.