Introduction
Major depressive disorder (MDD) is a common heritable psychiatric disorder with a complex polygenic architecture, which is associated with cognitive and emotional dysfunction and other metabolic conditions, such as obesity and type 2 diabetes (Major Depressive Disorder Working Group of the Psychiatric et al., Reference Ripke, Wray, Lewis, Hamilton, Weissman and Sullivan2013; Milaneschi et al., Reference Milaneschi, Lamers, Peyrot, Baune, Breen and Dehghan2017; Wray et al., Reference Wray, Pergadia, Blackwood, Penninx, Gordon, Nyholt and Sullivan2012). Structural neuroimaging studies report that MDD is typically accompanied by lower grey matter volumes (GMVs) in the anterior cingulate cortex (ACC), dorsolateral prefrontal cortex (dlPFC) and medial temporal cortex (MTC) (van Tol et al., Reference van Tol, van der Wee, van den Heuvel, Nielen, Demenescu, Aleman and Veltman2010; Zou et al., Reference Zou, Deng, Li, Zhang, Jiang, Huang and Sun2010), and greater GMV in visual cortex (VC) and temporo-parietal junction (TPJ) (Oudega et al., Reference Oudega, van Exel, Stek, Wattjes, van der Flier, Comijs and van den Heuvel2014; Wehry et al., Reference Wehry, McNamara, Adler, Eliassen, Croarkin, Cerullo and Strawn2015). Interestingly, brain volumes in these regions have higher heritability in the healthy human brain (Geschwind, Miller, DeCarli, & Carmelli, Reference Geschwind, Miller, DeCarli and Carmelli2002; Peper, Brouwer, Boomsma, Kahn, & Hulshoff Pol, Reference Peper, Brouwer, Boomsma, Kahn and Hulshoff Pol2007; Zhao et al., Reference Zhao, Luo, Li, Li, Zhang, Shan and Zhu2019), such as 0.31 for both heritabilities of dlPFC and MTC, 0.26 for lateral occipital and 0.29 for TPJ (Zhao et al., Reference Zhao, Luo, Li, Li, Zhang, Shan and Zhu2019). Studies have identified genetic mediators of structural deficits within MTC and ACC in individuals with MDD (i.e. Brain-derived neurotrophic factor (BDNF) and 5-HTTLPR) (Frodl et al., Reference Frodl, Schule, Schmitt, Born, Baghai, Zill and Meisenzahl2007, Reference Frodl, Koutsouleris, Bottlender, Born, Jager, Morgenthaler and Meisenzahl2008). However, genetic polymorphisms in a single gene could have moderate indirect effects on grey matter structure across the whole brain in MDD. Based on the typical paradigm of molecular biology, studying genome-regulated transcription [message RNA (mRNA)] is a complementary approach that reflects the effects of genetic sequence variation on grey matter structure in MDD.
Transcriptome profile studies offer a way to identify gene transcriptional correlates of MDD through measuring mRNA expression levels of each gene. Transcriptomal profiles of the postmortem prefrontal cortex and ACC in MDD patients have revealed altered gene expression patterns in neurotransmitter receptor regulation (Klempan et al., Reference Klempan, Sequeira, Canetti, Lalovic, Ernst, Ffrench-Mullen and Turecki2009), metabolic processing (Klempan et al., Reference Klempan, Sequeira, Canetti, Lalovic, Ernst, Ffrench-Mullen and Turecki2009) and neuroimmune function (Shelton et al., Reference Shelton, Claiborne, Sidoryk-Wegrzynowicz, Reddy, Aschner, Lewis and Mirnics2011). Moreover, individuals with MDD showed down-regulated expression of synaptic-related genes and a corresponding decreased number of synapses in the dlPFC (Kang et al., Reference Kang, Voleti, Hajszan, Rajkowska, Stockmeier, Licznerski and Duman2012), which may also be related to lower dlPFC GMV in MDD patients (Rajkowska et al., Reference Rajkowska, Miguel-Hidalgo, Wei, Dilley, Pittman, Meltzer and Stockmeier1999). In addition, protein products of gene expression were associated with energy metabolism and synaptic function in the dlPFC in MDD patients (Martins-de-Souza et al., Reference Martins-de-Souza, Guest, Harris, Vanattou-Saifoudine, Webster, Rahmoune and Bahn2012). At the cellular level, MDD patients showed reduced ACC glial cell density and neuronal size, which may contribute to the reduced ACC GMV (Cotter, Mackay, Landau, Kerwin, & Everall, Reference Cotter, Mackay, Landau, Kerwin and Everall2001). However, these studies exploring the intracellular and molecular mechanisms of MDD have focused on hypothesis-driven brain regions. Thus, evidence of genetic influence on whole-brain GMV in depression is sparse. Identification of structural endophenotypes in MDD has been hampered by a disconnect between human genetics and neuroimaging, including transcriptome profiles, proteome atlases and cellular architecture (Congdon, Poldrack, & Freimer, Reference Congdon, Poldrack and Freimer2010). Thus, there is an urgent need to fill these gaps and identify genetic determinants of MDD-related regional GMV differences on transcriptional and translational determinants ranging from transcriptome to proteome to cell types. This important information will extend our current understanding of biological pathways involved in MDD-related structural pathologies and provide a basis for generating hypotheses regarding gene-regional GMV relationships in MDD.
To address these issues, we performed an integrative omics analysis by combining transcriptional and translational determinants from the transcriptome, proteome profiles and cell types. Specifically, we first performed a meta-analysis of 68 whole-brain voxel-based morphometry (VBM) studies to assess the convergent whole-brain pattern of volumetric changes in MDD relative to healthy controls. Second, we investigated transcriptome signatures that were associated with global GMV changes through multivariate analysis [partial least squares (PLS)] of meta-analytic maps and whole-brain gene expression profiles provided by the Allen Institute for Brain Science (AIBS). Third, to interpret the relationship between differential expression patterns in MDD and transcriptome signatures that related to GMV changes, we used four brain transcriptome datasets with differential expressed genes (DEGs) in dlPFC and ACC in MDD patients compared to the healthy controls. Furthermore, to investigate the specific biological pathways associated with regional GMV variations in MDD, we performed the graph-based weighted correlation network analysis (WGCNA) with gene lists in transcriptome signatures and summarized the information from transcriptional and translational determinants, including the anatomical architecture of modules, gene ontologies and cell types. Finally, we applied a proteome atlas of six postmortem healthy human brains to link with the identified transcriptome signatures and regional GMV changes in VC and dlPFC.
Methods and materials
Dataset overview
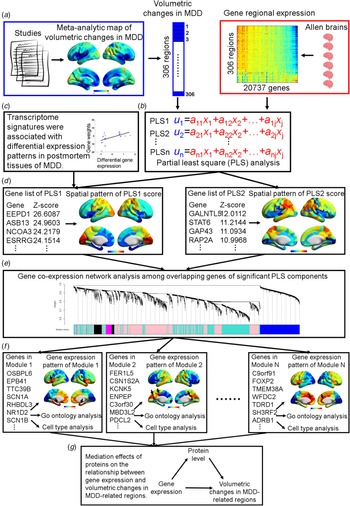
This study included five datasets (online Supplementary Table S1). Dataset 1 was used to derive a map of GMV changes in MDD relative to healthy controls through meta-analysis. Dataset 2 included gene expression profiles of postmortem brain tissue from six healthy donors from the Allen Human Brain Atlas and was used to identify the transcriptome signatures associated with GMV changes in MDD. Dataset 3 included four differential transcriptome profiles of postmortem brain tissues in MDD relative to healthy controls and was used to examine the relationship between the abnormal transcriptions and transcriptome signatures related to GMV changes. These four differential transcriptome profiles are from specific brain regions, including two gene expression profiles for ACC and another two for the dlPFC. Dataset 4, which was available from Zhang et al. (Reference Zhang, Chen, Sloan, Bennett, Scholze, O'Keeffe and Wu2014), was used to examine the enrichment of transcriptome-related genes in specific cell types, including neuron, astrocyte and oligodendrocyte. Dataset 5 included proteome profiles of an anatomically comprehensive set of brain regions from six donors in BrainSpan (Carlyle et al., Reference Carlyle, Kitchen, Kanyo, Voss, Pletikos, Sousa and Nairn2017) and was used to investigate whether the proteome profiles mediated the relationship between the MDD-related transcriptomal signatures and GMV differences in MDD. A schematic overview of the study protocol is provided in Fig. 1.
Schematic overview of the workflow in this study. (A) First, we obtained a meta-analytic map of volumetric changes in MDD relative to healthy controls across 68 studies. Mean volumetric changes were calculated across 306 cortical regions. In parallel, gene expression profiles for 20 737 genes were calculated across the same 306 cortical regions. (B) PLS was used to identify a linear combination of genes that had a similar cortical pattern of expression to the map of volumetric changes in MDD. (C) We also examined the association between our identified transcriptome signatures and differential expression of genes in postmortem tissues of MDD patients compared to healthy controls. (D) For each significant PLS component, we compared the spatial patterns of PLS scores with the meta-analytic map and performed biological annotations associated with global structural changes in MDD. (E) Among the gene lists in transcriptome signatures, gene co-expression network analysis was used to disassemble these transcriptome signatures by grouping a series of co-varying genes into specialized gene clusters. (F) For each identified gene cluster, we examined the expression pattern across the whole brain and the enrichment of biological pathways and cell types by integrating information from transcriptional and translational determinants, such as transcriptome atlas, gene-set enrichment and cell types of rodents. (G) Finally, we examined the mediation effect of proteins on the relationship between our identified transcriptome profiles and volumetric changes of MDD-related brain regions.

Whole-brain VBM meta-analysis in MDD
The whole-brain VBM meta-analysis was used to determine the pattern of GMV changes in MDD relative to healthy controls. Identified studies were published in English before May 2017 from five online public datasets, including PubMed (PubMed Central), Neurosynth, ScienceDirect, Web of Science and the BrainMap database. Selected studies were restricted to whole-brain structural MRI studies using VBM analysis to compare MDD patients and healthy controls (see Supplement). Following the application of these criteria, 68 VBM studies of MDD with 2737 patients and 3098 controls were included (online Supplementary Table S2).
To identify MDD-related GMV changes, the coordinate-based anisotropic effect-size signed differential mapping (AES-SDM) meta-analysis was performed using SDM software (https://www.sdmproject.com/, version 5.141). Specifically, we first converted the coordinates reported in Talairach space to MNI standard space (Lancaster et al., Reference Lancaster, Tordesillas-Gutierrez, Martinez, Salinas, Evans, Zilles and Fox2007). Then, AES-SDM created an effect-size map and an effect-size variance map from t values and effect-sizes (Hedge's d value) of peak coordinates reported in each study. Next, all maps were combined with a model of random effects by accounting for sample size, intra-study variability and between-study variance (Radua et al., Reference Radua, Mataix-Cols, Phillips, El-Hage, Kronhaus, Cardoner and Surguladze2012). Finally, a null distribution was empirically estimated using permutation statistics to obtain meta-analytic maps with GMV changes in MDD (see Supplement).
Allen brain atlas data
The brain atlas of the transcriptome profiles we used was previously defined by Whitaker et al. (Whitaker et al. Reference Whitaker, Vertes, Romero-Garcia, Vasa, Moutoussis, Prabhu and Bullmore2016) and widely used to explore the relationship between transcriptome and structural changes in brain disorders (McColgan et al., Reference McColgan, Gregory, Seunarine, Razi, Papoutsi, Johnson and Track-On2017; Romero-Garcia, Warrier, Bullmore, Baron-Cohen, & Bethlehem, Reference Romero-Garcia, Warrier, Bullmore, Baron-Cohen and Bethlehem2018; Romme, de Reus, Ophoff, Kahn, & van den Heuvel, Reference Romme, de Reus, Ophoff, Kahn and van den Heuvel2017). The microarray data for six donors in this atlas are available from the AIBS (http://human.brain-map.org/static/download) (Hawrylycz et al., Reference Hawrylycz, Miller, Menon, Feng, Dolbeare, Guillozet-Bongaarts and Lein2015). In the microarray dataset, each of the 3702 brain tissues determined the location of 306 parcellated anatomical structures based on the MNI coordinates closest to the AIBS sample (Whitaker et al., Reference Whitaker, Vertes, Romero-Garcia, Vasa, Moutoussis, Prabhu and Bullmore2016). Expression data were averaged across all samples from all donors in the matching anatomical structures, resulting in a region of interest (ROI) × gene, 306 × 20 737, matrix of the transcriptome profiles (see Supplement). In addition, previous studies used leave-one-donor-out approach and Combining Batches of Gene Expression Microarray Data (ComBat) (Johnson, Li, & Rabinovic, Reference Johnson, Li and Rabinovic2007) to confirm the robustness of expression profile to the effects of inter-individual differences and artefactual correlation induced by batches and donors (Romero-Garcia et al., Reference Romero-Garcia, Warrier, Bullmore, Baron-Cohen and Bethlehem2018).
Partial least squares analysis
We used the multivariate approach of PLS (McColgan et al., Reference McColgan, Gregory, Seunarine, Razi, Papoutsi, Johnson and Track-On2017; Whitaker et al., Reference Whitaker, Vertes, Romero-Garcia, Vasa, Moutoussis, Prabhu and Bullmore2016) to explore the transcriptome–brain relationship. In our study, the predictor variable comprised a ROI × gene (306 × 20 737) matrix, and the response variable comprised one ROI vector (mean GMV values extracted from the meta-analytic map across the same 306 ROIs). PLS identified several ranked components of gene expression having maximum covariance with GMV changes through singular value decomposition (Abdi & Williams, Reference Abdi and Williams2013), such that the first few PLS components (PLS1, PLS2, etc.) provide the optimal low-dimensional representation of covariance. In each component, genes were assigned weights (positive or negative) and ranked based on the contribution to the variance they explained. The positive weights represent genes with a higher than average gene expression contributing to greater GMV in MDD, whereas the negative weights represent genes with a higher than average gene expression contributing to lower GMV in MDD. The PLS components were examined for statistical significance with two-tailed alpha = 0.05 by 1000 permutations through shuffling the ROI labels assigned to the response variable. We also used bootstrapping (resampling with the replacement of the 306 regions) to estimate the standard error of each gene in each PLS component. For each component, we separately ranked the genes with the ratio of their weights to the bootstrapped error based on their contribution to the component in descending (from positive to negative weights) and ascending (from negative to positive weights) orders. Finally, top- and down-ranked genes in each component were separately performed using gene ontology (GO) analysis (Gorilla: http://cbl-gorilla.cs.technion.ac.il) (Eden, Lipson, Yogev, & Yakhini, Reference Eden, Lipson, Yogev and Yakhini2007; Eden, Navon, Steinfeld, Lipson, & Yakhini, Reference Eden, Navon, Steinfeld, Lipson and Yakhini2009) with false discovery rates (FDRs, q < 0.05) correction. For the visualization of the GO terms in REViGO (http://revigo.irb.hr), we also discarded items with over 1500 genes given their general biological processes.
Relationship between abnormal transcriptions in MDD and transcriptome signatures of volumetric changes
To examine whether differential expression in MDD brains was associated with genetic signatures of GMV changes, we first obtained differential expression profiles in the regions with GMV changes in MDD, such as ACC (GSE54565 and GSE54562) and dlPFC (GSE92538; Shelton et al. Reference Shelton, Claiborne, Sidoryk-Wegrzynowicz, Reddy, Aschner, Lewis and Mirnics2011), which were available from microarray datasets (https://www.ncbi.nlm.nih.gov/gds). Then, we extracted DEG profiles (p < 0.005) from the datasets of GSE54565, GSE54562 and GSE92538, and gene lists from Shelton et al., (Reference Shelton, Claiborne, Sidoryk-Wegrzynowicz, Reddy, Aschner, Lewis and Mirnics2011). Among four brain regions (bilateral ACC and dlPFC), we separately performed Pearson correlation analysis between DEGs with the log2 fold change and corresponding gene weights in the first PLS component.
Construction of gene co-expression network
Given that the transcriptome architectures discussed above are from a global anatomical perspective, we next applied WGCNA [available from R library (Langfelder & Horvath, Reference Langfelder and Horvath2008)] to decrease the redundancy of the genetic signatures and detect specialized gene regulatory landscapes that capture local structural deficits in MDD by grouping a series of co-varying genes into gene clusters across the whole brain. In our analysis, the co-expression network comprised nodes corresponding to genes overlapping with positive or negative weights among significant PLS components and edges corresponding to the pairwise correlations between the gene expression levels. We selected soft thresholding power 5 based on the scale-free topology criterion (see Supplement).
Gene module identification and annotation
Genes module assignments were determined by a hybrid dynamic tree-cutting algorithm with default parameters except deepSplit = 2, cutHeight = 0.999 (Langfelder, Zhang, & Horvath, Reference Langfelder, Zhang and Horvath2008). Then, gene modules were iteratively merged until all pairs of module eigengenes (MEs; the first principle component of the module) were correlated with r < 0.8 (Hawrylycz et al., Reference Hawrylycz, Miller, Menon, Feng, Dolbeare, Guillozet-Bongaarts and Lein2015; Langfelder & Horvath, Reference Langfelder and Horvath2007) (see Supplement). MEs are considered the most representative gene expression in a module and are used to describe the spatial distribution of modules across the whole brain (Langfelder & Horvath, Reference Langfelder and Horvath2007). The ToppGene (https://toppgene.cchmc.org/) portal (Chen, Bardes, Aronow, & Jegga, Reference Chen, Bardes, Aronow and Jegga2009) was used to functionally annotate the gene lists in identified modules. Those annotations included GO annotations (biological process, cellular component and molecular function) and Kyoto Encyclopaedia of Genes and Genomes pathway annotation.
Cell types characterization of genes within the modules
As mouse models have shown the enrichment of genes in different cell types, such as neurons, astrocytes and oligodendrocytes (Zhang et al., Reference Zhang, Chen, Sloan, Bennett, Scholze, O'Keeffe and Wu2014), we converted human genes to mouse orthologues using HGNC Comparison of Orthology Predictions tool (http://www.genenames.org/help/hcop) (Eyre, Wright, Lush, & Bruford, Reference Eyre, Wright, Lush and Bruford2007) (see Supplement). Then, for genes within each module, we compared them with the cell type dataset and separately counted genes that had a significant enrichment (at least 10 fragments per kilobase of transcript sequence per million mapped fragments) in neurons, astrocytes and oligodendrocytes. Finally, we calculated the proportion of each cell type in individual gene modules.
Proteome analysis
We used the proteome database of adult human brain tissue (Carlyle et al., Reference Carlyle, Kitchen, Kanyo, Voss, Pletikos, Sousa and Nairn2017) to investigate the mediation effects of proteins on the relationship between MDD-related transcriptome signatures and structural differences in MDD. We used the proteome atlas with six donors (HSB123, HSB126, HSB127, HSB135, HSB136 and HSB145), which is available from BrainSpan (Carlyle et al., Reference Carlyle, Kitchen, Kanyo, Voss, Pletikos, Sousa and Nairn2017). We extracted the averaged proteome data in two overlapping regions between transcriptome and proteome atlas across six donors from the dlPFC and VC. Next, we separately extracted gene expression and corresponding protein data that showed overlap between transcriptome and proteome atlases and the corresponding averaged gene weights in significant PLS components. Finally, mediation analyses were separately performed to investigate whether an independent variable (i.e. the gene expression profile) affects a dependent variable (i.e. PLS weights) through a mediator variable (i.e. the protein profile) on dlPFC and VC volumes. These were performed with 1000 bias-corrected bootstrap samples to generate 95% confidence intervals (CIs) for indirect effects testing (Preacher & Hayes, Reference Preacher and Hayes2004).
Protein–protein interaction network
To investigate whether MDD-related proteins could form a protein–protein interaction network involved in structural changes in MDD, we used the Search Tool for the Retrieval of Interacting Genes/Proteins (http://string-db.org) (Szklarczyk et al., Reference Szklarczyk, Franceschini, Wyder, Forslund, Heller, Huerta-Cepas and von Mering2015) to construct protein interactive network. This dataset includes protein–protein interaction information from numerous sources, including experimental data, publications and computational prediction methods. Only medium-confidence (>0.4) links were retained.
Results
Transcriptome signatures associated with global structural variations in MDD
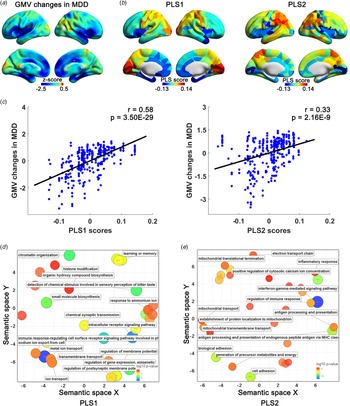
Across 68 studies, the whole-brain VBM meta-analytic maps consistently displayed lower GMV within the ACC, MTC, dlPFC and mPFC, and greater GMV within the left VC and right TPJ in MDD patients relative to healthy controls (Fig. 2A).
Transcriptome signatures were associated with grey matter volume changes in MDD. (A) Meta-analytic map of volumetric differences in MDD. Blue and red–yellow separately represent the regions with lower (e.g. ACC, MTC, dlPFC and medial prefrontal cortex) and greater volumes (e.g. left VC and right TPJ) in MDD patients relative to healthy controls. (B) Spatial patterns of PLS scores for significant PLS components (PLS1 and PLS2). PLS scores were calculated by multiplying the PLS weights in each component (a vector with 20 737 values) and gene expression matrix (20 737 × 306). Red–yellow and blue separately represented positive (e.g. VC, right TPJ and parietal cortex) and negative PLS scores (e.g. insula, cingulate cortex and MTC) across the whole brain. The regions with more positive PLS scores in significant PLS components (PLS1 and PLS2) showed greater Z-scores in the meta-analytic map of volumetric changes and vice versa, which suggests similar patterns between the identified PLS components and volumetric changes in MDD. (C) The spatial patterns of significant PLS components positively associated with grey matter volume changes in MDD. Each dot represents a brain region, thus there are 306 dots (306 brain regions) in each plot. Significant GO items associated with PLS components, including PLS1 (D) and PLS2 (E), were shown in the semantic space (p FDR < 0.05). Significantly GO annotations were plotted in semantic space, in which similar terms were shown close to each other. Markers are scaled and coloured based on the log10 p value for the significance of each annotation. Large blue circles are more significant, whereas small red circles are less significant. Associated biological pathways are shown beside the circles.

As noted, we used a multivariate PLS approach to elucidate the transcriptome profiles associated with structural changes in MDD. The first two PLS components explained 45.05% of the GMV covariance across the whole brain (p < 0.001). These two components both showed similar spatial patterns with the VBM meta-analytic map, with positive scores in the VC, TPJ and motor cortex, and negative scores in the ACC and MTC (Fig. 2B). Moreover, we found a positive correlation between the PLS scores and GMV changes across the whole brain (PLS1: r = 0.58, p = 3.50 × 10⁻²⁹; PLS2: r = 0.33, p = 2.16 × 10⁻⁹; Fig. 2C).
PLS1 was rich in genes involved in synaptic transmission, metal ion transmembrane transport and sensory perception (p FDR < 0.05; Fig. 2D and online Supplementary Table S3), while PLS2 genes are involved in mitochondrial function and immune response (p FDR < 0.05; Fig. 2E and online Supplementary Table S4). These findings suggest expression profiles associated with GMV changes in MDD mainly involved in synaptic signalling, energy metabolism, and immunological processes.
Differential expression patterns in MDD associated with transcriptome signatures of volumetric changes
We next examined the relationship between our identified transcriptome signatures and DEG in the postmortem brain tissue of MDD patients, including ACC and dlPFC. The results showed a significantly negative correlation between abnormal transcription of genes in ACC and PLS1 weights (GSE54565: r = −0.45, p = 0.007; GSE54562: r = −0.17, p = 0.01; online Supplementary Fig. S1), which suggests that the genes positively weighted in the component were relatively under-expressed in the ACC of MDD patients compared with controls. In contrast, disrupted expression of genes in dlPFC was positively correlated with PLS1 weights (GSE92538: r = 0.16, p = 4.79 × 10⁻⁹; Shelton: r = 0.53, p = 0.007; online Supplementary Fig. S1), which suggests that genes positively weighted in component were relatively over-expressed in the dlPFC in MDD patients compared with controls. Moreover, GO analysis showed an enrichment of DEGs involved in mitochondrial function, metabolic and immunological processes, neuronal development and transmembrane transport, similar to those in the transcriptome signatures (p FDR < 0.05; online Supplementary Table S5).
Gene co-expression network captures the regional structural variations in MDD
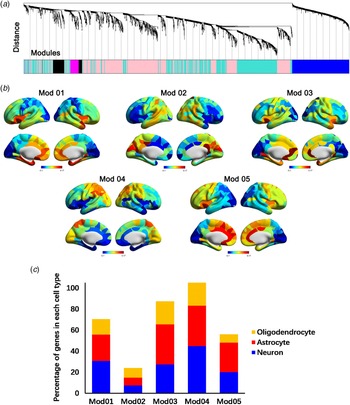
We next applied a graph-based WGCNA approach to detect specialized transcriptome signatures that can capture local structural changes in MDD. We first constructed a co-expression network with 3411 genes overlapping between the first two PLS components (Fig. 3A). It included five gene modules, individual modules that were enriched expression in specific anatomical structures (red regions) involved in MDD structural changes (Fig. 3B). Specifically, Mod 01 and Mod 04 were enriched in the MTC and TPJ, respectively. Mod 02 was manifested in the sensory cortex, such as VC. In contrast, Mod 03 and Mod 05 showed enrichment in different parts of the cingulate cortex, such as ventral ACC and dorsal ACC. Cell type specific analysis identified a large proportion of genes assigned to Mod 01 and Mod 04 with higher neuronal expression, whereas other modules were represented as non-neuronal modules with large astrocyte and oligodendrocyte signatures (Fig. 3C). GO enrichment analysis also showed each module characterized by specific biological processes, such as neural development, metabolism and immune response (p < 0.001, Table 1 and online Supplementary Table S6–S10).
Specialized gene modules captured regional grey matter volume variations in MDD. (A) Construction of gene co-expression network on the MDD-related genes in the transcriptome signatures. Each colour represents the gene being assigned to the modules. (B) Spatial patterning of five gene modules with expression values of module eigengenes. Individual modules are enriched in specific anatomical architectures, with enrichment predominantly in the regions showing grey matter volume differences in MDD. Expression range of module eigengenes scaled from minimum (blue) to maximum (red) across the brain. (C) Percentage of the known neuron-, astrocyte- and oligodendrocyte-enriched genes in five gene modules.

Biological annotations of gene modules

GO, gene ontology; MF, molecular function; BP, biological process; CC, cellular component; FDR B&H, false discovery rate Benjamini & Hochberg.
Note: the top three most significant GO terms are displayed for each gene module. Full tables can be found in online Supplementary Tables S6–S10.
Integrating with the above-mentioned multi-dimensional information of gene modules, we found individual modules that were enriched for different cell classes in distinct anatomical structures and were associated with various biological pathways. Specifically, Mod 01 and Mod 04 were largely selective for neuronal expression and enriched in MTC and TPJ, with genes associated with neuronal development (p = 1.84 × 10⁻⁷) and metabolism (p = 6.25 × 10⁻⁶), respectively. Mod 02 was selective for non-neuronal expression in VC, with genes involved in sensory perception (p = 7.73 × 10−40). Mod 03 and Mod 05 were enriched in non-neuronal expression in the ventral ACC and dorsal ACC, with genes associated with immune function (p = 1.94 × 10⁻¹¹) and transmembrane transport (p = 2.69 × 10⁻⁵), respectively.
Proteome profiles mediated the relationship between transcriptome signatures and structural changes in MDD
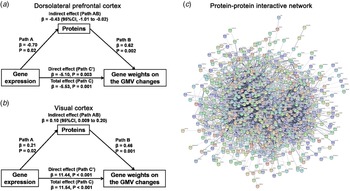
We next assessed the mediation effects of 771 proteins showing the overlap between transcriptome and proteome atlases in dlPFC and VC. Results of mediation analyses revealed proteins mediated the association between gene expression profiles and weights on the GMV in dlPFC (Fig. 4A, β = −0.43, 95% CI −1.01 to −0.02) and VC (Fig. 4B, β = 0.10, 95% CI 0.009–0.20). These proteins were also involved in biological processes, such as neural development, synaptic transmission, metabolism and neuroimmune processes (p FDR < 0.05; online Supplementary Table S11). Moreover, we found 85.92% proteins interacted to form a protein–protein interaction network (p < 1.00 × 10⁻¹⁶, Fig. 4C), which indicates protein involvement in the alterations of GMV in MDD.
Proteins mediated the relationship between transcriptome profiles and grey matter volume changes in the manner of the interactive network in MDD. Proteins mediated the relationships between the transcriptome architecture and volume changes in the dlPFC (A) and VC (B). These MDD-related proteins integrated a consensus protein–protein interaction network involved in biological pathways. Proteins were represented by nodes with various colours. Edges between nodes represent protein–protein associations and were weighted by the Search Tool for the retrieval of interacting genes/proteins confidence scores. Only medium-confidence (>0.4) links were retained, and disconnected proteins are not shown.

Discussion
Our integrative omics analysis revealed the genetic configuration of MDD-related GMV changes on transcriptional and translational determinants ranging from transcriptome to proteome profile to cellular architecture. Specifically, we first showed that transcriptome signatures associated with global volumetric changes in MDD were enriched in synaptic communication, metabolic and immune processes, transmembrane transport and sensory perception. We also observed that our identified transcriptome signatures were associated with genes with differential expression in the postmortem dlPFC and ACC in MDD patients. Second, gene co-expression network analysis identified specialized gene modules with differential biological annotations that capture regional structural changes in MDD. Modules enriched in the MTC and TPJ were largely selective for neuronal expression, with genes differentially associated with energy metabolism and neuronal development. Moreover, modules were enriched for the non-neuronal expression in different parts of ACC, with genes associated with immune function and transmembrane transport. Finally, protein profiles mediated the relationship between transcriptome patterns and MDD-related GMV differences in a protein–protein interactive network in dlPFC and VC. These findings bridge the complicated link between biological sources and structural variations in MDD and expand our understanding of neurobiological mechanisms underlying MDD.
In our meta-analysis of VBM studies, we observed lower GMV in the ACC, MTC and dlPFC and greater GMV in the VC and TPJ in MDD patients compared with healthy controls. Previous studies have provided converging evidence of neuroimaging and histopathology for lower volume in these MDD-related regions. A majority of meta-analyses of structural neuroimaging studies have reported lower volume in the ACC (Bora, Fornito, Pantelis, & Yucel, Reference Bora, Fornito, Pantelis and Yucel2012; Lai, Reference Lai2013), hippocampus and insula in MDD (Schmaal et al., Reference Schmaal, Veltman, van Erp, Samann, Frodl, Jahanshad and Hibar2016; Wise et al., Reference Wise, Radua, Via, Cardoner, Abe, Adams and Arnone2017), which was consistent with our findings. Neuropathological studies showed reduced glial cell density and neuronal size in ACC (Cotter et al., Reference Cotter, Mackay, Landau, Kerwin and Everall2001), hippocampus (Stockmeier et al., Reference Stockmeier, Mahajan, Konick, Overholser, Jurjus, Meltzer and Rajkowska2004) and dlPFC (Kang et al., Reference Kang, Voleti, Hajszan, Rajkowska, Stockmeier, Licznerski and Duman2012; Rajkowska et al., Reference Rajkowska, Miguel-Hidalgo, Wei, Dilley, Pittman, Meltzer and Stockmeier1999) in MDD, which may contribute to lower brain volume (Anderson, Reference Anderson2011).
Using the multivariate PLS analysis, we identified genetic correlates of global structural variations in MDD, which are involved in synaptic signalling, metabolic and immune responses and transmembrane transport. We next focused on interpreting these MDD-related biological annotations in transcriptome signatures. The synaptic signalling terms, such as regulation of postsynaptic membrane potential, modulation of neurochemical synaptic transmission and anterograde trans-synaptic signalling, were strongly implicated in the pathogenesis of MDD (Jans, Riedel, Markus, & Blokland, Reference Jans, Riedel, Markus and Blokland2007; Rothman, Cathala, Steuber, & Silver, Reference Rothman, Cathala, Steuber and Silver2009). Previous studies also observed that lower levels of synaptic signalling related genes in MDD tightly involved in a reduction of neural plasticity and number of synapses in both dlPFC and hippocampus (Duman & Aghajanian, Reference Duman and Aghajanian2012; Duric et al., Reference Duric, Banasr, Stockmeier, Simen, Newton, Overholser and Duman2013; Kang et al., Reference Kang, Voleti, Hajszan, Rajkowska, Stockmeier, Licznerski and Duman2012), which was associated with lower volumes in these regions. Metabolic GO terms, such as mitochondria function, organic compound metabolism and protein synthesis, have been reported to be associated with energy imbalance within the brain and body of MDD patients (Biver et al., Reference Biver, Goldman, Delvenne, Luxen, De Maertelaer, Hubain and Lotstra1994; Milaneschi et al., Reference Milaneschi, Lamers, Peyrot, Baune, Breen and Dehghan2017; Milaneschi, Simmons, van Rossum, & Penninx, Reference Milaneschi, Simmons, van Rossum and Penninx2019). Positron emission tomography studies have also shown lower glucose metabolism in the TPJ and dlPFC in MDD (Biver et al., Reference Biver, Goldman, Delvenne, Luxen, De Maertelaer, Hubain and Lotstra1994), which could be normalized after successful paroxetine therapy (Kennedy et al., Reference Kennedy, Evans, Kruger, Mayberg, Meyer, McCann and Vaccarino2001). Moreover, some epidemiological studies reported a greater risk of obesity and diabetes complications in MDD (Gavard, Lustman, & Clouse, Reference Gavard, Lustman and Clouse1993; Milaneschi et al., Reference Milaneschi, Simmons, van Rossum and Penninx2019). Immune-related items, such as antigen processing and responses to cytokine, have also been implicated in MDD (Dantzer, O'Connor, Freund, Johnson, & Kelley, Reference Dantzer, O'Connor, Freund, Johnson and Kelley2008). MDD is associated with adaptive immune response in the T cells and natural killer cells in studies of differential expression profiles in brain tissues and peripheral blood (Jansen et al., Reference Jansen, Penninx, Madar, Xia, Milaneschi, Hottenga and Sullivan2016; Leday et al., Reference Leday, Vertes, Richardson, Greene, Regan, Khan and Bullmore2018; Shelton et al., Reference Shelton, Claiborne, Sidoryk-Wegrzynowicz, Reddy, Aschner, Lewis and Mirnics2011). Finally, the transmembrane transport terms, such as metal ion and neurotransmitter transport, provide support of the prevailing hypothesis in 5-hydroxytryptamine reuptake inhibition in MDD (Hieronymus, Emilsson, Nilsson, & Eriksson, Reference Hieronymus, Emilsson, Nilsson and Eriksson2016; Svenningsson, Kim, Warner-Schmidt, Oh, & Greengard, Reference Svenningsson, Kim, Warner-Schmidt, Oh and Greengard2013). Greater glutamate levels in the extracellular matrix could potentially have an impact on the neuronal activity and efficiency of glutamate signalling (Choudary et al., Reference Choudary, Molnar, Evans, Tomita, Li, Vawter and Jones2005).
When thousands of genes might differ between regions, network analysis can subdivide variations into smaller, more biologically coherent sets of modules to identify molecular underpinnings associated with brain-wide pathology in disorders. WGCNA analysis helps to decrease the redundancy of the genetic signatures and elucidate the biological mechanisms of gene clusters through transcriptional and translational determinants, including specific anatomic patterning, biological pathways and cell types. We showed that Mod 01 was predominantly enriched in the MTC with genes largely expressed in neurons and associated with neural development. Neuropathological analyses in postmortem hippocampal tissue in MDD patients support these results. The soma size of pyramidal neurons in the hippocampus is significantly lower in MDD than controls, which may contribute to lower hippocampal volume measured by structural neuroimaging (Stockmeier et al., Reference Stockmeier, Mahajan, Konick, Overholser, Jurjus, Meltzer and Rajkowska2004). We showed that neuronal Mod 04 was enriched with genes associated with metabolic-related pathways in the TPJ. This is consistent with positron emission tomography studies, in which the parietal cortex showed disturbances of glucose metabolism in unipolar depression (Biver et al., Reference Biver, Goldman, Delvenne, Luxen, De Maertelaer, Hubain and Lotstra1994; Kennedy et al., Reference Kennedy, Evans, Kruger, Mayberg, Meyer, McCann and Vaccarino2001). Non-neuronal modules (e.g. Mod 03 and Mod 05) mainly showed enrichment in ACC, with genes associated with immune function and transmembrane transport. Microarray analysis of postmortem ACC demonstrated down-regulation of glutamate transporters-related genes in MDD, which could represent elevated levels of extracellular glutamate and affect the efficiency of glutamate signalling (Choudary et al., Reference Choudary, Molnar, Evans, Tomita, Li, Vawter and Jones2005). Moreover, abnormal expression of immune-related genes, such as interleukin-1β (IL-1β), IL-6 and tumour necrosis factor (Maes, Reference Maes1995; Miller & Raison, Reference Miller and Raison2016; Miller, Maletic, & Raison, Reference Miller, Maletic and Raison2009), and lower density of glial cells across all layers were identified in the ACC in MDD patients (Cotter et al., Reference Cotter, Mackay, Landau, Kerwin and Everall2001; Gittins & Harrison, Reference Gittins and Harrison2011). Taken together, analysis of specialized gene modules not only can elucidate regional structural variations in MDD, but also extend findings from peripheral blood and limited postmortem tissue, which link genetic architecture to psychopathology in MDD (Klempan et al., Reference Klempan, Sequeira, Canetti, Lalovic, Ernst, Ffrench-Mullen and Turecki2009; Shelton et al., Reference Shelton, Claiborne, Sidoryk-Wegrzynowicz, Reddy, Aschner, Lewis and Mirnics2011; Spijker et al., Reference Spijker, Van Zanten, De Jong, Penninx, van Dyck, Zitman and Hoogendijk2010).
Despite the complicated pathway from the post-transcriptional to the post-translational processes, our findings revealed the mediation effects of proteins on the relationship between transcriptome profiles and MDD-related GMV differences in dlPFC and VC. Moreover, these MDD-related proteins are involved in neural development, synaptic transmission and metabolic processes, which was consistent with the proteome signatures in shotgun analyses of dlPFC in MDD (Johnston-Wilson et al., Reference Johnston-Wilson, Sims, Hofmann, Anderson, Shore, Torrey and Yolken2000; Martins-de-Souza et al., Reference Martins-de-Souza, Guest, Harris, Vanattou-Saifoudine, Webster, Rahmoune and Bahn2012). These findings suggest that the proteome provides a complementary approach to understanding the genetic determinants of structural variations in MDD. Finally, we should note that further work is needed to validate the mediation effects in other brain regions.
There are several limitations to this work. First, the use of gene expression profiles from the healthy human brain in AIBS to explain GMV changes is limited to the extent that transcription in patients could be different from those in healthy brains. Although abnormal transcription in dlPFC and ACC in MDD has shown tight associations with our identified signatures, additional regions across the whole brain should be examined to further interpret the correlates of these signatures to differential gene expression patterns in MDD. Second, the signatures we identified were available from the AIBS atlas, as other human brain transcriptome atlases such as Braineac (Ramasamy et al., Reference Ramasamy, Trabzuni, Guelfi, Varghese, Smith, Walker and Weale2014) offer a lower resolution of sample collection relative to the AIBS atlas. Therefore, our findings need to be validated through other transcriptome atlases with more participants. Third, the interpretability of PLS analyses is hampered by the fact that expression patterns were not separated by directional effects, such as decreased or increased expression. Up- or down-regulation of a gene may equally represent variations within a certain cell type or in the structural differences related to MDD. Likely, gain or loss of function of genes was difficult to distinguish in the enrichment analyses.
Supplementary material
The supplementary material for this article can be found at https://doi.org/10.1017/S0033291720002676.
Acknowledgements
This work was supported by the National Institute of Mental Health Grants MH102406-01 (to L.B.). We thank Michele Bertocci for her valuable comments. We thank the AIBS founders, Paul G. Allen and Jody Allen, for their encouragement and support of gene transcriptome data of healthy human brain. Proteome data were generated as part of the PsychENCODE Consortium, supported by U01MH103339, U01MH103365, U01MH103392, U01MH103340, U01MH103346, R01MH105472, R01MH094714, R01MH105898, R21MH102791, R21MH105881, R21MH103877, and P50MH106934 awarded to Schahram Akbarian (Icahn School of Medicine at Mount Sinai), Gregory Crawford (Duke), Stella Dracheva (Icahn School of Medicine at Mount Sinai), Peggy Farnham (USC), Mark Gerstein (Yale), Daniel Geschwind (UCLA), Thomas M. Hyde (LIBD), Andrew Jaffe (LIBD), James A. Knowles (USC), Chunyu Liu (UIC), Dalila Pinto (Icahn School of Medicine at Mount Sinai), Nenad Sestan (Yale), Pamela Sklar (Icahn School of Medicine at Mount Sinai), Matthew State (UCSF), Patrick Sullivan (UNC), Flora Vaccarino (Yale), Sherman Weissman (Yale), Kevin White (UChicago) and Peter Zandi (JHU).
Conflict of interest
The authors report no biomedical financial interests or potential conflicts of interest.