The evolution of surgical management of CHD has resulted in increased early treatment in the first few weeks of life, combined with comprehensive strategies aimed at surgical correction. With these improvements in management, a 5-year survival of 95% and a 5-year cumulative freedom from re-operation of 73% have been reported in children with CHD, using population-based registries in the current era.Reference Erikssen, Liestol and Seem 1 , Reference Raissadati, Nieminen, Jokinen and Sairanen 2 Ethnic disparities in early postoperative mortality after surgery for CHD are well described. After adjusting for case-mix, these disparities have not been explained adequately by the usual predictors of increased mortality or differences in access to health care.Reference Oster, Strickland and Mahle 3 , Reference Benavidez, Gauvreau and Jenkins 4
The Australian indigenous (Aboriginal and Torres Strait Islander) population has a high prevalence of cardiovascular disease, with a high reported incidence of CHD,Reference Bolisetty, Daftary, Ewald, Knight and Wheaton 5 , Reference Bower and Ramsay 6 rheumatic heart disease,Reference Alizzi, Knight and Tully 7 and premature coronary artery disease.Reference Weimers, Marney and Muller 8 In the adult population, it has been shown that indigenous patients undergoing cardiac surgery show no difference in early morbidity and mortality as compared with the broader population, but do have reduced long-term survival. This may be influenced by factors such as inequitable access to healthcare and inadequate follow-up.Reference Prabhu, Tully, Bennetts, Tuble and Baker 9 , Reference Russell, Tran and Baker 10 Although studies have shown excellent short-term outcomes in indigenous children with CHD undergoing cardiac surgery in Australia, there is limited information describing long-term outcomes in the indigenous population.Reference Padley, Cole and Pye 11 , Reference Rohde, Matebele, Pohlner, Radford, Wall and Fraser 12 The aim of this study was to report on comparative mortality and re-intervention rates between indigenous and non-indigenous children in the 6 years following cardiac surgery and examine the adequacy of this follow-up.
Methods
All children who underwent cardiac surgery for CHD and acquired heart disease, between May, 2006 and August, 2014, at the Queensland Paediatric Cardiac Service, Queensland, Australia, were enrolled in this clinical cohort study. The Queensland Paediatric Cardiac Service is a quaternary service that delivers all levels of paediatric cardiac care, except cardiac transplantation, for a population of ~5 million people. Outreach services for major regional centres and smaller indigenous communities are provided. This study was approved by the Mater Health Services Human Research Ethics Committee (reference no. 14/MHS/76).
Patients were followed-up from the time of their first surgery during the study period until December, 2014 or until death, whichever occurred first. Surgical procedures, which occurred after the index procedure, were identified in the surgical database and then used to calculate re-intervention rates. The date of last cardiology follow-up was identified using the electronic health record (Healthtrack Medical Systems, Brisbane, Australia). Patients were identified as lost to follow-up if they had not been seen within the time specified in the last correspondence. Patients referred to another Paediatric Cardiology service were coded as not lost to follow-up if correspondence was received from the new treating cardiologist. Mortality and surgical re-intervention were the two primary end points of this study.
Patient demographic, social, and clinical data, including operative and perioperative information, were collected prospectively at the time of surgery and entered into an electronic database. The socio-economic status of the usual residence of children was assessed at the postcode level using the Socio-Economic Indexes for Areas – 2011.Reference Pink 13 The risk-adjusted complexity of the surgical procedure performed was determined at the time of procedure and validated by the surgical team. The surgical complexity of all procedures was stratified using the Basic Aristotle Complexity score. The Comprehensive Aristotle Complexity score, which accounts for patient-adjusted complexity by including other complicating procedure-dependent factors, such as anatomical factors, associated procedures, and age at surgery, as well as procedure-independent factors, such as weight, prematurity, other clinical factors, and extra-cardiac factors at surgery, was also calculated.Reference Lacour-Gayet, Clark and Jacobs 14
Statistical analysis
Summary statistics are presented as means (standard deviation) and medians (range) for continuous variables and as proportions (percentages) for categorical variables. The association between patient characteristics and indigenous status was compared using Student’s t-test (continuous variables) and the χ2 test (categorical variables). The associations between clinical characteristics and mortality and re-intervention rates were investigated using Cox’s proportional hazards models. First, univariable models were run, and then models were adjusted for the Comprehensive Aristotle Complexity score. Effect estimates are presented as hazard ratios (HR) with 95% confidence intervals (CI).
We performed two post-hoc analyses to determine whether indigenous status was an independent risk factor for either study end point. First, considering that the Comprehensive Aristotle Complexity score includes procedure-independent information that may be related to social disadvantage, we replaced it with the Basic Aristotle Complexity score in the multivariable models to ensure we were not ‘over adjusting’ for the social disadvantage known to characterise indigenous populations. Second, we used propensity score matching to derive two samples – 118 indigenous and 118 non-indigenous patients matched for sex, Socio-Economic Indexes for Areas score, Comprehensive Aristotle Complexity score, bypass time, and ventilation time. The propensity score was estimated using a logistic regression model with 1:1 nearest neighbour matching without replacement based on an acceptable calliper width of 0.2 times the standard deviation of the logit of the propensity score.Reference Austin 15 Balance diagnostics were then assessed by calculating the residual bias – that is, the mean difference of a given covariate between treatment groups divided by the square root of the average of the variation of the covariate between the treatment groups – with individual values above 0.1 and the median of all values above 0.05 indicative of balance not having been achieved.Reference Austin 15 Finally, Cox’s regressions were used to calculate the increased risk of death and re-intervention over the study period because of the indigenous status among the sample of propensity score-matched pairs. The standard errors of these models were calculated with a clustered sandwich estimator to account for the lack of independence among the matched pairs.Reference Austin 16
Results
A total of 1528 consecutive patients were identified in the cardiac surgical database, of whom 123 (8.1%) were identified to be of indigenous heritage. Comparison of the annual cumulative incidence of cardiac surgery between the two groups showed no significant difference (indigenous 0.031% versus non-indigenous 0.025%; p=0.88). 17 There was no difference in the proportion of patients with an antenatal diagnosis between the two groups (p=0.73). The median length of follow-up for indigenous patients was 25.9 months (with a range from 1 day to 81.3 months) and was 26.7 months (with a range from 1 day to 82.1 months) for non-indegenous patients (p=0.98). Compliance for follow-up at ambulatory tertiary cardiology clinics was 93.8% for indigenous and 95.6% for non-indigenous patients (p=0.17).
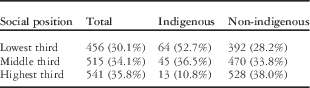
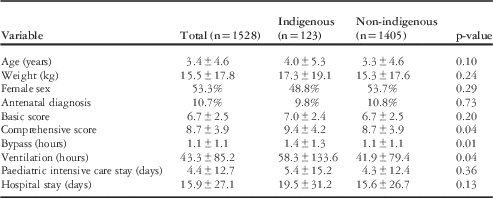
Patients had a mean age of 3.4±4.6 years and mean weight of 15.5±17.8 kg at the time of initial surgery, with no difference according to indigenous status. Assessment of socio-economic status showed a significant disadvantage for indigenous patients (p<0.001), with 52.7% of this group in the lowest third of the socio-economic index (Table 1). The Basic Aristotle Complexity score for the complete surgical cohort was 6.7±2.5 with no difference seen according to indigenous status (p=0.20). The Comprehensive Aristotle Complexity score, however, demonstrated that indigenous patients scored significantly higher (indigenous 9.4±4.2 versus non-indigenous 8.7±3.9; p=0.04). Indigenous patients had longer cardiopulmonary bypass and ventilation times, but no differences were seen in the length of intensive care and hospital admission (Table 2). There was no significant difference in the 30-day mortality according to indigenous status (indigenous 3.2% versus non-indigenous 1.4%; odds ratio=2.3; 95% CI: 0.8, 6.9; p=0.13). Further, this non-significant trend was attenuated in the multivariable logistic regression including Comprehensive Aristotle Complexity scores, bypass time, and ventilation time (odds ratio=1.4; 95% CI: 0.4, 4.6; p=0.54).
Socio-economic index of the study population.

χ2(2)=44.59; p<0.001
Patient demographics and cardiac surgical measures at time of surgery (all variables presented as mean±SD).

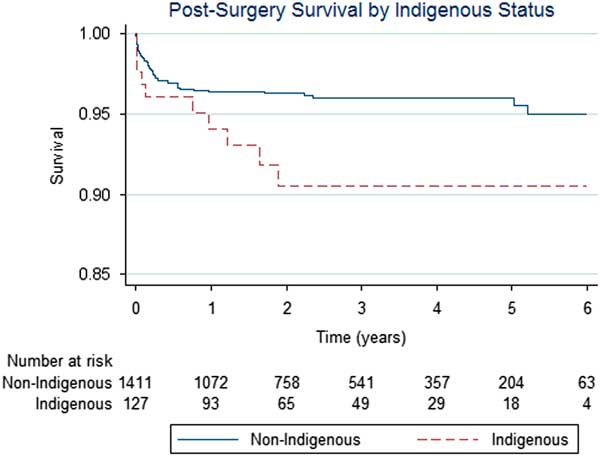
The 6-year survival for the entire patient cohort was 95.9%. A Cox survival analysis demonstrated that mortality in indigenous children who had undergone cardiac surgery significantly increased when compared with non-indigenous children (HR=2.1; 95% CI: 1.1, 4.2; p=0.03) (Fig 1).
Kaplan–Meier curves of years until death after surgery compared between non-indigenous (blue) and indigenous (red) groups [log-rank test: χ2 (1)=4.96; p=0.026]. The numbers under the curves represent the number at risk at the beginning of each year of follow-up.

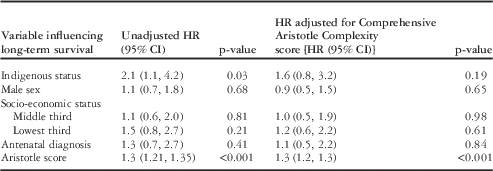
In a multivariable model incorporating indigenous status and Comprehensive Aristotle Complexity score, the effect of indigenous status decreased and was non-significant. (HR=1.6; 95% CI: 0.8, 3.2; p=0.19) (Table 3).
Surgical survival outcome risk variables, univariably and adjusted for Comprehensive Aristotle Complexity score. The reference group for socio-economic status is the highest third.

HR=hazard ratio
When adjusting for Basic Aristotle score instead of complex Aristotle score in the multivariable model, the HR for indigenous status was borderline significant (HR=2.0; 95% CI: 1.0, 4.0; p=0.053)
In all non-indigenous patients, residual disease was the cause of late mortality: primarily cardiac in 15 patients (68%); combined cardiac, respiratory, and neurological pathology in three patients; and severe chronic respiratory disease with no residual cardiac pathology in four patients. Only one indigenous patient who underwent good surgical repair died acutely from a respiratory infection, with late mortality in the other five indigenous patients due to primary cardiac disease. A significant incidence of high-risk behaviours (n=9, 7.3%) was identified during follow-up in the indigenous population, including poor compliance with medications (n=5, 4.1%), substance abuse (n=2, 1.6%), and unplanned pregnancy (n=2, 1.6%).
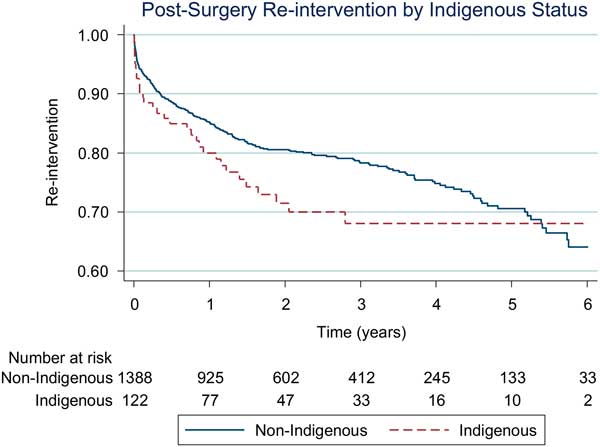
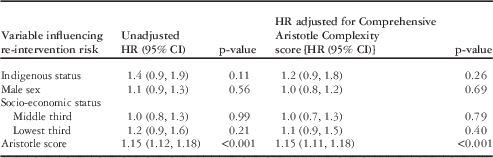
Freedom from surgical re-intervention in all surviving patients at the 6-year follow-up was 79.0%. The re-intervention rate did not differ significantly according to indigenous status (HR=1.4; 95% CI: 0.9, 1.9; p=0.11) (Fig 2). Similarly, no difference in re-intervention rates according to indigenous status were seen after adjusting for complexity and associated co-morbidities (HR=1.2; 95% CI: 0.9, 1.8; p=0.26) (Table 4).
Kaplan–Meier curves of years until surgical re-intervention compared between non-indigenous (blue) and indigenous (red) groups [log-rank test: χ2 (1)=2.64; p=0.104]. The numbers under the curves represent the numbers at risk at the beginning of each year of follow-up.

Surgical re-intervention risk variables, univariably and adjusted for Comprehensive Aristotle Complexity score. The reference group for socio-economic status is the highest third.

HR=hazard ratio
When adjusting for Basic Aristotle score instead of complex Aristotle score in the multivariable model, the HR for indigenous status remained non-significant (HR=1.3; 95% CI: 0.9, 1.9; p=0.211)
When we re-ran the analysis replacing the Comprehensive Aristotle Complexity score with the Basic Aristotle score, the HR for indigenous status was borderline for surgical survival (HR=2.0; 95% CI: 1.0, 4.0; p=0.053). Finally, we found that indigenous status was not associated with either death (HR=1.2; 95% CI: 0.6, 2.8; p=0.588) or re-intervention (HR=1.1; 95% CI: 0.6, 1.7; p=0.812) in the matched sample (for a description of the results and balance diagnostics of the matched sample see the Supplementary material).
Rheumatic carditis
In the indigenous group, 11 (8.9%) operations were related to rheumatic carditis. Among all, two patients required aortic valve replacement, seven underwent primary mitral valve repair, with three of them requiring later replacement, and four patients required mitral valve replacement at initial surgery. All patients who required surgery for complications related to rheumatic carditis were clinically well at the last follow-up. None of the patients underwent surgery for conditions related to rheumatic carditis in the non-indigenous cohort.
Discussion
The 6-year survival rate of 95.9% and freedom from re-intervention rate of 79.0% reported for the total population in this study demonstrate paediatric cardiac surgical outcomes comparable with other series in the current era.Reference Erikssen, Liestol and Seem 1 , Reference Raissadati, Nieminen, Jokinen and Sairanen 2 This study demonstrated that, although both groups of children had the same 30-day survival, the mortality for indigenous children at 6 years of follow-up was 2.1 times greater than that for the non-indigenous population before accounting for case complexity. Adjusting this analysis for either procedure-dependent factors such as basic score or procedure-dependent and independent factors such as comprehensive score at the time of surgery led to an attenuation of this increased risk seen in the indigenous population. It is reasonable to postulate that independent risk factors are likely to persist when the child returns to his or her home environment, with possible adverse impact on long-term outcomes. Finally, two additional analyses indicated that the relationships between indigenous status and the study end points were not independent of complexity.
Large, multi-institutional, North American studies have identified that ethnic disparities for in-hospital surgical mortality associated with CHD are seen, and persist after adjustment for complexity of surgical procedure. Accepting that our study population is smaller, these differences in early survival between different ethnic groups with important differences in socio-economic status were not seen in this clinical cohort derived from a single institution. Comparable Basic Aristotle Complexity scores suggest that the complexity of congenital surgery was similar in both groups; however, indigenous children undergoing surgery had a higher Comprehensive Aristotle Complexity score, demonstrating that this group had a substantially higher incidence of associated co-morbidities at the time of surgery and came from more adverse environments. The fact that this high-risk group had similar rates for survival to discharge suggests that modern high-quality surgery and perioperative care can mitigate this early risk, even with associated longer cardiopulmonary bypass and ventilation times.
Increased late mortality occurred in indigenous children, with no difference in surgical re-intervention rates and universally high compliance with cardiac medical follow-up. This demonstrates no disadvantage to the at-risk population as a consequence of reduced access to specialist care following the initial surgical repair. The treated indigenous patients were shown to be from families with significantly lower socio-economic status than the remaining study population. This and the increased attenuation in the HR for indigenous status when adjusting for the Comprehensive Aristotle Complexity scores over the Basic scores suggest that socio-economic status may be responsible for the apparent increased risk among indigenous patients in the unadjusted analysis.
Lower socio-economic status is associated with poor, long-term health outcomes. These disparities are not explained by differences in healthcare delivery measures such as access to care, healthcare utilisation, and quality of care.Reference Oster, Strickland and Mahle 3 , Reference Atler 18 , Reference Dalen, Ivert, Holzmann and Sartipy 19 Achieving compliant cardiac follow-up of 93.8% in the indigenous population, 73% of whom lived outside the capital city, would support these findings. Consequently, a focus on preventive or social health policies, in the setting of an effective tertiary paediatric cardiac surgical service providing outreach services to regional cities and small indigenous communities, may positively influence these outcomes.Reference Atler 18 – Reference Reeve, Humphreys, Wakerman, Carter, Carroll and Reeve 20 Evidence is emerging that, although the cost of providing primary health care in remote regions is high, a more equitable distribution of funding, considering the higher costs of tertiary hospital care, may improve health outcomes for disadvantaged groups.Reference Reeve, Humphreys, Wakerman, Carter, Carroll and Reeve 20 , Reference Zhao, Thomas, Guthridge and Wakerman 21
Although difficult to quantify, adverse environmental exposures in early life such as sub-standard housing, poor water quality, physical injury, diarrhoeal and other infectious illnesses, smoking, and intrauterine growth retardation add to the burden of disease in disadvantaged populations.Reference Sly, Moore and Gore 22 The high Comprehensive Aristotle Complexity score seen in the indigenous group suggests that social and environmental factors are likely to have influenced their outcomes. No negative impact was seen in survival to discharge; however, some factors measured in the Comprehensive Aristotle Complexity score may have long-term implications and contribute to increased long-term mortality in indigenous patients, which became non-significant when survival was adjusted for these risk factors. Addressing health environmental issues and high-risk behaviours is likely to be another factor in improving long-term survival for this at-risk group with congenital cardiac disease.
Surgery performed on indigenous children represented 8.6% of this surgical cohort, with a prevalence that did not differ significantly from the rest of the population. Although surgical interventions associated with more serious disease, rather than complete disease burden, are measured, this information does vary from previous studies, where a higher prevalence of CHD in the indigenous population has been reported.
Rheumatic carditis
The incidence of rheumatic fever in the indigenous population is 53 per 100,000, with an incidence of over 100 per 100,000 in 5–14-year-old children. It is rarely seen in the non-indigenous population (0.2 per 100,000). 23 This is a significant burden of disease, and as a consequence of deficiencies in primary healthcare these children may present with significant carditis and valve disease. These patients represented 8.6% of the indigenous surgical cohort. In our population, severe mitral regurgitation was the most predominant lesion, and our primary treatment was surgical repair. At the end of this study, however, only 36% of children were functioning with a successful repair. The other patients required mechanical mitral valve replacement and warfarin therapy. No mortality has been observed in this subgroup of patients. This can be attributed to a separate, highly developed, statewide programme that interacts with local communities and monitors secondary rheumatic carditis prevention and anticoagulation, thus minimising risks associated with poor compliance.
Study strengths and limitations
This study did not specifically seek to measure primary referral and access of non-indigenous and indigenous patients to paediatric cardiology and cardiac surgery services. Consequently, referral bias cannot be excluded. The electronic health record, with prospective data collection, ensured that a complete data set was available for analysis. The high complete follow-up rate, achieved in both patient groups, has ensured that study outcomes from time of surgery should be unbiased; however, the indigenous cohort represented a small proportion of the total population, potentially limiting the statistical power of some of the findings, when compared with large, population-based studies.
Conclusion
No measurable difference was observed in the level of cardiac and cardiac surgical care available to indigenous and non-indigenous children with CHD. Both groups had similar levels of disease complexity – that is, basic scores – and no differences were seen in survival to discharge or access to long-term cardiac follow-up; however, indigenous patients had a significantly poorer long-term survival. After adjustment for variables measured in the Comprehensive Aristotle Complexity score, this increased mortality risk did not persist. Further investigation is required to determine the factors driving this association. These are likely to include cardiac morbidity and the poor health outcomes associated with social disadvantage, environmental risk, and inadequate access to primary health care. This information will help inform the development of healthcare strategies to improve the long-term survival of indigenous children undergoing surgery for CHD.
Acknowledgements
Kim Betts (University of Queensland, Australia) provided statistical guidance and advice for manuscript revision.
Financial Support
This research received no specific grant from any funding agency or from commercial or not-for-profit sectors.
Conflicts of Interest
None.
Ethical Standards
This study was approved by the Mater Health Services Human Research Ethics Committee (reference no. 14/MHS/76).
Supplementary material
To view supplementary material for this article, please visit https://doi.org/10.1017/S1047951117000993