Introduction
The genetic code is conserved among organisms, but the direction of the codon bias arising from unequal usage of codons always shifts between different organisms (Hershberg & Petrov, Reference Hershberg and Petrov2008). The combination of any three of the four bases (A, G, C and T) encodes each of the 20 amino acids. It is known that the 20 standard amino acids are encoded by 61 codons of the genetic code. Each amino acid can be encoded by at least one codon (e.g. Met and Trp); but some amino acids are encoded by up to six codons (e.g. Leu, Ser and Arg), which is due to the degeneracy of the genetic code. The codons that encode the same amino acid are referred to as synonymous codons. Codon usage bias (CUB) refers to the phenomenon whereby synonymous codons are used with unequal frequencies during translation of genes. CUB is a common phenomenon in a variety of organisms, from prokaryotes to eukaryotes (Bulmer, Reference Bulmer1988). Codons that are used more repeatedly are often termed optimal or major codons, and those that are used less frequently are termed non-optimal or minor codons. Usually, these less repeatedly used codons correspond to less abundant tRNAs in the cell than those of optimal codons (Ikemura, Reference Ikemura1981, Reference Ikemura1985; Bulmer, Reference Bulmer1987; Akashi, Reference Akashi2001), and the translational machinery mostly pauses there (Kurland, Reference Kurland1992). Various studies have suggested that synonymous codon usage pattern is species-specific and non-random. CUB varies both within and between genomes, and may play a significant role in our understanding of genome evolution among related species at the molecular level (Sharp & Matassi, Reference Sharp and Matassi1994).
Various factors that may influence codon bias include gene expression, gene length (Gupta & Ghosh, Reference Gupta and Ghosh2001; Hou & Yang, Reference Hou and Yang2001; Jenkins & Holmes, Reference Jenkins and Holmes2003; Gustafsson et al., Reference Gustafsson, Govindarajan and Minshull2004), base compositional mutational bias (Jia & Higgs, Reference Jia and Higgs2008) and natural selection (Kaufmann & Paules, Reference Kaufmann and Paules1996; Knight et al., Reference Knight, Freeland and Landweber2001; Lithwick & Margalit, Reference Lithwick and Margalit2005; Linacre & ToBe, Reference Linacre and ToBe2009; Chen et al., Reference Chen, Gu and Liu2013). Kurland (Reference Kurland1992) proposed that not only is the expression of individual genes increased by the codon usage bias, but also that the cell growth rate is changed under optimal conditions (Fennoy & Bailey-Serres Reference Fennoy and Bailey-Serres1993). Shackelton et al. (Reference Shackelton, Parrish and Holmes2006) found that codon usage bias was correlated with the overall genomic GC content, which indicates that the compositional constraint under mutation pressure, rather than natural selection, was the main factor for specific codons. Naya et al. (Reference Naya, Romero, Carels, Zavala and Musto2001) studied the Chlamydomonas reinhardtii genome, which has a high GC content, and found no evidence that mutation pressure was responsible for determining the codon usage pattern (Shackelton et al., Reference Shackelton, Parrish and Holmes2006). It was also suggested by some researchers that codon usage variation is related to other factors, such as gene function and DNA replication, and selective transcription, protein secondary structure and environmental factors (Akashi, Reference Akashi1997; Powell & Moriyama, Reference Powell and Moriyama1997; Moriyama & Powell, Reference Moriyama and Powell1998).
Analysis of codon usage bias is a well-established technique for understanding the protein-coding sequences of genomes (Kurland, Reference Kurland1992). It also helps in understanding the dynamics of mRNA translation, design of transgenes, new gene discovery, and studies of molecular biology and evolution, etc. While numerous reports on synonymous codon usage bias have focused on nuclear genomes of other worms, no work has been reported on the nuclear genes of two medically important species: Wuchereria bancrofti and Schistosoma haematobium. In this context, one of the major objectives of this work was to understand the patterns of codon usage among the sequenced genes of W. bancrofti and S. haematobium. Wuchereria bancrofti is a parasitic roundworm in humans and the major cause of lymphatic filariasis, which affects 128 million people worldwide (Melrose, Reference Melrose2002). If it is left untreated, then the swelling and decreased flow of the lymph fluid will lead to lymphatic system infections and, over time, a condition called elephantiasis (permanent swelling of a limb) is reached. Humans are the host for W. bancrofti and they act as vectors (Bockarie et al., Reference Bockarie, Taylor and Gyapong2009; Manguin et al., Reference Manguin, Bangs, Pothikasikorn and Chareonviriyaphap2010). The drug diethylcarbamazine (DEC) is used to kill the microfilaria and some of the adult worms, but it is no longer approved by the US Food and Drug Administration (FDA), because of its side-effects, such as dizziness, nausea, fever, headache, or pain in muscles or joints. A combination of both albendazole and ivermectin, or albendazole and diethylcarbamazine, is considered to be effective in eliminating microfilaria (Eberhard et al., Reference Eberhard, Hightower, Addiss and Lammie1997). On the other hand, S. haematobium, which is found in some areas of the Middle East, is one of the main causes of urogenital schistosomiasis (Kumar et al., Reference Kumar, Abbas, Fausto and Aster2010), which is caused by blood flukes (trematode worms) of the genus Schistosoma (Kumar et al., Reference Kumar, Abbas, Fausto and Aster2010). It is endemic in around 78 countries. The common sign of urogenital schistosomiasis is haematuria (blood in the urine), in children it can cause anaemia. For the control of this disease, treatment with praziquantel is suggested by the World Health Organization (Cioli & Pica-Mattoccia, Reference Cioli and Pica-Mattoccia2003).
These two medically important worm species pose a serious threat to humans. The information on the synonymous codon usage patterns of W. bancrofti and S. haematobium is either scanty or unavailable. In this study, we investigated the codon usage profile of W. bancrofti and S. haematobium using a multivariate statistical analysis. Our results provide useful insights into the patterns of codon usage bias that facilitate better understanding of the structure and evolution of gene coding sequences of these species.
Materials and methods
Sequence collection
Coding DNA sequences (CDS) of W. bancrofti and S. haematobium were retrieved from GenBank (http://www.ncbi.nlm.nih.gov) using accession numbers. In these sequences, we only chose the CDS without anonymous bases. To minimize sampling errors, genes with incorrect initiation and termination codons or with internal termination codons were avoided. Finally, 121 CDS of W. bancrofti and 24 CDS of S. haematobium were left for analysis, and each corresponded to a unique gene in W. bancrofti and S. haematobium, respectively. The genes of W. bancrofti and S. haematobium are shown in supplementary tables S1 and S2, repectively.
Estimation of DNA compositional properties
Using an in-house Perl program, nucleotide compositions (A%, T%, G% and C%), nucleotide composition at the third position (A3%, T3%, G3% and C3%), and overall GC contents, GC1 (P1), GC2 (P2), GC3 (P3), AT1, AT2 and AT3 were estimated.
The mutations that usually take place in the third position are mostly synonymous, whereas the mutations occurring in the first or the second positions are relatively small and known as non-synonymous mutations. This indicates that when there is no external pressure, mutations should occur in a random rather than in a specific direction. This will result in uniform base composition at three positions of codons. However, in the presence of selective pressure, preference for a particular base would occur in three different positions (Sueoka, Reference Sueoka1988). In the neutrality plot, P12 has been used as the ordinate and P3 as abscissa. Each dot represents an independent gene. If all the points of the neutrality plot show narrow GC3 distribution, it indicates low mutation bias or high conservation of GC content throughout the whole genome. On the other hand, if the curve of the neutrality plot tends to be sloped or parallel to the horizontal axis, it indicates that the difference between P12 and P3 is very low. When selection pressure plays a major role in evolution, the neutrality plot is used to measure the degree of neutrality (Sueoka, Reference Sueoka1988, Reference Sueoka1999).
Relative synonymous codon usage (RSCU)
The relative synonymous codon usage (RSCU) is the number of times a codon appears in a gene divided by the number of expected occurrences under equal codon usage. If the synonymous codons of an amino acid are used with equal frequencies, their RSCU values will equal 1 (Sharp et al., Reference Sharp, Tuohy and Mosurski1986). It is calculated as:
 $$\begin{eqnarray} RSCU_{ij} = \frac { X _{ ij }}{\frac {1}{ ni }{ \sum _{ j = 1}^{ ni } }\, X _{ ij }} \end{eqnarray}$$
where X ij is the observed number of the ‘ith’ codon for the ‘jth’ amino acid, ‘ni’ is the total number of synonymous codons that encode the ‘jth’ amino acid.
Correspondence analysis (CA) has been widely used to investigate the variation of codon usage among genes. CA is a multivariate statistical method in which the codon usage of 59 codons is plotted in a multidimensional space of 59 axes, and then the CA recognizes the axes that represent the most important factors contributing to codon usage variation among genes (Liu et al., Reference Liu, Feng, Zhao, Dong and Xue2004; Wang & Hickey, Reference Wang and Hickey2007).
Effective number of codons (ENC)
The effective number of codons (ENC) quantifies how far the codon usage of a gene departs from equal usage of synonymous codons. ENC values range from 20 (the number of amino acids), which means that the bias is at a maximum, and only one codon is used from each synonymous-codon group, to 61 (the number of sense codons), which indicates no codon-usage bias. A low ENC value means high codon usage bias, and a high ENC value means low codon bias. ENC is measured as:
 $$\begin{eqnarray} ENC = 2 + S + 29/ S ^{2} + (1 - S ^{2}) \end{eqnarray}$$
where S represents the given (G+C)3% value (Wright, Reference Wright1990).
Codon adaptation index (CAI)
In recognition of the role of selection in producing high codon bias, a parameter called the codon adaptation index (CAI) is calculated. The CAI measures the degree with which genes use the preferred codons. CAI values range from 0 to 1. A high CAI value indicates a higher percentage of the most abundant codons (Sharp et al., Reference Sharp, Cowe and Higgins1988). It is calculated as:
 $$\begin{eqnarray} CAI = exp\left (\frac {1}{ L }{ \sum _{ k = 1}^{ L } }\,ln\, \omega k \right ) \end{eqnarray}$$
where ωk is the relative adaptiveness of the kth codon, and L is the number of synonymous codons in the gene. CAI is also a widely accepted measure of gene expression.
Data analysis
Correlation and regression analyses were performed to identify the relationship between the overall nucleotide compositions and the nucleotide compositions at third codon position. All the statistical analyses were done using the SPSS software (SPSS Inc., Chicago, Illinois, USA).
Results
Compositional properties
Codon bias, or choice of one type of codon over another, can be influenced by the overall nucleotide composition of genomes (Jenkins & Holmes, Reference Jenkins and Holmes2003). Therefore, we first analysed the nucleotide composition of coding sequences from different nuclear genes of W. bancrofti and S. haematobium. The overall nucleotide composition and nucleotide composition at the third codon position of W. bancrofti and S. haematobium coding sequences are shown in supplementary tables S3 and S4, respectively. In both the species W. bancrofti and S. haematobium, unequal distribution of overall A, T, G, C and their composition at the third codon position confirmed that the compositional constraint influences the codon usage pattern.
Linear regression analysis was performed between an observed value of ENC and base composition of third codon position (Wobble codon position). In W. bancrofti, the observed coefficients of regression analysis between ENC and A3 was 0.469; ENC and T3, 0.356; ENC and G3, 0.357; and ENC and C3, 0.479; while in S. haematobium, between ENC and A3 it was 0.704; ENC and T3, 0.558; ENC and G3, 0.795; and ENC and C3, 0.838. These results showed that the effective number of codons (ENC) was negatively affected by A3, T3, G3 and C3, since all the observed values are positive in both species.
Codon usage in W. bancrofti and S. haematobium
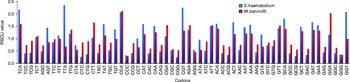
In W. bancrofti, the overall GC content had a mean value of 43.41%, and in S. haematobium it was 36.37%, which suggest that genes in both the species were AT rich. The GC content in the first and third codon position in W. bancrofti was 51.06 and 39.08%, respectively, while in S. haematobium, it was 46.57 and 26.50%, respectively. The overall GC(%), GC1(%), GC2(%), GC3(%) and ENC values of genes of W. bancrofti and S. haematobium are shown in supplementary tables S5 and S6, respectively. The mean ENC value was 56.24 in W. bancrofti but 49.29 in S. haematobium. Thus it can be stated that W. bancrofti had a weak codon bias, but S. haematobium had a moderate codon bias; this was also supported by the RSCU values in both the species, in which almost half of the codons were frequently used. In S. haematobium, 29 codons were used more frequently, but in W. bancrofti, 23 codons were used more frequently (fig. 1). Among these, the codons that end with T at the third position in both the species were CAT, CGT, ATT, AAT, ACT, GTT and GAT. The codons ending with A were CAA, CGA, AGA, ACA, AAA, GCA, GAA and GGA. In W. bancrofti, other frequently used codons were TCA, TCT, TTT, TTG, CTT, TAT, CCA, AAT and GCT and in S. haematobium, these codons were CCT, GTA. The comparisons of RSCU values in both the species are shown in fig. 1. This indicates that the codon usage pattern in these two species is mostly contributed by compositional constraints, and the pattern of codon usage is different in the two species.
Comparison of relative synonymous codon usage values in Wuchereria bancrofti and Schistosoma haematobium.

Effects of nucleotide composition in shaping codon bias
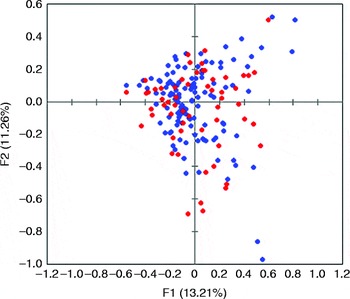
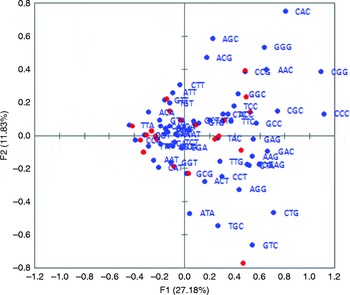
Correspondence analysis was carried out for the nuclear genes in two species, W. bancrofti and S. haematobium. The first axis was found to account for 13.21% of the total observed variance while axis 2 contributed to 11.26% of the variance in W. bancrofti; these values were 27.18% and 11.83%, respectively, in S. haematobium (figs 2 and 3).
Construction analysis of nuclear genes for Wuchereria bancrofti.

Construction analysis of nuclear genes for Schistosoma haematobium.

The patterns of the scattering observed in the two species were distinctly non-identical, indicating a variation in the overall codon usage pattern in these two species. In both the species, it was found that AT-ending codons were more frequent near the origin, while GC-ending codons lie further away, suggesting that compositional constraints under mutational pressure might have played a part in shaping the codon usage pattern in these species. Furthermore, some of the genes were in a discrete distribution, indicating that other factors exist in shaping the codon usage bias, for example, natural selection (Wei et al., Reference Wei, He, Jia, Qi and Liang2014).
Effects of gene expression level
To detect the effects of gene expression level on codon bias, correlation coefficients were estimated among the CAI (codon adaptation index), ENC (effective number of codons) and nucleotide composition. In W. bancrofti, the CAI showed a negative correlation with G3 (r= − 0.188*), C3 (r= − 0.101), GC (r= − 0.247**), GC1 (r= − 0.097), GC2 (r= − 0.111), GC3 (r= − 0.184*), Aromo (r= − 0.058) and Gravy (r= –0.164), whereas it showed a positive correlation with gene length (r= 0.644**), A3 (r= 0.075), T3 (r= 0.203*) and ENC (r= 0.010) (supplementary table S7).
In S. haematobium, the CAI showed a negative correlation with A3 (r= − 0.119), G3 (r= − 0.208), C3 (r= − 0.185), GC3 (r= − 0.216) and ENC (r= − 0.226), but a positive correlation with gene length (r= 0.700**), T3 (r= 0.523**), GC (r= 0.091), GC1 (r= 0.211), GC2 (r= 0.416*), Gravy (r= 0.217) and Aromo (r= 0.104) (supplementary table S8). These results suggest that, in these species, the nucleotide composition and the gene expression levels contribute to the codon usage bias (Jia et al., Reference Jia, Liu, Zheng, Li and Qi2015). In W. bancrofti, a positive correlation was found between CAI and ENC, which indicates that the gene expression level increases with decrease in codon usage bias, while in S. haematobium, the negative correlation between CAI and ENC suggests the gene expression level increases with increase in the codon usage bias.
Mutational pressure influences the codon bias
Here, a set of indices including overall A, T, G, C and G+C content and the contents of bases in the third position (A3, T3, G3, C3 and GC3) were considered as the indices of mutational pressure (Chen, Reference Chen2013). The axis 1 and axis 2 values were correlated with nucleotide count at first and third positions. In W. bancrofti, significant correlation had been found among the axis 1 values and A, T, C, A3, T3, G3, GC, GC1 and GC3, while axis 2 values had shown significant correlation with G, C, A3, T3, G3, GC2 and GC3 (table 1). Also, in S. haematobium, a significant correlation was found among the axis 1 values and A, T, G, C, A3, T3, G3, C3, GC and GC3 (table 2). Thus the nucleotides A, T, C, GC, T3, C3 and GC3 were found to play a major role in determining the pattern of synonymous codon usage bias. These results suggest that compositional constraints under mutation pressure might play an important role in synonymous codon usage pattern in both the species, which strongly supports the findings of Butt et al. (Reference Butt, Nasrullah and Tong2014).
Correlation between axes of correspondence analysis and compositional constraints in W. bancrofti.

*P < 0.05, **P < 0.01.
Correlation between axes of correspondence analysis and compositional constraints in S. haematobium.

*P < 0.05, **P < 0.01.
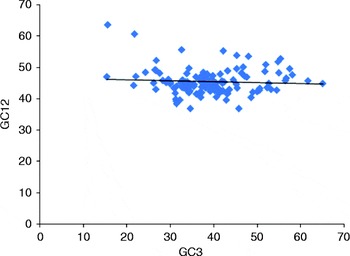
Furthermore, in W. bancrofti, the neutrality plot showed that the genes had a wide range of GC3 value distributions, ranging from 15.5 to 65.1% (fig. 4). There was a negative correlation between GC12 and GC3 ( − 0.063, P < 0.01), suggesting that the effect of mutational pressure was present at all codon positions. But the effect of mutational pressure could be small, as revealed by the low magnitude of the correlation coefficient ( − 0.063). The linear regression model of GC12 on GC3 is GC12 = 0.029GC3+46.75, with R 2= 0.004. This suggests that only 0.4% of the GC12 variance comes from GC3, and hence GC3 content is not likely to be the major determinant of GC12 variance in W. bancrofti coding sequences.
Neutrality analysis of GC12 and GC3 for the coding sequence of Wuchereria bancrofti. GC12 is the average value of GC content in the first and second positions of the codons (GC1 and GC2) while GC3 refers to the GC content in the third position (Y= − 0.029x+46.75, R 2= 0.004).

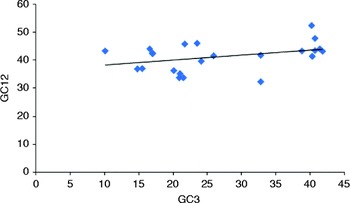
In S. haematobium, the neutrality plot analysis showed that the genes had a wide range of GC3 value distributions, ranging from 10.1 to 41.4% (fig. 5). A positive correlation between GC12 and GC3 (r= 0.373, P < 0.01) was observed and this indicates that the effect of mutational pressure was present at all codon positions. The linear regression model of GC12 = 0.173GC3+36.68 with R 2= 0.139 suggests that only 13.9% of the GC12 variance could be explained by GC3 in this organism. It reveals that other factors, apart from GC3, could play a role in determining the GC12 variance in S. haematobium coding sequences.
Neutrality analysis of GC12 and GC3 for the coding sequences of Schistosoma haematobium (Y= 0.173x+36.68, R 2= 0.139).

Natural selection affects the codon usage pattern
It has been suggested that if synonymous codon usage pattern is influenced by mutational pressure only, then the frequency of nucleotides A and T should be equal to that of C and G at the third position of codons (Zhang et al., Reference Zhang, Dai and Dai2013a). However, in the case of W. bancrofti and S. haematobium genes, AT and GC were not equal in the third position of codons (supplementary tables S3 and S4), indicating that natural selection could also influence overall synonymous codon usage bias.
It is not enough to distinguish the main determinant factor between natural selection and mutational pressure within a species using the ENC plot, so a neutrality plot was implemented here. In W. bancrofti, the slope of the regression line of the entire coding sequence was 0.029 (fig. 4). The results revealed that the effect of mutation pressure was only 2.9% (absolute value), while the magnitude of natural selection was 97.1% (Sueoka, Reference Sueoka1988). In S. haematobium, the slope of the regression line of the entire coding sequence was 0.173 (fig. 5). The results revealed that the effect of mutational pressure was only 17.3%, while the natural selection was 82.7%. Hence, it is evident that natural selection played a major role in shaping the codon bias, whereas mutational pressure probably had a minor role.
Correlation between codon usage and skewness
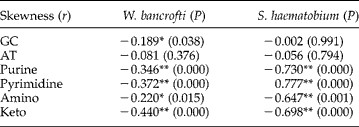
The GC skews, AT skews, purine skews, pyrimidine skews, amino skews and keto skews in both the species W. bancrofti and S. haematobium were all negative, except that of pyrimidine skew in S. haematobium, as shown in Table 3. Base composition is connected to the transcription process, which is exposed from skewness. In W. bancrofti, significant correlation of ENC had been found with GC skew ( − 0.189*), purine skew ( − 0.346**), pyrimidine skew (−0.372**), amino skew ( − 0.220*) and keto skew ( − 0.440**), respectively. Therefore in W. bancrofti GC skew, purine skew, pyrimidine skew, amino skew and keto skew significantly affected the codon usage. In S. haematobium, ENC showed significant correlation with purine skew ( − 0.730**), pyrimidine skew (0.777**), amino skew ( − 0.647**) and keto skew ( − 0.698**). This suggests that in S. haematobium, the purine skew, pyrimidine skew, amino skew and keto skew played a significant role in codon usage bias.
Correlation between effective number of codons (ENC) and types of skewness.

*P < 0.05, **P < 0.01.
Discussion
In living organisms, synonymous codons are used with different frequencies and this phenomenon is known as codon bias. CUB is an important evolutionary relic that exists in an extensive variety of organisms, from prokaryotes to eukaryotes (Yang et al., Reference Yang, Luo and Cai2014). Various hypotheses are proposed to explain the origin of codon usage bias, out of which neutral theory and the selection–mutation–drift balance model are the most accepted ones (Yang et al., Reference Yang, Luo and Cai2014). The study of the pattern of codon usage has gained the attention of researchers since the beginning of whole-genome sequencing of many organisms (Plotkin & Kudla, Reference Plotkin and Kudla2011). Our investigation highlighted the comparative analysis of codon usage of nuclear genes in two parasitic species, W. bancrofti and S. haematobium, which are considered to be medically important.
Compositional constraint could be one of the most essential factors in shaping the pattern of codon usage among genes and genomes. Here we analysed the synonymous codon usage bias in these two species, and found that the most frequent codons end with A and T in both the species. This finding might be the result of compositional constraint that occurred in codon usage pattern in these species. A previous study on five nematode species also revealed the preponderance of AT base pairs over GC base pairs, as well as the predominance of A/T-ending codons over G/C-ending codons in coding sequences (Fadiel et al., Reference Fadiel, Lithwick, Wanas and Cuticchia2001). Also the more frequently used codons end with A/T; this is supported by the AT-rich genome of the parasite Plasmodium falciparum (Peixoto et al., Reference Peixoto, Fernandez and Musto2004).
Correspondence analysis of the nuclear genes of both the species W. bancrofti and S. haematobium found that AT-ending codons lie near the axes whereas the GC-ending codons lie further away from the origin, which suggests that compositional constraints along with mutational pressure might be playing a significant role in shaping the codon usage pattern. This was also suggested by Wei et al. (Reference Wei, He, Jia, Qi and Liang2014), who found that, in the mitochondrial genome of Bombyx mori, the AT-ending codons were lying closer to Axis 1, which indicates that the mutational pressure might be correlated with the codon usage bias, and that lower GC-content genes were located closer to Axis 1, which again implies that GC content in mutational pressure probably influenced the bias (Wei et al., Reference Wei, He, Jia, Qi and Liang2014).
The mean ENC value was 56.24 in W. bancrofti, and 49.29 in S. haematobium, which indicates that codon usage bias was low in W. bancrofti and S. haematobium. Jia et al. (Reference Jia, Liu, Zheng, Li and Qi2015) also reported weak codon usage bias in the genes of B. mori. Low codon usage bias might be advantageous for efficient replication in different cell types having different preferences of codons (Jenkins & Holmes, Reference Jenkins and Holmes2003).
The regression equations from the neutrality plots in the cases of W. bancrofti and S. haematobium suggest that mutational pressure played a minor role while natural selection played the major role in shaping the codon usage pattern. The neutrality plot for S. haematobium revealed that the effect of mutational pressure was only 17.3%, while that of natural selection was 82.7%, thus, indicating a minor role of mutational bias but major role of natural selection in shaping the codon usage bias. Jia et al. (Reference Jia, Liu, Zheng, Li and Qi2015) implemented a neutrality plot in B. mori and found a significant positive correlation between GC12 and GC3, which suggested that the effect of mutation pressure was present. They also found that the mutation bias only played a minor role in shaping the codon bias, whereas natural selection probably dominated the codon bias (Jia et al., Reference Jia, Liu, Zheng, Li and Qi2015).
The frequencies of A and T are not equal to that of G and C at the third position of codons, which suggests that both mutational pressure and the natural selection affect the codon usage pattern, thus supporting the results of Butt et al. (Reference Butt, Nasrullah and Tong2014) and Zhang et al., Reference Zhang, Dai, Wang, Lu and Fa(2013b).
This is the first work on the comparative analysis of the pattern of codon usage in two medically important parasitic species. The codon usage bias was weak and the genes in both species were AT rich. The most frequent codons end with T at the third position, most probably suggesting the role of the compositional constraint under mutation pressure. Both mutation pressure and natural selection are two significant evolutionary factors that affect the codon usage pattern in these species. Apart from this, gene expression level and various compositional skewnesses influence the pattern of codon usage. Natural selection played the major role while mutational pressure played the minor role in shaping the pattern of codon usage. However, further analysis would elucidate the role of any other factor that might be responsible for codon usage bias in these species.
Supplementary material
To view supplementary material for this article, please visit http://dx.doi.org/10.1017/S0022149X16000092
Acknowledgements
We are thankful to Assam University, Silchar, Assam for providing the necessary facilities for this research work. No funding was received from DBT or DST, Government of India for carrying out this research work.