Introduction
In a marked departure from the traditional alloy design strategy, which is based on one principal component to which other alloying elements are added in suitable proportions, high-entropy alloys (HEAs) have been proposed as novel multicomponent (usually greater than five) systems having the constituents in equiatomic or near-equiatomic concentrations [Reference Yeh, Chen, Lin, Gan, Chin, Shun, Tsau and Chang1]. In spite of the evident compositional complexities, the HEAs may yet show simple crystal structures, such as Face Centered Cubic (FCC) (e.g., equiatomic CoCrFeMnNi [Reference Cantor, Chang, Knight and Vincent2]), Body Centered Cubic (BCC), FCC + BCC [Reference Yeh, Chen, Lin, Gan, Chin, Shun, Tsau and Chang1], Hexagonal Close Packed (HCP) solid solution [Reference Zhao, Qiao, Ma, Gao, Yang, Chen and Zhang3], or major HCP phase containing minor unindexed second phases [Reference Takeuchi, Amiya, Wada, Yubuta and Zhang4], due to their high configurational entropy (ΔS conf) [Reference Yeh, Chen, Lin, Gan, Chin, Shun, Tsau and Chang1]. More recently, the definition of HEAs has been expanded to include non-equiatomic and multiphase alloys, so that the advent of HEAs has opened up the massive composition space to develop alloys with novel microstructure and mechanical properties [Reference Zhang, Zuo, Tang, Gao, Dahmen, Liaw and Lu5, Reference Yeh6, Reference Gludovatz, Hohenwarter, Catoor, Chang, George and Ritchie7, Reference Zhang, Zuo, Cheng and Liaw8, Reference Tsai and Yeh9, Reference Miracle, Miller, Senkov, Woodward, Uchic and Tiley10, Reference Shahmir, He, Lu, Kawasaki and Langdon11, Reference Liu, Lu, He, Luan, Wang, Liu, Liu, Chen and Liu12, Reference Pickering and Jones13, Reference Li, Pradeep, Deng, Raabe and Tasan14, Reference Deng, Tasan, Pradeep, Springer, Kostka and Raabe15, Reference Zhang, Mao, Wang, Gludovatz, Zhang, Mao, George, Yu and Ritchie16].
Eutectic high-entropy alloys (EHEAs) are a subclass of HEAs originally proposed as novel materials with high rupture strength and good creep resistance for high-temperature applications [Reference Lu, Dong, Guo, Jiang, Kang, Wang, Wen, Wang, Jie, Cao, Ruan and Li17]. Lu et al. have first observed the formation of eutectic mixture in a nano-lamellar AlCoCrFeNi2.1 alloy containing FCC/L12 and B2 phases [Reference Lu, Dong, Guo, Jiang, Kang, Wang, Wen, Wang, Jie, Cao, Ruan and Li17]. While the as-cast microstructure shows attractive mechanical properties due to the presence of soft FCC and hard B2 phases [Reference Lu, Dong, Guo, Jiang, Kang, Wang, Wen, Wang, Jie, Cao, Ruan and Li17, Reference Lu, Gao, Jiang, Chen, Wang, Jie, Kang, Zhang, Guo, Ruan, Zhao, Cao and Li18], later studies have shown that properties of the EHEA could be remarkably improved using thermo-mechanical processing by cold rolling [Reference Wani, Bhattacharjee, Sheikh, Lu, Chatterjee, Bhattacharjee, Guo and Tsuji19, Reference Wani, Bhattacharjee, Sheikh, Bhattacharjee, Guo and Tsuji20, Reference Wani, Bhattacharjee, Sheikh, Lu, Chatterjee, Guo, Bhattacharjee and Tsuji21, Reference Wani, Bhattacharjee, Sheikh, Clark, Park, Okawa, Guo, Bhattacharjee and Tsuji22] and cryo-rolling [Reference Bhattacharjee, Wani, Sheikh, Clark, Okawa, Guo, Bhattacharjee and Tsuji23]. Consequently, the EHEAs have attracted considerable attention in recent times for developing novel alloys with superior strength–ductility combination.
Meanwhile, thermo-mechanical processing at elevated temperatures can also significantly impact microstructural evolution through phase transformations, dynamic recovery, and dynamic recrystallization [Reference Humphreys and Hatherly24]. In particular, warm deformation carried out below the recrystallization temperature can be effective as a novel thermo-processing route for achieving desired microstructure, texture, and mechanical properties in a wide range of materials. While microstructure, texture, and mechanical properties due to warm deformation have been extensively reported in conventional materials, the understanding concerning the effect of warm deformation on HEAs is rather limited [Reference Wani, Sathiaraj, Ahmed, Reddy and Bhattacharjee25].
In the present work, the effect of thermo-mechanical processing on the microstructure and mechanical properties of the AlCoCrFeNi2.1 EHEA in the warm deformation regime is investigated for the first time. Emphasis here is directed toward understanding the inhomogeneities in microstructure and texture formation. It is envisaged that clarifying these effects in the experimental EHEA should be relevant and useful for other multiphase alloys in general and EHEAs particularly.
Results
Starting material
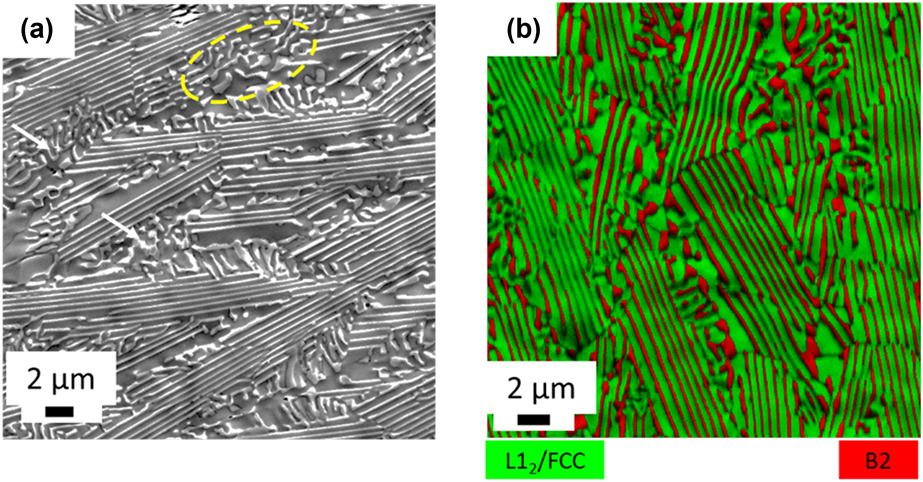
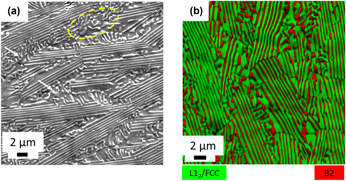
Figure 1 shows the microstructure of the starting as-cast EHEA analyzed by SEM [Fig. 1(a)] and EBSD [Fig. 1(b)]. The SEM micrograph [Fig. 1(a)] clearly reveals the predominantly lamellar eutectic microstructure of the as-cast material. Few isolated regions are shown in Fig. 1(a) (marked by circles), where the lamellar eutectic microstructure appears to be broken down locally. The EBSD phase map [Fig. 1(b)] clearly reveals the lamellar eutectic structure consisting of the FCC (highlighted in green) and B2 (highlighted in red). Previous TEM studies have confirmed that the actual constituents of the eutectic mixture are L12 and B2 [Reference Wani, Bhattacharjee, Sheikh, Lu, Chatterjee, Bhattacharjee, Guo and Tsuji19, Reference Wani, Bhattacharjee, Sheikh, Bhattacharjee, Guo and Tsuji20]. While the B2 phase is enriched in Ni (45 at.%) and Al (24 at.%) but depleted in Cr (6.5 at.%), the L12 phase is depleted in Al (8.60 at.%) but contains almost equal proportions of Co (18.47 at.%), Cr (20.53 at.%), and Fe (19.5 at.%) [Reference Wani, Bhattacharjee, Sheikh, Lu, Chatterjee, Bhattacharjee, Guo and Tsuji19, Reference Wani, Bhattacharjee, Sheikh, Bhattacharjee, Guo and Tsuji20]. In the present case, the average lamellar thicknesses of the L12 and B2 phases in the as-cast EHEA are ∼640 ± 40 nm and 240 ± 15 nm, respectively, while the volume fractions of the L12 and B2 phases are ∼0.65 and 0.35, respectively.
(a) SEM micrograph and (b) EBSD phase map of the as-cast EHEA.

Deformation microstructure and texture
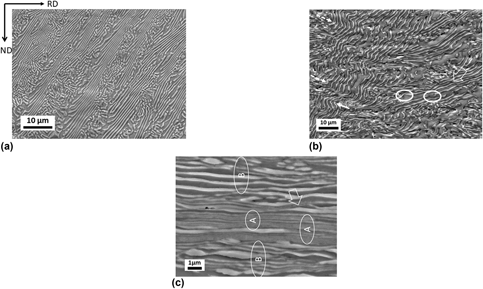
The development of microstructure during severe warm rolling is shown in Fig. 2 by the SEM micrographs obtained from the ND-RD close to the mid-thickness region. After 20% thickness reduction by warm rolling, the lamellar eutectic regions are largely preserved, which are observed coexisting along with the broken eutectic regions [Fig. 2(a)]. The lamellae appear inclined with the RD. After 50% thickness reduction, the microstructure appears remarkably different. The straight lamellae present in the as-cast and 20% warm-rolled EHEAs appear as remarkably bent with both convex (indicated by continuous arrows) or concave (indicated by dotted arrows) shaped morphology. The extent of bending is also quite inhomogeneous, featured by regions with extremely bent lamellae (EBLs indicated by continuous arrows). These EBLs appear to be associated with the formation of the kinks, while locally sheared regions are evidenced by the wavy appearance [indicated by the block arrow in Fig. 2(b)]. The thickness along the length of the lamellae frequently appears rather inhomogeneous and also the continuity of the lamellae is broken (marked by circles). Following 90% reduction in thickness by warm rolling [Fig. 2(c)], the microstructure consists of extended lamellae parallel to the RD. The EBLs are significantly reduced following 90% deformation. The microstructural heterogeneities featured by extremely fine lamellar regions (Region “A”) and comparatively coarser lamellar regions (Region “B”) are easily identified. Shear bands are characterized by their wavy appearance [indicated by the block arrow in Fig. 2(c)]. The average phase boundary (PB) spacing (which is the distance between the PBs along the ND) in the region A is ∼80 nm, while the average PB spacing in the region B is ∼115 nm. Nevertheless, the thickness along the length of these slightly coarser lamellae varies quite significantly.
SEM micrographs obtained from the ND-RD plane of the EHEA warm-rolled to (a) 20%, (b) 50%, and (c) 90% reduction in thickness.

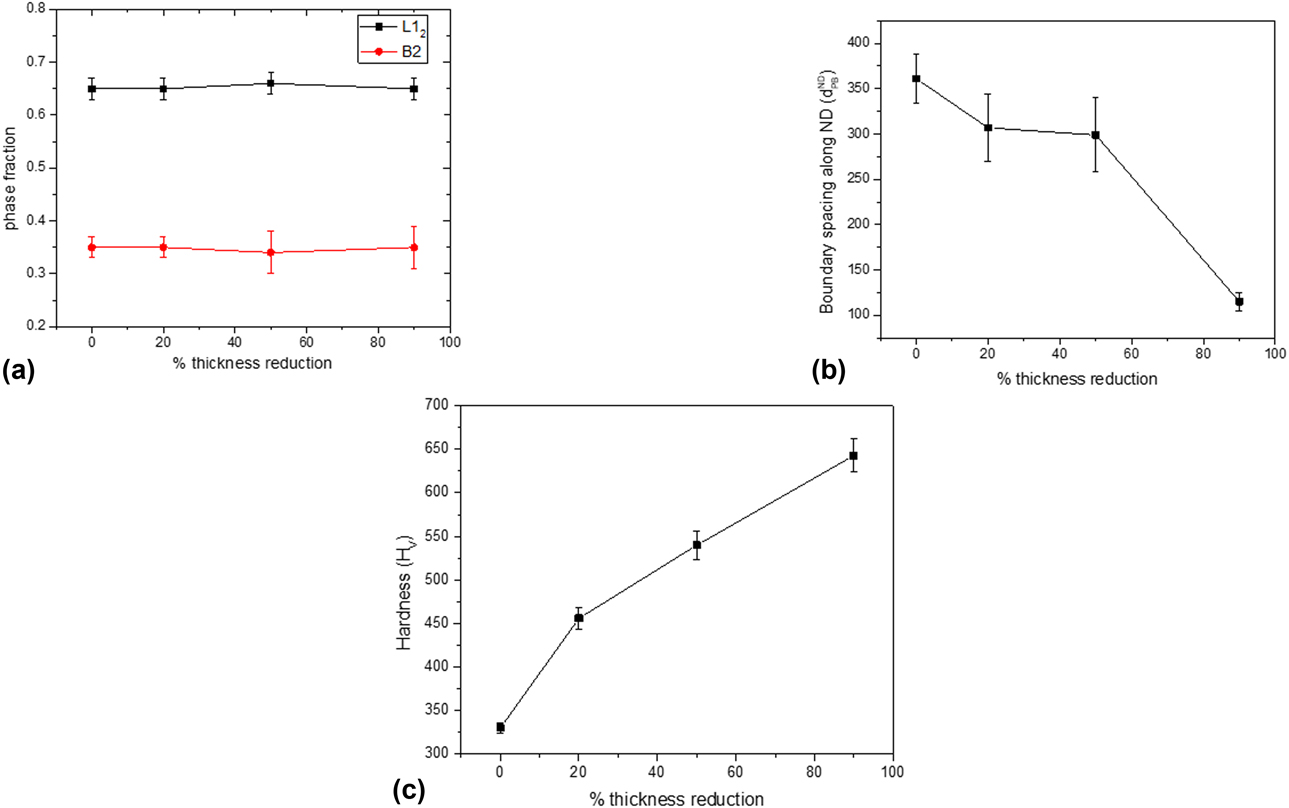
The changes in key microstructural parameters with increasing thickness reduction are shown in Fig. 3. The fractions of the two phases show negligible variations with increasing thickness reduction [Fig. 3(a)]. The variation in the average lamellar PB spacing with increasing thickness reduction is shown in Fig. 3(b), which reveals the extent of microstructural refinement with increasing thickness reduction. The initial PB spacing in the starting material of ∼360 nm (which is obviously having an intermediate value between the average phase band thickness of the L12/FCC and B2 phases) is decreased continuously with increasing thickness reduction. Deformation-induced nanostructure formation is evidenced by the average PB spacing of ∼114 nm (0.114 µm) after 90% thickness reduction. Concomitant with the microstructural refinement, the hardness of the EHEA increases consistently with increasing thickness reduction [Fig. 3(c)]. A remarkably high hardness of ∼650 Hv is obtained in the 90% warm-rolled EHEA contributed by the refinement of the matrix and remarkable decrease in the interlamellar spacing. Although disordering might decrease hardness, it is compensated by the remarkable microstructural refinement due to heavy warm rolling.
Variation in (a) phase fraction, (b) boundary spacing along the ND, and (c) hardness with thickness reduction.

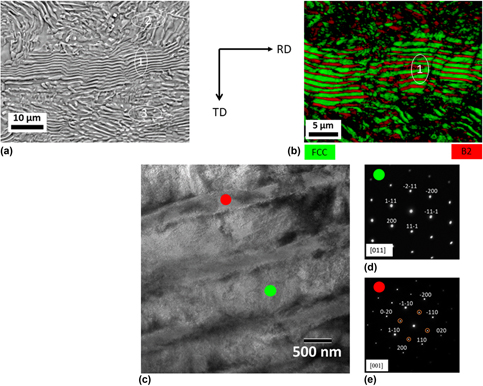
In order to understand the through-thickness microstructural variation, the microstructure of the 90% warm-rolled EHEA is observed along the ND on the surface or rolling plane (RD-TD plane; Fig. 4). The SEM micrograph [Fig. 4(a)] clearly shows the presence of lamellar eutectic region (region “1”) sandwiched between the two rather fragmented regions (region “2” and region “3”). However, the PBs are not parallel as in the case of as-cast EHEA but show bending and curvature. The EBSD phase map [Fig. 4(b)] clearly shows the presence of thick lamellae (marked as region “1”), thus amply corroborating the SEM observations. The average PB spacing in this lamellar zone is ∼400 nm, which is very similar to that in the as-cast EHEA and obviously much higher than the PB spacing measured on the ND-RD. However, the fractions of the FCC and B2 phases are ∼0.62 and 0.38, respectively, which are very similar to the respective volume fractions of the phases measured on the ND-RD. Further microstructural analysis of the lamellae in the 90% warm-rolled material is carried out using TEM [Fig. 4(c)] on RD-TD. The selected area diffraction pattern (SADP) in Fig. 4(d) [obtained from the green circled region in Fig. 4(c)] does not show any superlattice spots, thus indicating a disordered FCC phase (for highlighting this point, the phase is henceforth referred to as L12/FCC). In contrast, the SADP in Fig. 4(e) [obtained from the red circled region in Fig. 4(c)] clearly shows the distinct superlattice spots, thus confirming that the ordered B2 phase is retained even after severe warm rolling.
(a) SEM micrograph, (b) EBSD phase map, and (c) TEM micrograph obtained from the ND-RD plane of the 90% warm-rolled EHEA. (d) and (e) The SADPs obtained from green and red circled regions, respectively, in (c).

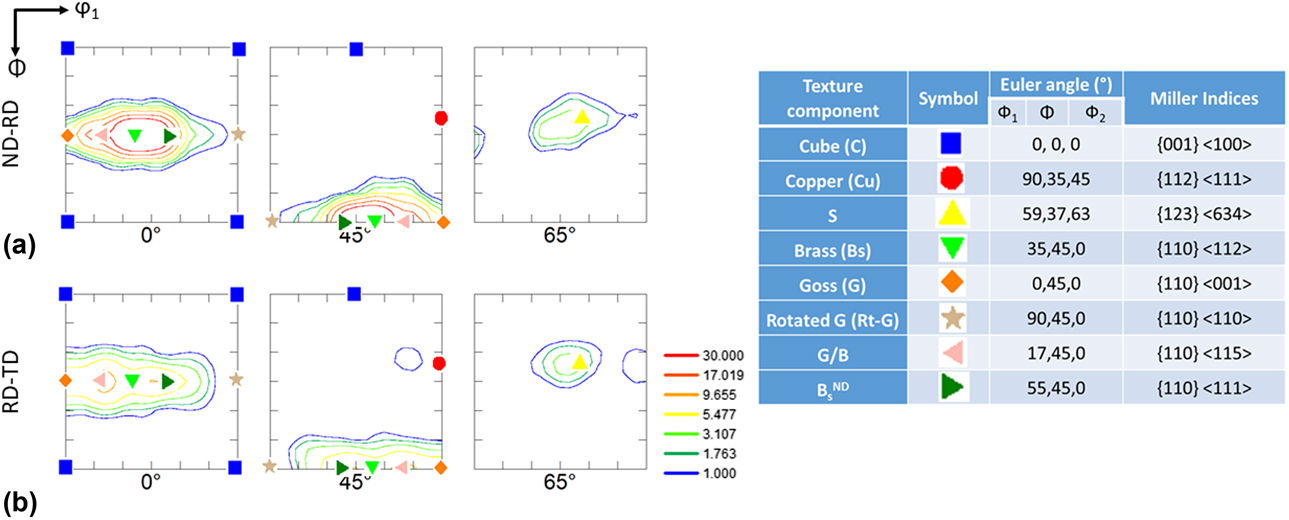
In order to understand the through-thickness texture variation, the relevant ODF sections of the FCC phase in the 90% warm-rolled EHEA constructed from the EBSD data acquired from the ND-RD and RD-TD are compared in Fig. 5. The important deformation texture components are shown overlapped on the ODF sections. The major feature of the texture development in the HEA is the presence of the components lying on the α-fiber (ND//〈011〉) in the φ2 = 0° section running from the Goss (G; {011} 〈100〉) to the rotated Goss (Rt-G; {011}〈110〉) through the brass (BS; {011}〈112〉) component. However, the φ2 = 0° section of the ODF of the ND-RD section shows a strong brass component, while that of the RD-TD sections show intensity maximum at the G/B location along the α-fiber. However, the φ2 = 45° and φ2 = 65° sections of both ND-RD and RD-TD show much weaker Cu and S components as compared with the BS or G/B components. Therefore, the FCC phase develops a rather strong BS-type texture after heavy warm rolling.
The relevant ODF sections (φ2 = 0°, 45°, and 65°) of the L12/FCC phase in the 90% warm-rolled EHEA obtained from the (a) ND-RD and (b) RD-TD planes.

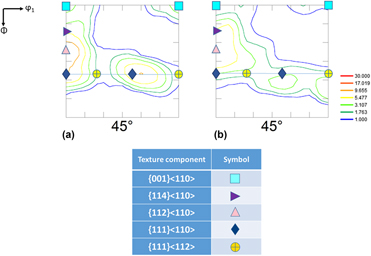
The through-thickness texture variation in the B2 phase in the EHEA is illustrated by comparing the φ2 = 45° section of the ODFs constructed from the EBSD data obtained from the ND-RD [Fig. 6(a)] and RD-TD [Fig. 6(b)]. Both the ODF sections show the development of typical RD (//〈110〉) and ND (//〈111〉) fibers. The φ2 = 45° section of the ODF obtained from ND-RD section shows [Fig. 6(a)] that the intensity peak along the RD fiber is centered on the  $\left( {112} \right)[1\bar{1}0]$ orientation, while the main intensity peaks along the ND fiber is found at the
 $\left( {111} \right)[1\bar{1}0]$. The φ2 = 45° section of the ODF obtained from RD-TD [Fig. 6(b)] shows a spread in intensity from the
 $\left( {114} \right)[1\bar{1}0]$ orientation to
 $\left( {112} \right)[1\bar{1}0]$. The intensities of the contour lines in the two ODF sections further suggest stronger RD-fiber than the ND fiber.
The φ2 = 45° section of the ODF of the B2 phase in the 90% warm-rolled EHEA obtained from the (a) ND-RD and (b) RD-TD planes.

Microstructure and texture during annealing
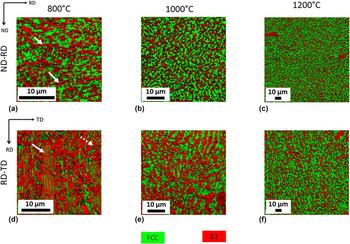
The through-thickness variation in microstructure after annealing is shown by the EBSD phase maps in Fig. 7. The phase map obtained from the ND-RD of the material annealed at 800 °C [Fig. 7(a)] shows the development of a microduplex structure, although some extended phase bands (marked by arrows) could still be observed. In stark contrast, the phase map obtained from the RD-TD of the material annealed at 800 °C [Fig. 7(d)] show a mixed morphology consisting of intact lamellae (indicated by bold arrow) along with some fragmented non-lamellar regions (indicated by dotted arrow). Upon further annealing at 1000 °C, the phase maps obtained from the ND-RD [Fig. 7(b)] shows a rather uniform ultrafine microduplex structure. Meanwhile, the phase map obtained from the RD-TD of the material annealed at 1000 °C [Fig. 7(e)] shows the start of breakdown of the lamellar structure. However, a microduplex structure is evidenced after annealing at 1200 °C throughout the volume of the annealed material on both ND-RD [Fig. 7(c)] and RD-TD [Fig. 7(f)].
The EBSD phases maps obtained from the (a)–(c) ND-RD and (d)–(f) RD-TD sections of the 90% warm-rolled EHEA annealed at (a) and (d) 800 °C, (b) and (e) 1000 °C, and (c) and (f) 1200 °C.

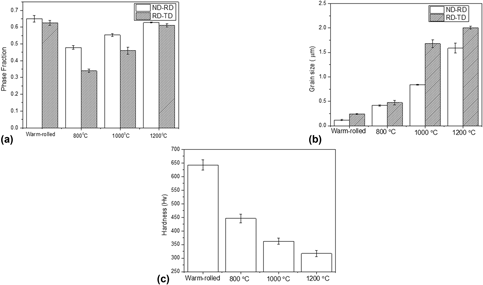
The through-thickness variation in microstructure after annealing is shown quantitatively in Fig. 8 by comparing the key microstructural parameters calculated from the EBSD data obtained from the ND-RD [Figs. 7(a)–7(c)] and RD-TD [Figs. 7(d)–7(f)]. As already seen qualitatively from the phase maps [Figs. 7(a)–7(c)], the FCC phase fraction is remarkably decreased as compared with that in the warm-rolled EHEA after annealing at 800 °C. In addition, the FCC phase fraction is decidedly greater on ND-RD as compared with that on the RD-TD. However, the FCC phase fraction increases consistently with increasing annealing temperature, although the difference in the phase fraction at the ND-RD and RD-TD could still be observed after annealing at 1000 °C. Remarkably, the warm-rolled material annealed at 1200 °C shows very similar FCC phase fractions on the ND-RD and RD-TD, thus indicating a through-thickness homogeneity in phase fractions. The FCC phase fraction in the material annealed at 1200 °C is also comparable to the FCC phase fraction in the as-cast material.
Variation in (a) FCC phase fraction, (b) average grain size, and (c) hardness with annealing temperature in the 90% warm-rolled EHEA.

Although the material annealed at 800 °C shows an ultrafine microstructure, the grain size obtained from the ND-RD is decidedly lower than that measured on the RD-TD [Fig. 8(b)]. The difference in grain size between ND-RD and RD-TD increases further following annealing at 1000 °C. However, the difference in grain size is reduced drastically after annealing at 1200 °C; the grain size measured on the ND-RD (∼1.6 µm) continues to show a lower value than that measured on the RD-TD (∼2 µm). A rather fine grain size obtained even after annealing at 1200 °C clearly indicates significant resistance of the EHEA to microstructural coarsening.
The change in hardness due to annealing is shown in Fig. 8(c). The very high hardness of the warm-rolled material (∼650 Hv) is decreased significantly (∼450 Hv) after annealing at 800 °C. Hardness decreases consistently with increasing annealing temperature. The hardness of material annealed at 1200 °C (∼325 Hv) is comparable to that of the as-cast material (∼350 Hv).
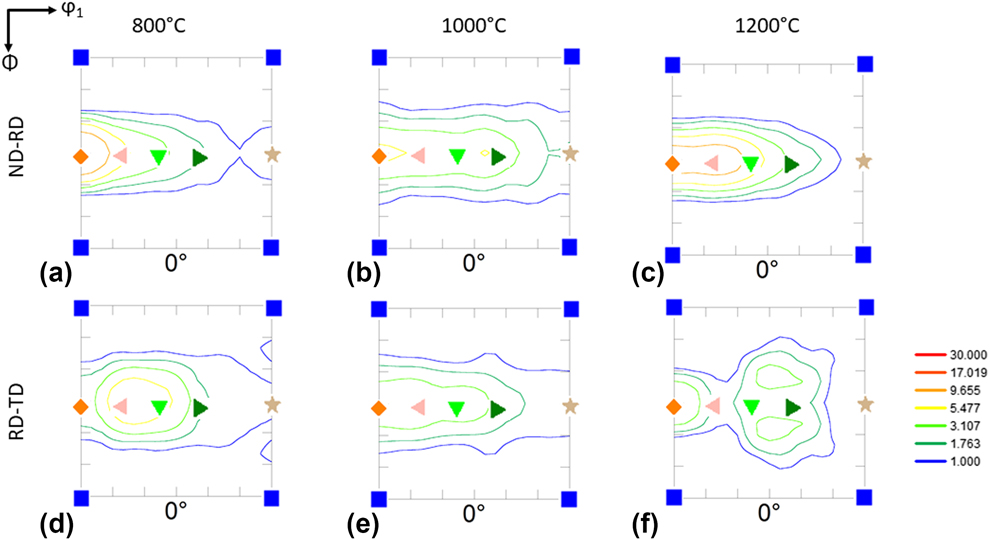
Since the major orientations in the FCC phase in the warm-rolled EHEA were obtained along the α-fiber, it is interesting to elucidate the changes following different annealing treatments. The φ2 = 0° section of the ODF of the FCC phase in the material annealed at 800 °C [Fig. 9(a)] obtained from ND-RD shows clear presence of the α-fiber components, particularly strong intensity is observed centered on the G component. The intensities of the contour line in the φ2 = 0° section obtained from the RD-TD [Fig. 9(d)] show stronger presence of the G/B and BS components. The φ2 = 0° ODF sections obtained from the ND-RD of the materials annealed at 1000 °C [Fig. 9(b)] and 1200 °C [Fig. 9(c)] clearly show the persistence of the α-fiber with particularly dominant G, G/B, and BS components. In contrast, the α-fiber components appear to be present in the ODF section obtained from the RD-TD of the materials annealed at 1000 °C [Fig. 9(d)], although the texture appears to be somewhat diffuse after annealing at 1200 °C [Fig. 9(f)].
φ2 = 0° section of the ODFs of the L12/FCC phase obtained from the (a)–(c) ND-RD and (d)–(f) RD-TD sections of the 90% warm-rolled EHEA annealed at (a) and (d) 800 °C, (b) and (e) 1000 °C, and (c) and (f) 1200 °C. The legends are same as in Fig. 5.

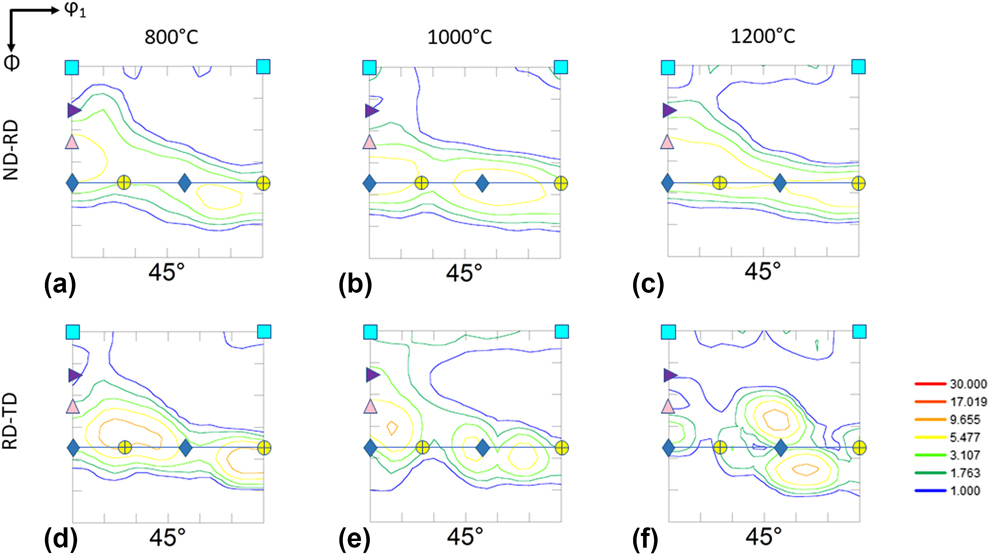
The changes in texture in the B2 phase after annealing is represented by the φ2 = 45° section of the ODFs (Fig. 10). The ODF sections obtained from the ND-RD [Figs. 10(a)–10(c)] and RD-TD [Figs. 10(d)–10(f)] of the EHEA annealed at different temperatures show the presence of typical RD and ND fibers. However, subtle differences can be pointed out. The ODF section obtained from the ND-RD section of material annealed at 800 °C [Fig. 10(a)] shows intensity peak around the  $\left( {111} \right)[1\bar{1}0]$ orientation lying at the intersection of the RD and ND fibers. The ODF sections obtained from the ND-RD section of the materials annealed at 1000 °C [Fig. 10(b)] and 1200 °C [Fig. 10(c)] appear very similar to that of the material annealed at 800 °C [Fig. 10(a)]. The ODF sections obtained from the RD-TD of the materials annealed at 800 °C [Fig. 10(d)] and 1000 °C [Fig. 10(e)] show intensity peak at the vicinity of the ND fiber component
 $\left( {111} \right)[11\bar{2}]$, although the ODF section of the material annealed at 1200 °C [Fig. 10(f)] shows somewhat weaker intensities along the ND fiber. The intensity peak associated with the
 $\left( {111} \right)[11\bar{2}]$ also appears to be shifted.
φ2 = 45° section of the ODFs of the B2 phase obtained from the (a)–(c) ND-RD and (d)–(f) RD-TD sections of the 90% warm-rolled EHEA annealed at (a) and (d) 800 °C, (b) and (e) 1000 °C, and (c) and (f) 1200 °C. The legends are same as in Fig. 6.

Discussion
Microstructure and texture of warm-rolled EHEA
A key aspect of severe warm rolling of the present EHEA is the pronounced microstructural heterogeneities. The microstructure of the EHEA at lower deformation level consists of lamellae inclined to the RD. Structural evolution leads to a microstructure dominated by bent lamellae at intermediate strain level, which is finally converted into a nano-lamellar microstructure consisting of alternating bands of the two constituent phases after severe warm rolling. It may be interesting to compare the microstructural evolution of the EHEA with that of pearlitic steels, which also show fine lamellar microstructures consisting of alternating bands of ferrite and cementite. Furuhara et al. [Reference Furuhara, Mizoguchi and Maki26] have reported that pearlitic steels deformed to intermediate strain levels show microstructural inhomogeneities featured by bent lamellae, fine lamellae, and rather coarse regions containing shear bands, although the bent lamellae dominate the microstructure. After heavy deformation, the area fraction of the bent lamellae decreases considerably, so that the microstructure is dominated by fine lamellae. In the present case, although the bent lamellae are almost absent in the microstructure of the 90% warm-rolled EHEA obtained from the ND-RD, the microstructure still contain heterogeneities featuring fine and coarse lamellar regions. Although the phase fractions measured from the ND-RD and RD-TD are rather similar, the warm-rolled EHEA also shows pronounced through-thickness heterogeneities. This is clearly evidenced from the RD-TD micrograph showing fragmented regions containing bent lamellae and coarse retained lamellar regions having significantly higher PB spacing than that observed on the ND-RD (Fig. 4). The fragmentation appears to be due to the surface shear, although the overall microstructural refinement is lower than that observed on the ND-RD. Therefore, the microstructural evolution in the present EHEA shows similarities with that of the pearlitic steel [Reference Furuhara, Mizoguchi and Maki26], although the microstructural homogeneities are not established even after 90% warm rolling. Nevertheless, the similarities possibly indicate a generic pattern in microstructural evolution of materials having fine lamellar starting microstructures.
Although the phase fractions do not show any significant changes during heavy warm rolling, the L12 phase undergoes deformation-induced disordering and the B2 phase retains the ordered structure [Figs. 4(c)–4(e)]. The deformation-induced disordering of the L12 phase has been already reported for L12-Ni3Al during deformation by cold rolling [Reference Ball and Gottstein27], high pressure torsion [Reference Ciuca, Tsuchiya, Yokoyama, Todaka and Umemoto28, Reference Rentenberger and Karnthaler29, Reference Rentenberger and Karnthaler30], mechanical milling [Reference Jang and Koch31], and also during heavy cold rolling of the present EHEA [Reference Wani, Bhattacharjee, Sheikh, Lu, Chatterjee, Bhattacharjee, Guo and Tsuji19, Reference Wani, Bhattacharjee, Sheikh, Bhattacharjee, Guo and Tsuji20]. The passage of perfect or pair of dissociated super-dislocations preserves the ordered structure as the disordering introduced by the passage of the leading partial is removed by the trailing one. The disordering is attributed to the uncoupling of the partial dislocations, experimental evidences of which have been produced before [Reference Dadras and Morris32]. However, other authors have highlighted the critical role of deformation heterogeneities, particularly high density of shear bands [Reference Ball and Gottstein27]. Profuse shear band formation has been observed in the present EHEA following heavy cold rolling [Reference Wani, Bhattacharjee, Sheikh, Bhattacharjee, Guo and Tsuji20] and also could be evidenced in the heavily warm-rolled EHEA, distinguished by their wavy appearance [Fig. 2(c)]. However, the mechanism of disordering needs to be probed further.
The FCC phase in the warm-rolled EHEA shows the development of a strong brass texture, which is confirmed in the cold-rolled EHEA [Reference Wani, Bhattacharjee, Sheikh, Clark, Park, Okawa, Guo, Bhattacharjee and Tsuji22]. However, the texture of the warm-rolled EHEA shows characteristic differences, featured by a stronger brass component on the ND-RD than on the RD-TD, which shows stronger G/B component. The stronger G/B component is attributed to greater surface shear expected on the RD-TD, which is also followed from the microstructural observations.
The development of a brass-type texture is indicative of the low stacking fault energy (SFE) of the FCC phase. The textures of high- to medium-SFE FCC materials are usually characterized by copper-type texture dominated by the Cu ({112}〈111〉) and S ({123}〈634〉) components. On the contrary, the low-SFE FCC alloys show much stronger BS component than Cu and S components. The composition of the L12 phase contains between 18 and 20% of each of Co, Cr, and Fe. These alloying elements have characteristic influences on the SFE of Ni (∼130 mJ/m2). The SFE of Ni is systematically decreased by the addition of Co [Reference Ray33] and Cr [Reference Symons34], while the addition of Fe does not affect the SFE of Ni significantly [Reference Gallagher35]. Thus, the SFE of Ni will be further reduced in the present EHEA, which is consistent with the development of a brass-type texture. Nevertheless, the mechanism of brass-type texture is still debated. While the role of deformation twins in brass texture has been highlighted in the past [Reference Leffers and Ray36], recently the role of shear bands has been emphasized [Reference Madhavan, Ray and Suwas37, Reference Madhavan, Ray and Suwas38]. Presence of shear bands has already been clarified in the SEM micrographs [Fig. 2(c)]. Therefore, shear bands appear to play a critical role in both disordering and texture development in the L12/FCC phase of the present EHEA.
The texture evolution in the heavily cold-rolled B2 phase such as FeCo–2V has been interpreted in terms of the RD and ND fibers, typical for BCC materials [Reference Deng, Yang, Wang, Chen and Peng39]. The B2 phase in the present warm-rolled EHEA shows the development of the typical RD and ND fiber components. The more uniform fiber in the B2 phase of the warm-rolled EHEA as compared with that in the cold-rolled EHEA [Reference Wani, Bhattacharjee, Sheikh, Clark, Park, Okawa, Guo, Bhattacharjee and Tsuji22] possibly could be due to more homogeneous strain partitioning in the warm rolling case. However, subtle differences in texture between ND-RD and RD-TD could still be observed due to the microstructural heterogeneities, as already observed in the case of the L12/FCC phase. In particular, the {111}〈110〉 component is found prominent in the ND-RD, while the {114}〈110〉 component is found to be stronger on the RD-TD plane. The {111}〈uvw〉 orientation in particular {111}〈110〉 component has been found in the heavily warm-rolled B2 structured Fe3Al [Reference Raabe and Keichel40], as well as in the B2 phase of cold-rolled EHEA [Reference Wani, Bhattacharjee, Sheikh, Clark, Park, Okawa, Guo, Bhattacharjee and Tsuji22]. The activation of the {110}〈111〉 and {112}〈111〉 slip systems appears responsible for the texture development [Reference Humphreys and Hatherly24, Reference Raabe and Keichel40, Reference Raabe, Keichel and Sun41, Reference Kad, Schoenfeld, Asaro, McKamey and Sikka42].
Microstructure and texture of annealed EHEA
The EHEA continues to show prominent heterogeneities after annealing at 800 °C. The microstructure on ND-RD shows the development of an ultrafine microduplex structure, while the RD-TD shows lamellar regions. The microduplex structure on the ND-RD is also confirmed in the cold-rolled and annealed EHEA [Reference Wani, Bhattacharjee, Sheikh, Bhattacharjee, Guo and Tsuji20] and also in other duplex alloys such as duplex stainless steels [Reference Ahmed and Bhattacharjee43]. In stark contrast, the EBSD phase map of the RD-TD section shows lamellar regions along with fragmented regions. Therefore, the annealed microstructure of the RD-TD resembles that of the warm-rolled material. This clearly indicates that microstructural breakdown is slower on the RD-TD than on the ND-RD, which could be attributed to the coarser microstructure of the RD-TD. Annealing at higher temperatures accelerates the microduplex structure. Consequently, both RD-TD and ND-RD develop a rather uniform microduplex structure following annealing at 1200 °C.
The fraction of the FCC phase decreases after annealing at 800 °C as compared with that in the warm-rolled material. However, with increasing annealing temperature, the FCC fraction increases consistently. This clearly implies that recrystallization process in the EHEA is concomitant with phase transformation. Very similar behavior is observed in other duplex HEAs such as warm-rolled Al0.5CoCrFeMnNi [Reference Wani, Sathiaraj, Ahmed, Reddy and Bhattacharjee25] and cold-rolled EHEA [Reference Wani, Bhattacharjee, Sheikh, Bhattacharjee, Guo and Tsuji20], which indicates increasing FCC phase fraction with increasing annealing temperature. This is understood from the fact that the equilibrium phase fractions in duplex alloys should vary depending on the temperature of annealing. However, marked differences in phase fractions are observed on RD-TD and ND-RD following annealing [Fig. 8(a)]. While the phase fractions on ND-RD and RD-TD are very similar in the warm-rolled condition, the RD-TD shows much lower fraction of the FCC phase than that of the ND-RD after annealing at 800 °C. These differences in phase fraction are due to the microstructural differences in the warm-rolled condition on the RD-TD and ND-RD, so that the kinetics of phase transformation is different on ND-RD and RD-TD. In contrast, the FCC phase fractions on ND-RD and RD-TD are rather similar among them and very similar to that of the as-cast EHEA following annealing at 1200 °C. High annealing temperature results in enhanced transformation kinetics, so that through-thickness homogeneities in microstructure and phase fractions are established. It is interesting to note that the eutectic melting point of the HEA is ∼1350 °C [Reference Wani, Bhattacharjee, Sheikh, Clark, Park, Okawa, Guo, Bhattacharjee and Tsuji22], which is closer to the annealing temperature of 1200 °C. Since the sample is quenched from the annealing temperature of 1200 °C, this results in a very similar volume fraction of the FCC phase in the as-cast material and the material annealed at 1200 °C.
The EHEA also shows a remarkable resistance against grain growth during annealing [Fig. 8(c)]. An ultrafine microstructure is obtained after annealing 800 °C, while the average grain size is ≤2 µm after annealing at 1200 °C. The remarkable resistance against microstructure is attributed to the formation of microduplex structure, where the growth of one phase is resisted by the other phase. The grain size on ND-RD is lower than that on RD-TD due to the finer microstructure in the warm-rolled condition, which provides larger number of nucleation sites. After annealing at 1200 °C, the grain sizes on ND-RD and RD-TD are rather similar, thus confirming remarkable homogeneity in morphology, microstructure, and phase fraction.
The hardness of the EHEA decreases considerably after annealing, although a rather high hardness could be retained after annealing at 800 °C. However, a considerable decrease in hardness is observed after annealing at 1200 °C. This decrease in hardness is not only due to the increase in the average grain size but also due to the increase in the softer FCC phase fraction. This indicates that a wide range of mechanical properties could be achieved in the warm-rolled EHEA by controlling grain size and phase fraction through optimized annealing treatments. Of course, this remains a topic of much interest and would be investigated in future research.
The texture of the FCC phase in the annealed EHEA continues to show the retention of the α-fiber component. Very similar behavior is observed in other low-SFE FCC and in the FCC phase of the cold-rolled and annealed EHEA [Reference Wani, Bhattacharjee, Sheikh, Clark, Park, Okawa, Guo, Bhattacharjee and Tsuji22]. However, this behavior is at variance with the classical recrystallization texture of low-SFE α-brass, which shows prominent {236}〈385〉 and {113}〈332〉 components due to the preferential nucleation or growth associated with them [Reference Humphreys and Hatherly24]. The retention of the α-fiber components but absence of prominent {236}〈385〉 and {113}〈332〉 components has been attributed to the absence of preferential nucleation and growth. The evident similarities of the annealing texture of the FCC phase in the present EHEA indicate similar mechanisms. Nevertheless, the textures observed for ND-RD and RD-TD show certain differences. A strong brass texture is observed on the ND-RD as compared with that on the RD-TD, particularly after annealing at 1200 °C. This could be attributed to the strong brass component on the ND-RD as compared with that on the RD-TD in the warm-rolled condition.
Since the deformation texture of the B2 phase in the EHEA shows the typical ND and RD fiber components, the recrystallization texture could be best appropriated by considering the changes in the intensity of these components, as is the case for BCC materials. The annealing texture of the BCC materials usually shows stronger ND fiber than RD fiber since the former is more prone to recrystallization [Reference Verlinden, Driver, Samajdar and Doherty44]. The presence of stronger ND fiber components in the B2 phase of the annealed EHEA thus agrees quite well with this pattern. However, the inhomogeneities in texture are observed. While the texture on the ND-RD shows well-developed ND fiber, the RD-TD plane shows significant changes along the ND fiber following annealing at 1200 °C. As already highlighted, the recrystallization process is concomitant with phase transformation in the EHEA. A significant increase in the L12/FCC phase fraction (∼20%) at the expense of the B2 occurs on the RD-TD during annealing at 1200 °C [Fig. 8(a)], leading to the observed changes in texture.
Conclusions
(1) A (L12 + B2) lamellar EHEA was warm-rolled at 400 °C up to 90% reduction in thickness. The warm rolling resulted in the deformation-induced disordering of the L12 phase, remarkable increase in hardness, and development of pronounced inhomogeneities characterized by a much finer microstructure on ND-RD as compared with that on the RD-TD. This indicated that decrease in hardness due to disordering is compensated by the remarkable microstructural refinement due to heavy warm rolling.
(2) The L12/FCC phase developed α-fiber texture (ND//〈110〉) with a particularly strong brass component, while the B2 phase developed the usual RD (//〈110〉) and ND (//〈111〉) fibers. However, inhomogeneities in texture between ND-RD and RD-TD could be noticed concomitant with the microstructural inhomogeneities.
(3) Upon annealing at 800 °C, the ND-RD showed an ultrafine microduplex structure, while the RD-TD showed a retained lamellar structure. The differences were due to the sluggish microstructural evolution on the RD-TD due to a coarser microstructure in the warm-rolled EHEA. A rather uniform microduplex structure evolves throughout the volume after annealing at 1200 °C due to the accelerated kinetics of transformation at higher temperatures. Although significant decrease in FCC phase fraction was observed after annealing at 800 °C, the phase fractions were uniform throughout the volume after annealing at 1200 °C.
(4) The EHEA also showed strong resistance against grain growth due to the microduplex structure. Although the hardness decreased significantly after annealing, a high hardness could be obtained, indicating the possibilities of optimization of properties through optimized annealing treatments.
(5) The FCC phase showed the retention of the α-fiber components, while the B2 phase showed stronger ND fiber. However, inhomogeneities in texture could still be observed even after annealing at 1200 °C.
Experimental
Processing
The AlCoCrFeNi2.1 EHEA used in the present investigation was obtained by arc melting of high-purity constituents (≥99.9%) in a Ti-gettered furnace. To ensure greater chemical homogeneity, the melting cycle was repeated at least five times. The melt was suction-cast into a copper mold with inner dimensions of 90 mm (length) × 15 mm (width) × 3 mm (thickness).
Specimens with dimensions of 20 mm (length) × 15 mm (width) × 3 mm (thickness) were extracted from the as-cast EHEA, and the surfaces were carefully prepared to remove any contamination. Since the recrystallization temperature of the alloy is ∼800 °C [Reference Wani, Bhattacharjee, Sheikh, Bhattacharjee, Guo and Tsuji20], the warm rolling temperature of 400 °C was selected, which was far below the recrystallization temperature but much above the room temperature. The warm rolling was carried out in a laboratory scale rolling instrument having rolls of ∼140 mm diameter (SPX Precision instrument, Fenn Division, Newington, CT, USA). The rolls were maintained at 250 °C to minimize the sudden quenching effect. The warm rolling was carried out up to 90% reduction in thickness to a final thickness of ∼300 µm, with approximately 5% reduction per pass. The specimens were soaked at 400 °C in a cylindrical furnace for 20 min prior to each pass and water quenched immediately after every pass.
Small specimens were extracted from the 90% warm-rolled sheets and were subjected to annealing treatments for 1 h at temperature ranging from 800 to 1200 °C. The annealed samples were immediately quenched in cold water following the heat treatments.
Characterization
The microstructure and texture of the deformed and annealed materials were investigated using electron backscatter diffraction (EBSD) system (Oxford Instruments,High Wycombe, U.K.) attached to an Field Emission Gun-Scanning Electron Microscope (FEG-SEM) (Model: Supra 40; Carl-Zeiss, Oberkochen, Germany) and a transmission electron microscope (TEM; Model: JEM-2100; JEOL, Tokyo, Japan). The samples for EBSD and TEM measurements were prepared by mechanical polishing followed by electropolishing at −15 °C using a mixture of perchloric acid and ethanol in a ratio of 1:9 (by volume). The SEM and EBSD observations were carried out on the rolling plane (RD-TD plane) close to the surface of the rolled sheets (∼30–40 µm below the surface of the rolled sheet) and on the longitudinal plane (ND-RD) at the mid-thickness region (i.e., close to the thickness center ∼150 µm depth below the surface).
The acquired EBSD dataset was exported to TSL-OIM™ (EDAX) software for the analysis purpose. Several EBSD scans were acquired from different regions of each deformed and annealed specimens to achieve data with good statistical reliability. These scans were merged for calculating the key microstructural parameters and orientation distribution functions (ODFs). The EBSD data acquired from the ND-RD were suitably rotated to bring it in coincidence with the RD-TD for the purpose of ODF calculation. The mechanical properties were evaluated using hardness testing (Model: Durascan; Emco Test, Kuchl, Austria). The load used for indentation was 300 gmf and the typical indentation depths were 20–40 µm depending upon the hardness value reported. The samples for hardness measurements were prepared by mechanical polishing using colloidal silica in the final polishing step to ensure a very smooth surface.
Acknowledgments
The financial support provided by DST, India (EMR/2016/002215), DST-FIST (SR/FST/ETI-421/2016), and JICA-CKP; the startup grants from the Advance Materials Science at Chalmers University of Technology; and Junior Researcher Grant from the Swedish Research Council (2015-04087) are sincerely acknowledged.