I. INTRODUCTION
Calcium phosphates (CaPs) are being investigated for a variety of medical applications, such as tissue engineering and drug and gene delivery due to their similarity with mammalian bone.Reference Wagner and Bhaduri1–Reference Maitra5 Numerous synthesis routes have been identified for the synthesis of CaP nanoparticles such as hydrothermal processing, sol–gel, and molten salt synthesis.Reference Liu, Ye, Wang, Zhu, Wang and Yan6–Reference Varma, Kalkura and Sivakumar9 A variety of studies have optimized chemical processing routes to control CaP nanoparticle morphology and, in particular, to produce high aspect ratio nanoparticles of HA.Reference Liu, Ye, Wang, Zhu, Wang and Yan6,Reference Neira, Guitian, Taniguchi, Watanabe and Yoshimura8,Reference Roeder, Converse, Leng and Yue10,Reference Zhang and Darvell11 High aspect ratio nanoparticles (nanowhiskers, nanorods, nanotubes, etc.) have several distinct advantages. They typically exhibit increased mechanical strength and high surface area to volume ratios as compared to spherical particles.Reference Wong, Sheehan and Lieber12 Improved mechanical strength is advantageous in load-bearing applications, such as in dental and orthopedic tissue engineering scaffolds.Reference Viswanath, Raghavan, Gurao, Ramamurty and Ravishankar13 Gene and drug delivery applications benefit from increased surface area to volume ratios because higher drug concentrations can be delivered with lesser particulate matter.Reference Rabinow14
Templating agents and surfactants can be used to generate high aspect ratio CaPs, but they have been known to have cytotoxic effects, even at low residual concentrations.Reference Coelho, Agostinho Moreira, Almeida and Monteiro15,Reference Wang, Liu, Yin, Wu, Wada, Ren, Jiang, Cheng and Xu16 Alternative methods of synthesizing high aspect ratio CaP nanoparticles are needed to maximize their potential utility in biomedical applications. Previous studies have used control of synthesis parameters such as pH and temperature to generate high aspect ratio CaP nanoparticles.Reference Liu, Ye, Wang, Zhu, Wang and Yan6,Reference Neira, Guitian, Taniguchi, Watanabe and Yoshimura8 Particles having an aspect ratio of about one (i.e., equiaxed) formed at a pH of 14 in a hydrothermal synthesis of HA, whereas particles synthesized in a pH range of 6–9 resulted in the formation of high aspect ratio, needle-like particles.Reference Liu, Ye, Wang, Zhu, Wang and Yan6 Temperature profiling was shown to be capable of controlling HA crystal growth in a urea-assisted hydrothermal method to drive high aspect ratio particle formation.Reference Neira, Guitian, Taniguchi, Watanabe and Yoshimura8 While the majority of synthesis methods focus on generating HA, solution combustion synthesis has been used to synthesize biphasic compositions of HA and β-TCP nanocrystalline powders. The Ca to P (Ca/P) ratio was found to be the predominant indicator of the ratio of β-TCP to HA in final powders in a urea-assisted route with β-TCP produced in excess of 80% when the initial Ca/P ratio was 1.5.Reference Tas17 Additionally, the fuel-to-oxidant ratio in solution combustion synthesis utilizing urea as fuel was found to have an effect on the final biphasic composition.Reference Vollmer and Ayers18 Collectively, these prior experiments provide some insight into the influence of synthesis parameters such as fuel source, Ca/P ratio, and pH for calcium phosphate particle formation in processes which focus on HA.
Alternatives to the conventional processes, such as molten salt synthesis, have been used to prepare high aspect ratio HA nanoparticles and micron-sized TCP.Reference Viswanath, Raghavan, Gurao, Ramamurty and Ravishankar13,Reference Tas19,Reference Mao, Park, Zhang, Zhou and Wong20 In molten salt synthesis techniques, low-melting point solvents (e.g., carbonates, alkali chlorides, hydroxides, sulfates, etc.) are used to generate a reaction bath in which particle formation occurs. The selection of salts is thought to be a major determinant for chemical phase and morphology.Reference Mao, Park, Zhang, Zhou and Wong20
Microwave processing is an alternative to conventional processing techniques utilizing furnaces. It has been shown to be capable of producing high aspect ratio HA nanoparticles.Reference Cao, Feng, Deng, Chang, Wang, Liu, Lu, Lu, Zheng, Zhang and Tao21–Reference Park, Ryu, Yoon, Stevens and Park23 The primary advantages of utilizing a microwave-assisted technique is that it results in more uniform volumetric heating than conventional heating methods, which rely on bulk conduction. It is thought that powders or precursor powders formed in microwave synthesis methods have improved morphological and phase homogeneity. Microwave processing also offers considerable decreases in energy consumption.Reference Liu, Li, Wang, Zhu and Yan22
The microwave-assisted solution combustion synthesis (MASCS) process combines the best features of solution combustion, molten salt, and microwave processing. Our group pioneered this process, which utilizes microwave-assisted combustion to generate a molten salt flux in which nanoparticle formation occurs.Reference Roeder, Converse, Leng and Yue10 Three different compositions of CaP particles were generated using this approach: HA nanowhiskers, β-TCP microparticles, and a biphasic composition of HA/β-TCP with both particle morphologies. The biphasic composition was produced by varying the fuel-to-oxidant ratio in the HA formulation with a Ca/P ratio of 1.67. However, although the feasibility of this composite technique was demonstrated, there is limited information available for other calcium phosphate phases and biphasic compositions using MASCS. In particular, there has been no focus devoted toward studies with initial calcium to phosphate ratios of 1.5.
Having control over morphological parameters and resultant CaP phases via MASCS is important if CaP nanoparticles beyond HA are to be optimized as a viable biomaterial. To the best of our knowledge, there has been no systematic study to characterize the process itself. At least one parameter, the composition of the liquid (and/or molten salt) during particle formation, has been suggested to be critical in both the morphology and chemical phase of the resultant particles for various biomedical applications.Reference Park, Ryu, Yoon, Stevens and Park23 Therefore, to extend our understanding of the MASCS process, we systematically investigated the effect of fuel-to-oxidant ratio, pH, cation chemistry, and cooling rate for calcium phosphate nanoparticles with an initial Ca/P ratio of 1.5. The resulting changes in chemical phase and morphology are presented and discussed.
II. METHODS
A. Microwave-assisted combustion synthesis
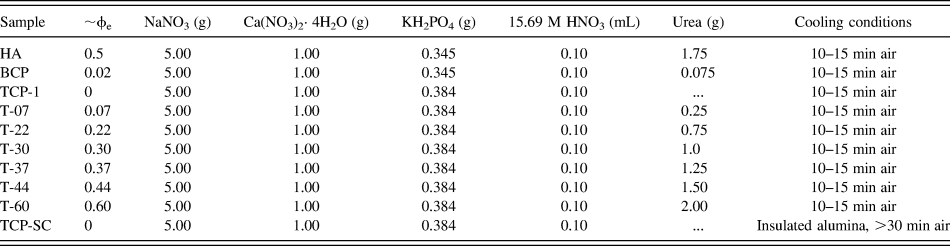
CaP nanopowders were synthesized using a modified MASCS method.Reference Jalota, Tas and Bhaduri24 Sodium nitrate, calcium nitrate, potassium phosphate monobasic, and nitric acid were dissolved in 10 mL of deionized water in a 30-mL Pyrex beaker under constant magnetic stirring. Urea (if present) was used as the combustion fuel source. All solutions were transparent and free of visible precipitates prior to exposure to microwave heating. The 30-mL Pyrex beaker was placed in the center of a 10 × 10 × 1 cm alumina fiberboard and covered with an inverted 250-mL Pyrex beaker and heated at full power for 5 min in a household microwave oven (Emerson MW87817SB, 2.45 GHz, 600 W, Hackensack, NJ). Samples were then allowed to cool for 10–15 min, unless otherwise specified, at room temperature, removed from the beaker, and magnetically stirred at 400 rpm for 1 h. The different formulations of all reactions are listed in Table I. HA denotes an initial Ca/P ratio of 1.67, BCP denotes a biphasic calcium phosphate formulation with a Ca/P ratio of 1.67 but a fuel–oxidant ratio of 0.02. The original TCP formulation reported by our group with an initial Ca/-P ratio of 1.5 is labeled as TCP-1,Reference Jalota, Tas and Bhaduri24 whereas those formulations investigated in the current work are denoted with a T. All chemicals were purchased from Fisher Scientific (Fisher Chemicals, Fisher Scientific, Fair Lawn, NJ).
Sample preparation for β-TCP and slow cooled nanowhiskers.

φe, fuel–oxidizer ratios; T prefix denotes the Ca/P ratio of 1.5; naming convention is T-fuel-to-oxidizer ratio (e.g., T-07 has a Ca/P ratio of 1.5 and a φe = 0.07); SC = slow cooled.
B. Investigation of cation chemistry
Magnesium nitrate hexahydrate, sodium nitrate, and a combined sodium and magnesium nitrate solution (with nitrate content equivalent to TCP-1) at a Ca/Mg ratio of 1 were used as oxidizers in the T-Na/Mg and T-Mg formulations (Table II). Sodium chloride was added to the TCP-1 formulation to study the effects of excess sodium (monovalent cation) and chloride (Table II). All solutions were then exposed to microwave heating as described in Sec. II. A.
Sample preparation for a Ca/P ratio of 1.5 prepared with different cations.
a T-Na/Mg contained both NaNO3 and Mg(NO3)2·6H2O as oxidants; T-Mg exclusively contained Mg(NO3)2·6H2O as the oxidant; T-NaCl contained NaCl in addition to the NaNO3.
C. Effects of pH
To investigate the effects of the pH of the precombustion solution, the TCP-1 solution was brought to a pH of 1, 2, or 3 with nitric acid prior to microwave heating for 5 min. The original TCP-1 formulation had a pH of 3.5 with 0.10 mL of nitric acid. All solutions were then exposed to microwave heating as described in Sec. II. A.
D. Effects of cooling rate
The effect of cooling rate following microwave combustion was examined by placing the beaker containing the aqueous, precombustion TCP-1 solution inside of a 10 × 10 × 10 cm alumina parallelepiped insulated with alumina fibers. Alumina is transparent to microwave radiation, but is a thermal insulator. Therefore, samples could be exposed to microwave heating without changing the microwave heating kinetics but could then be cooled at a reduced rate (slowed cooling kinetics) (TCP-SC, Table I).
E. Calculation of fuel ratio
Using propellant chemistry,Reference Jain, Adiga and Pai Verneker25 each combustion synthesis was modeled based on the following chemical reaction:
$$& n\,{\rm{NaN}}{{\rm{O}}_{\rm{3}}} + x\,{\rm{Ca(N}}{{\rm{O}}_{\rm{3}}}{{\rm{)}}_{\rm{2}}} \cdot {\rm{4}}{{\rm{H}}_{\rm{2}}}{\rm{O}} + y\,{\rm{K}}{{\rm{H}}_{\rm{2}}}{\rm{P}}{{\rm{O}}_{\rm{4}}} + h\,{\rm{HN}}{{\rm{O}}_{\rm{3}}} + u\,{\rm{C}}{{\rm{H}}_{\rm{4}}}{{\rm{N}}_{\rm{2}}}{\rm{O}} \to {\rm{C}}{{\rm{a}}_x}{{\rm{(P}}{{\rm{O}}_4}{\rm{)}}_y} + f{\rm{[}}{{\rm{N}}_{\rm{2}}} + {\rm{C}}{{\rm{O}}_{\rm{2}}} + {{\rm{H}}_{\rm{2}}}{\rm{O]}} + {\rm{N}}{{\rm{a}}^{\rm{ + }}} + {{\rm{K}}^{\rm{ + }}}\quad ,} $$where the mole ratio of x/y is the Ca/P ratio. Urea, (CH4N2O), is the fuel, while NaNO3, Ca(NO3)2·4H2O, and HNO3 are oxidizers. Table III lists the Eqs. (2)–(4) used for the respective synthesis methods. Valences for each reactant were calculated based on the following:
Fuel-to-oxidant ratio (φe) equations.
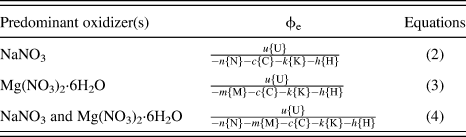
P(+5), C(+4), Ca(+2), Na(+1), K(+1), H(+1), N(0), and O(−2). Total valences for each reactant were then calculated as follows:
$$\eqalign{ & {\rm{urea}} = \left\{ {\rm{U}} \right\} = 1 \cdot {4_{\rm{C}}} + 4 \cdot {1_{\rm{H}}} + 2 \cdot {0_{\rm{N}}} + 1 \cdot {\left( { - 2} \right)_{\rm{O}}} = 6 \cr & {\rm{NaN}}{{\rm{O}}_3} = \left\{ {\rm{N}} \right\} = 1 \cdot {1_{{\rm{Na}}}} + 1 \cdot {0_{\rm{N}}} + 3 \cdot {\left( { - 2} \right)_{\rm{O}}} = - 5 \cr & {\rm{Ca(N}}{{\rm{O}}_3}{{\rm{)}}_2} \cdot 4{{\rm{H}}_2}{\rm{O}} = \left\{ {\rm{C}} \right\} = 1 \cdot {2_{{\rm{Ca}}}} + 2(1 \cdot {0_{\rm{N}}} + 3 \cdot {\left( { - 2} \right)_{\rm{O}}}) + 4\left( {2 \cdot {1_{\rm{H}}} + 1{{\left( { - 2} \right)}_{\rm{O}}}} \right) = - 10 \cr & {\rm{K}}{{\rm{H}}_{\rm{2}}}{\rm{P}}{{\rm{O}}_4} = \left\{ {\rm{K}} \right\} = 1 \!\cdot \!{1_{\rm{K}}} + 2 \cdot {1_{\rm{H}}} + 1 \cdot {5_{\rm{P}}} + 4 \cdot {\left( { - 2} \right)_{\rm{O}}} \!= 0 \cr & {\rm{HN}}{{\rm{O}}_{\rm{3}}} = \left\{ {\rm{H}} \right\} = 1 \cdot {1_{\rm{H}}} + 1 \cdot {0_{\rm{N}}} + 3 \cdot {\left( { - 2} \right)_{\rm{O}}} = - 5 \cr & {\rm{Mg(N}}{{\rm{O}}_{\rm{3}}}{{\rm{)}}_{\rm{2}}} \cdot 6{{\rm{H}}_{\rm{2}}}{\rm{O}} = \left\{ {\rm{M}} \right\} = 1 \cdot {2_{{\rm{Mg}}}} + 2(1 \cdot {0_{\rm{N}}} + 3 \cdot {\left( { - 2} \right)_{\rm{O}}}) + 6\left( {2 \cdot {1_{\rm{H}}} + 1{{\left( { - 2} \right)}_{\rm{O}}}} \right) = - 10 \cr} $$Fuel-to-oxidant ratios for each reaction are listed in Tables I and II.
F. Sample characterization
Samples were analyzed by x-ray diffraction (XRD) (Ulitma III, Rigaku, Woodlands, TX), scanning electron microscopy (SEM) (S-4800, Hitachi, Tokyo, Japan), and transmission electron microscopy (TEM) (HD-2300, Hitachi, Tokyo, Japan). The XRD spectra of the powders were obtained over a 2θ range of 10–60 with a step size of 0.02° and a scan rate of 0.5θ/min. The data was collected using a Cu Kα monochromator in the focused beam mode. Powder diffraction data were analyzed using Jade software (Materials Data Inc., Livermore, CA).
SEM and TEM samples were prepared by ultrasonically dispersing small amounts of the powders in 95% ethanol for 15 min. Five microliters of the solution was placed on carbon conducting tape on SEM sample mounts or holey copper grids for SEM or TEM analysis and placed in an oven to dry. SEM samples were sputter coated with gold-palladium for 30 s prior to imaging. SEM images were obtained at accelerating voltages of 3, 7, and 15 kV using a Hitachi S-4800 SEM (Tokyo, Japan). TEM and high-resolution TEM (HRTEM) images were obtained at an accelerating voltage of 200 kV using a Hitachi HD2300A STEM (Tokyo, Japan).
G. Statistics
Individual nanoparticle diameters and lengths were obtained from SEM images using ImageJ (NIH Software, Bethesda, MD) (n = 25). Statistical analysis was performed using unpaired, two tailed t-tests with Welch's correction to compare the means of the diameter, length, and aspect ratios. F tests were used to determine significant differences in variances. P < 0.05 was considered to be statistically significant. All statistical analyses were performed using GraphPad Prism 6.
III. RESULTS
A. Characterization of nanoparticles
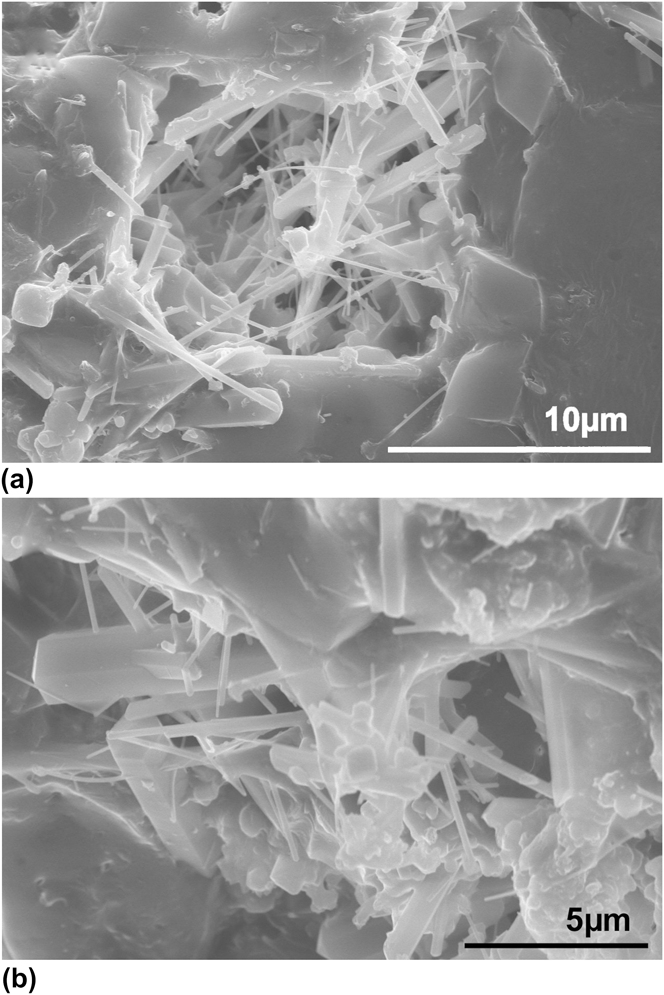
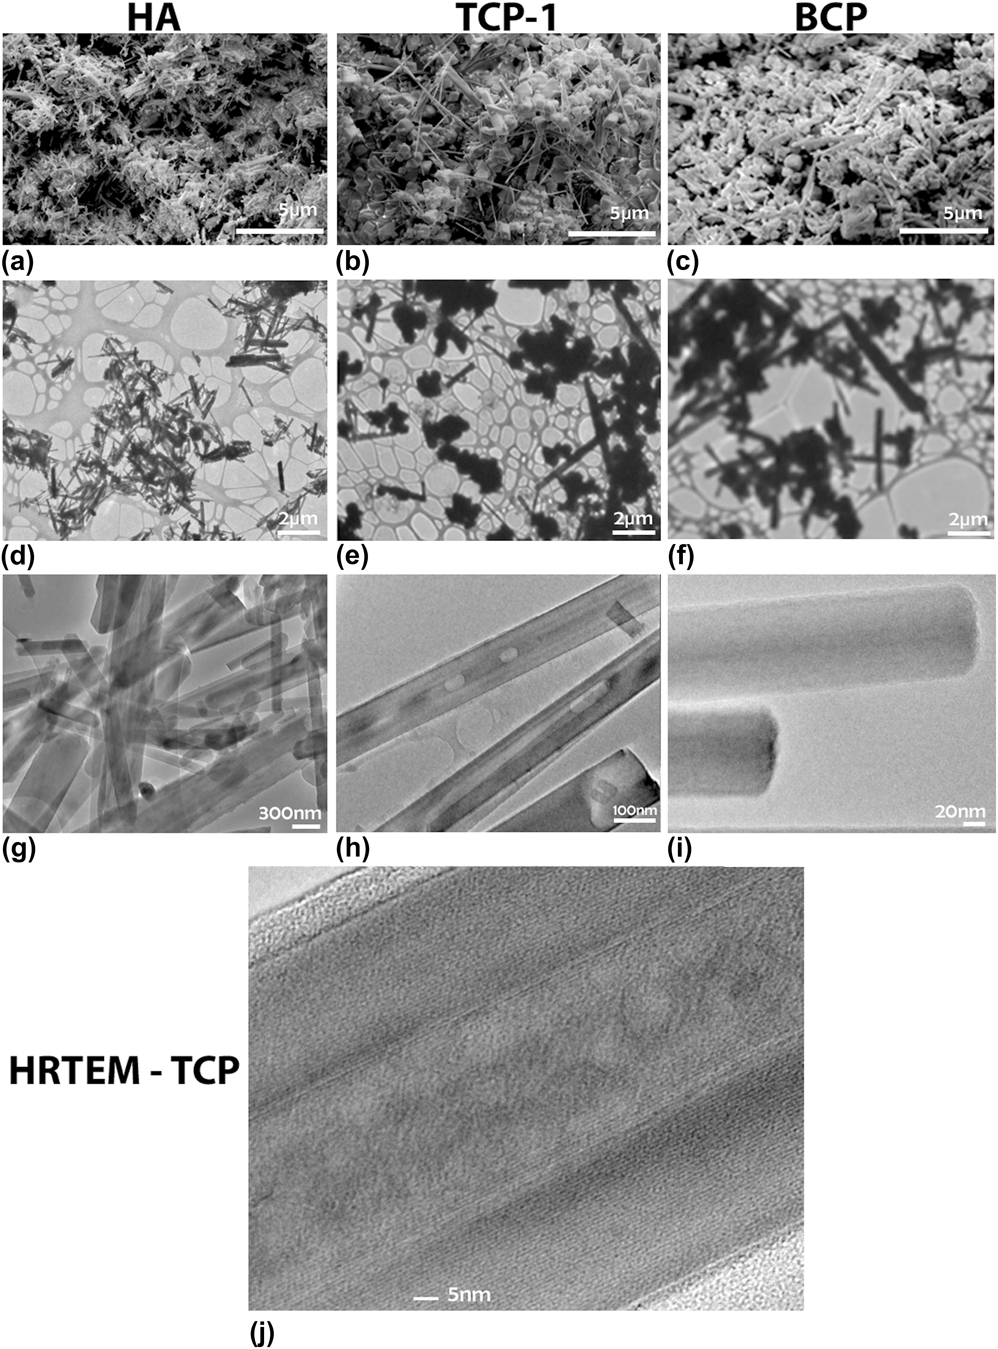
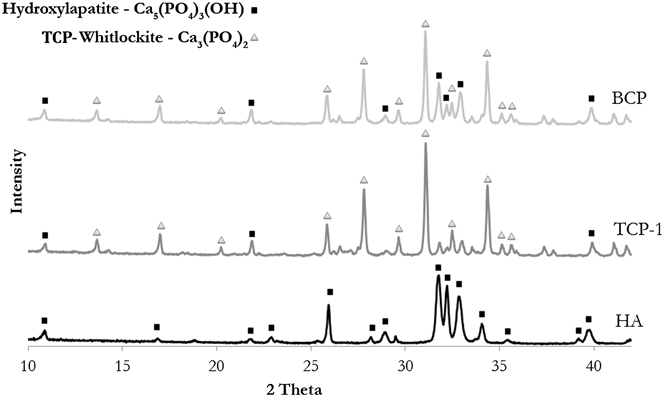
The orientation of nanowhiskers formed following MASCS was observed using SEM analysis by partially washing away residual salts with DI water after the molten salt bath had cooled, revealing isotropic growth directions (Fig. 1). Qualitatively, the HA formulation resulted in nonagglomerated, high aspect ratio nanoparticles with crystal growth along the c-axis and most nanoparticles less than 2 μm in length [Figs. 2(a), 2(d), and 2(g)]. While the majority of particles formed in the TCP-1 formulation were equiaxed, a subset of nanoparticles had high aspect ratios of about 20 [Figs. 2(b), 2(e), and 2(h)]. The BCP composition, qualitatively, had an increased number of high aspect ratio nanoparticles as compared to the TCP-1 formulation but still contained a large number of equiaxed particles [Figs. 2(c), 2(f), and 2(i)]. HRTEM analysis demonstrated that some nanowhiskers in the TCP-1 formulation appeared to be hollow [Fig. 2(j)]. XRD analysis of the as-synthesized HA, TCP, and biphasic (BCP) compositions match those previously reportedReference Jalota, Tas and Bhaduri24 and all nanoparticles showed a high degree of crystallinity after MASCS. The HA formulation resulted in hydroxyapatite nanoparticles, the TCP-1 formulation resulted in the formation of β-TCP, and BCP resulted in a biphasic (HA and β-TCP) composition (Fig. 3).
SEM micrograph of HA nanowhiskers formed in molten salt following MASCs. (a) A small portion of the solidified salts were removed with a brief deionized water rinse prior to SEM imaging preparation to reveal isotropic whisker growth orientations. (b) Higher magnification image.
SEM and TEM micrographs of nanowhiskers from HA, TCP-1, and BCP formulations. SEM micrographs of (a) HA, (b) TCP-1, and (c) BCP nanowhiskers. Low- and high-resolution TEM micrographs of (d and g) HA nanowhiskers; (e and h) TCP-1 nanoparticles (f and i) BCP nanowhiskers. (j) HRTEM showing a potentially hollow nanowhisker in the TCP-1 formulation.
XRD patterns of HA, TCP-1, and BCP formulations. Characteristic peaks are marked for all phases positively identified using Jade. HA, black squares; β-TCP, gray triangles.
B. Fuel-to-oxidant ratio impacts phase and morphology
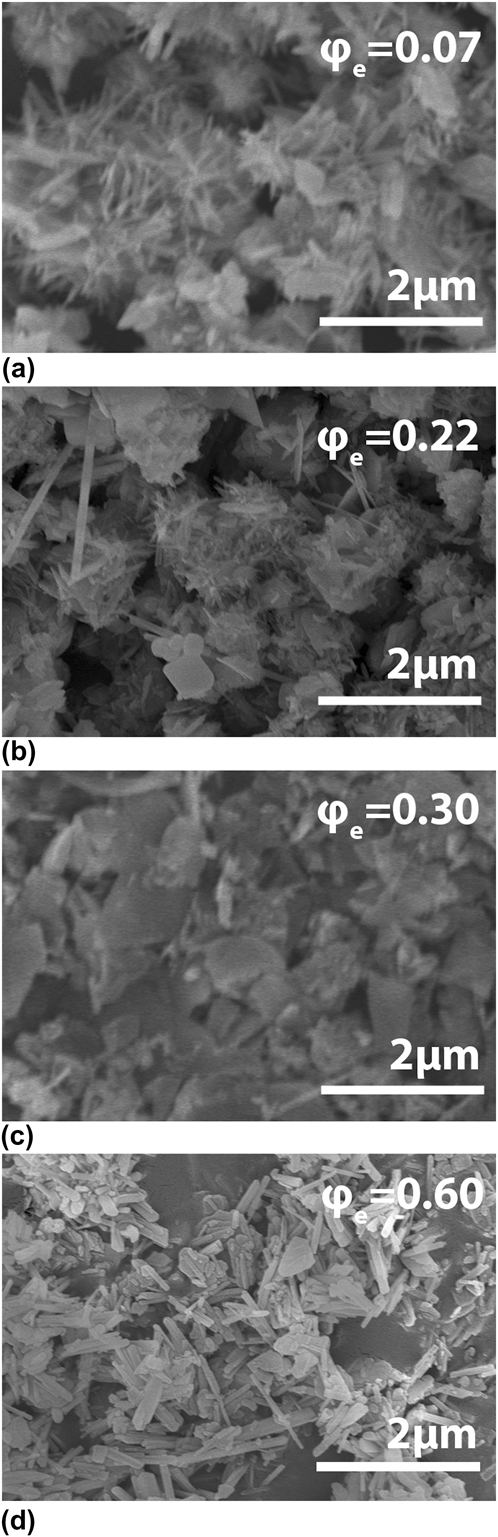
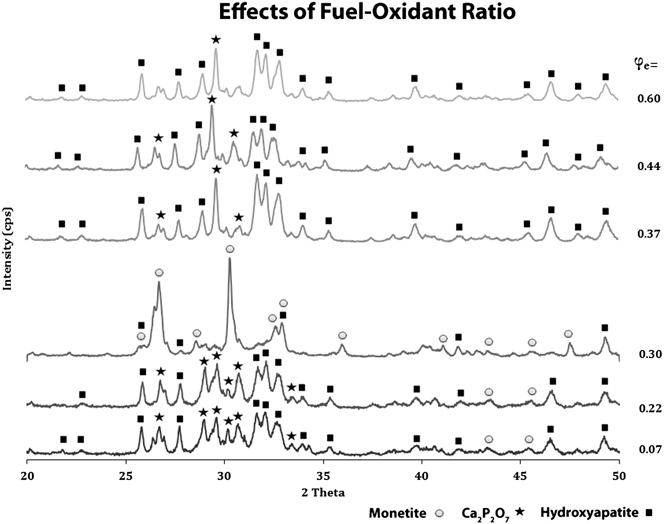
The urea content was varied for calcium phosphate formulations which had an initial calcium phosphate ratio, Ca/P, of 1.5, characteristic of TCP. Fuel (urea)-to-oxidant ratio, φe, was varied as listed in Table I. Changes in the fuel-to-oxidant ratio impacted both the final phase and morphology of the formed particles (Figs. 4 and 5). The use of low fuel-to-oxidant ratios (φe < 0.30) promoted the formation of equiaxed nanoparticles, while φe = 0.50 produced higher aspect ratios [Fig. 4(d)]. The amount of urea in the precombustion solution changed the resultant nanoparticle phase. Despite an initial Ca/P ratio of 1.5 and therefore corresponding to a Ca/P characteristic of TCP, the material tended toward the HA phase at higher fuel ratios with Ca2P2O7 dominating at lower fuel ratios. Monetite formed at a φe = 0.30 (Fig. 5).
SEM micrographs of varying fuel-to-oxidant ratios: (a) T-07, (b) T-22, (c) T-30, and (d) T-60.
XRD patterns of varying fuel-to-oxidant ratios. Characteristic peaks are marked for all phases positively identified using Jade. HA, black squares; Ca2P2O7, black stars; and monetite, gray circles.
C. pH impacts nanoparticle phase and morphology
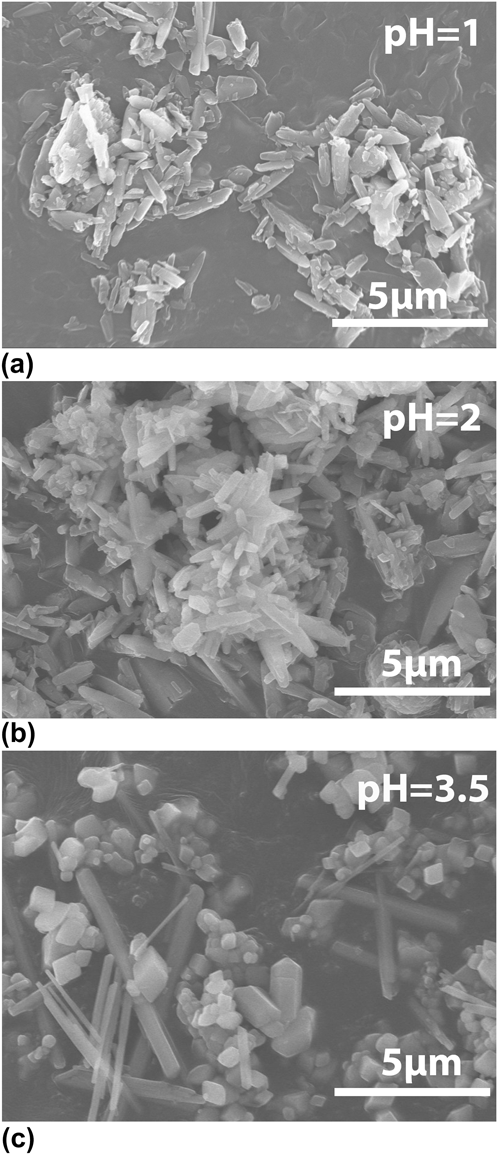
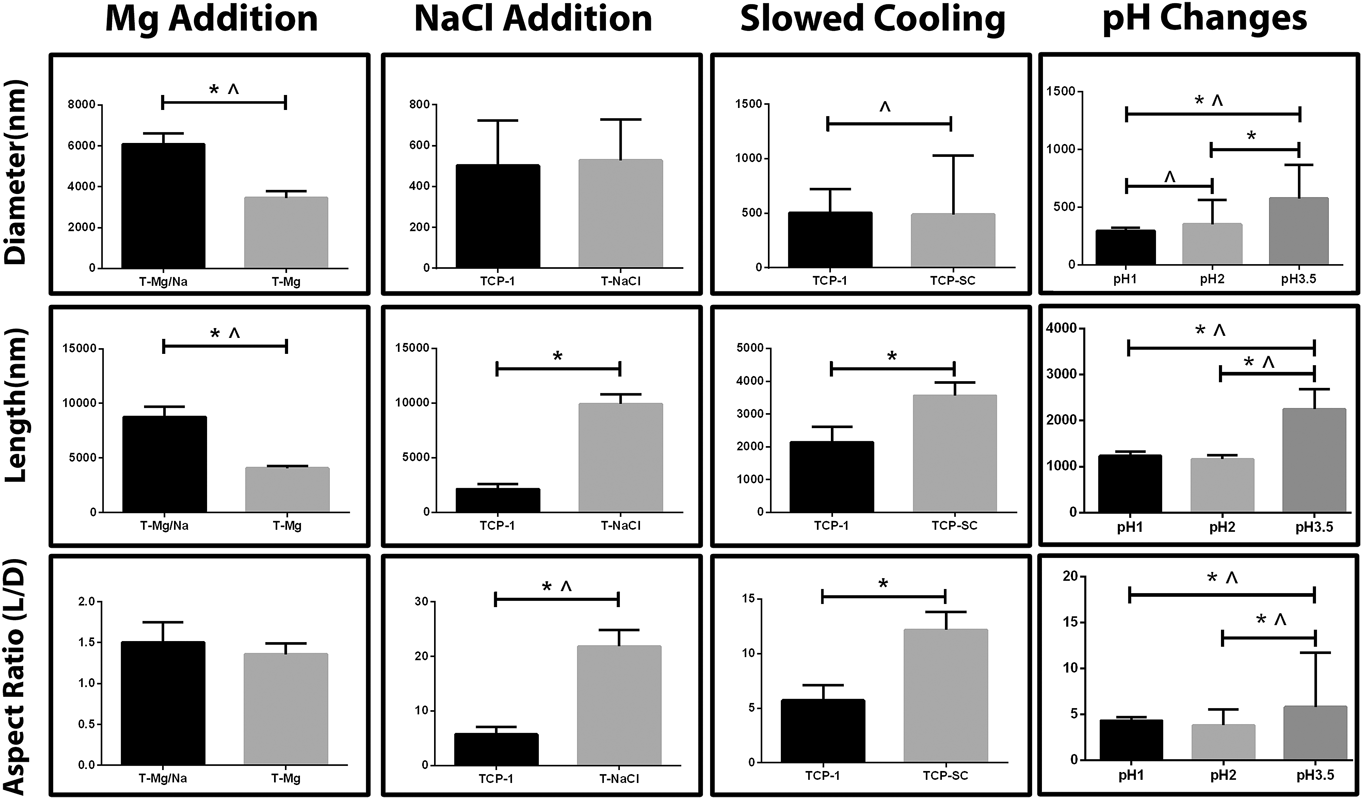
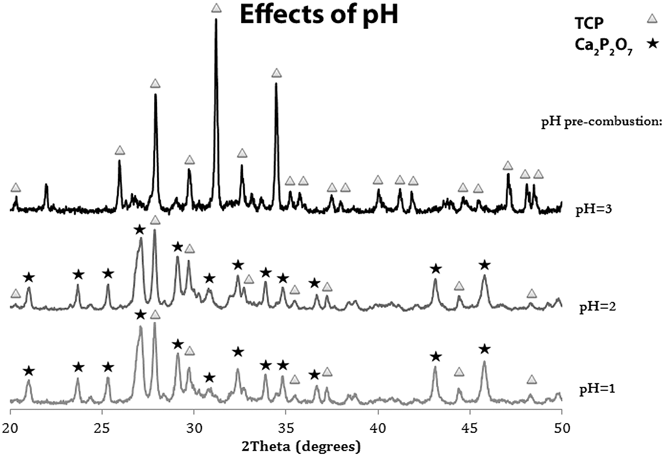
Nanoparticles generated from synthesis methods which examined the effects of pH had average diameters of 295, 352, and 576 nm and average lengths of 1.2, 1.2, and 2.3 µm for pH values of 1, 2, and 3.5, respectively. Lowering the pH of the precombustion solution to 2 or below in the TCP-1 promoted the formation of a narrower distribution of high aspect ratio nanoparticles and significantly decreased the average particle diameter, length, and aspect ratio (Figs. 6 and 11). Synthesis methods with pH = 1 or 2 resulted in Ca2P2O7 particles, whereas a pH of 3 resulted in the formation of β-TCP (Fig. 7). This indicates that the pH of the solution is an essential parameter to control both the phase and morphology of CaP nanoparticles produced by MASCS.
SEM micrographs of CaP nanoparticles formed with precombustion solutions at pH = 1, 2, or 3.
Quantitative analysis of particle diameters, lengths, and aspect ratios for the different synthesis methods. * indicates differences in means are statistically significant; ^ indicates differences in variances are statistically significant (F test); P < 0.05 considered statistically significant.
XRD patterns of CaP nanoparticles with precombustion solutions at pH = 1, 2, or 3. Characteristic peaks are marked: β-TCP, gray triangles and Ca2P2O7, black stars.
D. Cation chemistry impacts nanoparticle formation
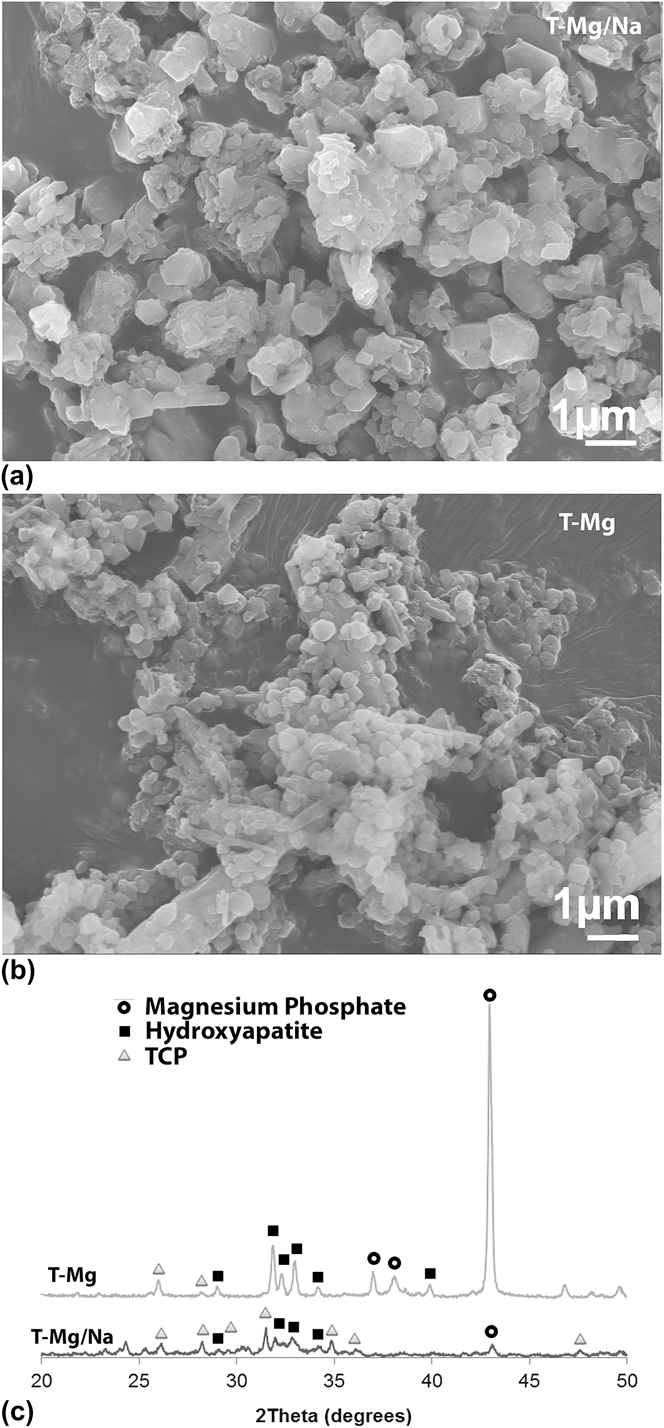
Changing the initial nitrate salt from sodium nitrate to magnesium nitrate changes the resultant aspect ratio and CaP phase (Fig. 8). Equiaxed micron-sized particles are formed when both sodium nitrate and magnesium nitrate are used and nitrate content is held constant (T-Mg/Na formulation) [Fig. 8(a)]. However, a complete substitution of sodium nitrate with magnesium nitrate (T-Mg) causes a significant reduction in particle diameters from 6 to 3.5 μm and lengths from 9 to 4 μm (Fig. 11). The use of magnesium nitrate promotes the formation of larger equiaxed particles as compared to TCP-1 (Figs. 8 and 11). XRD analysis demonstrated that the resultant material is not a pure calcium phosphate phase but a biphasic composition of hydroxyapatite and magnesium phosphate [Fig. 8(c)].
SEM micrographs and XRD patterns of samples with the addition of magnesium nitrate as oxidant. SEM of (a) sodium and magnesium nitrate or (b) magnesium nitrate alone. (c) XRD traces. Characteristic peaks are marked: HA, black squares; β-TCP, gray triangles; and magnesium phosphate, black open circles.
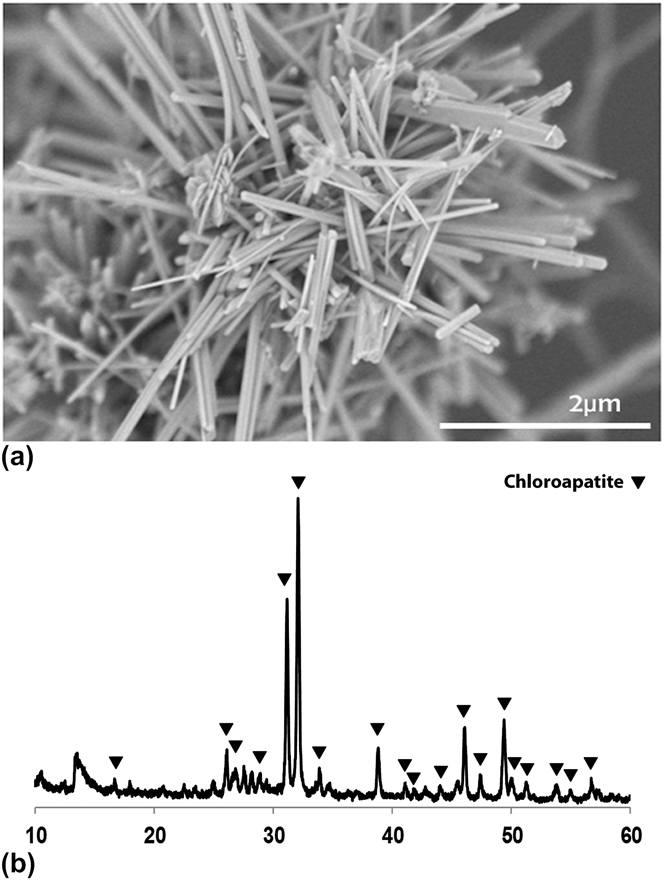
SEM micrograph and XRD pattern for samples with the addition of sodium chloride to the TCP-1 synthesis method. (a) SEM and (b) XRD pattern of calcium chloroapatite with peaks marked in black triangles.
Unlike the divalent cation magnesium, the addition of sodium chloride to the precombustion solution resulted in a molten salt flux with increased amounts of monovalent sodium cations and chloride anions. Particles generated from the T-NaCl formulation had similar nanoparticle diameters (∼500 nm) as compared to the TCP-1 formulation but their average length and aspect ratio were significantly increased from around 2.1 to 9.9 µm and from 5.7 to 21.8, respectively (Figs. 9 and 11). However, the addition of sodium chloride also changed the final particle phase to chloroapatite as confirmed by XRD (Fig. 7) indicating that molten salt flux ions incorporated into the resulting crystal structure.
E. Slowed cooling rate increases nanoparticle aspect ratio
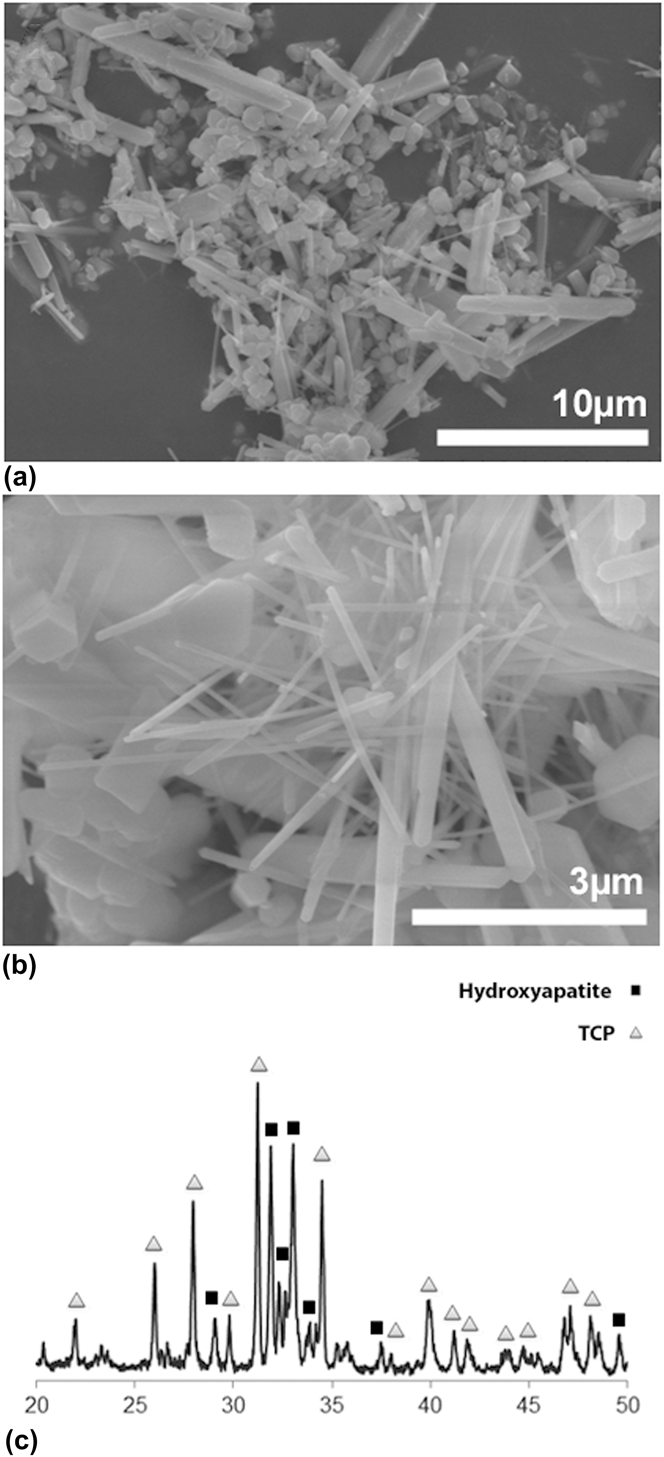
Slowing the cooling rate of the molten salt bath following MASCS with alumina insulation generated a heterogeneous distribution of nanoparticle morphologies with a significant increase in the average particle length from 2 to 3.5 µm and increased the average aspect ratio from 5.7 to 12.1 (Figs. 10 and 11). However, a large number of the formed particles were still equiaxed. The slowed cooling rate also induced the formation of a biphasic HA/β-TCP composition (Fig. 10).
SEM micrographs and XRD patterns for TCP-SC nanowhiskers: (a) Low- and (b) high-magnification SEM, (c) XRD pattern. Characteristic peaks are marked: HA, black squares; β-TCP, gray triangles.
IV. DISCUSSION
To extend our knowledge of the impact of the processing parameters of MASCS, we systematically investigated the impact of precombustion solution pH, cation chemistry, fuel-to-oxidant ratio and cooling kinetics. As previously observed, the majority of particles formed using the HA formulation were confirmed as highly crystalline hydroxyapatite and had high aspect ratios around 7. In contrast, the majority of nanoparticles formed with the TCP-1 formulation were equiaxed, and a small number of nanoparticles had high aspect ratios [Figs. 2(b), 2(e), and 2(h)]. The BCP formulation had a mixed population of both high aspect and equiaxed particles, which may correspond to high aspect ratio nanoparticles being HA and equiaxed particles being TCP.Reference Park, Ryu, Yoon, Stevens and Park23
A small number of high aspect ratio nanoparticles in the TCP-1 formulation appeared to be nanotubes with crystalline features [Figs. 2(h) or 2(j)]. Although hollow calcium phosphate whiskers were recently reported on the macro scale,Reference García-Tuñón, Couceiro, Franco, Saiz and Guitián26 as to our knowledge, there has been no previous report in the literature of nanoscale hollow calcium phosphate nanoparticles with high aspect ratios. Inorganic hollow structures have unique properties that can be advantageous in medical applications.Reference Son, Bai and Lee27,Reference Son, Bai and Lee28 As a material, calcium phosphate may be more beneficial than the other nanotube structures used such as carbon, silica, and iron oxide, owing to its high biocompatibility and chemical similarity to mammalian bone.Reference Wagner and Bhaduri1 It is unclear as to the number of nanowhiskers that are hollow and their chemical composition. XRD does not discern traces for individual particles and identifies phases by bulk powder diffraction. Therefore, it is possible that none of these nanowhiskers are actually of the β-TCP variant. Further experimentation is necessary for validation and characterization of these nanoparticles.
Fuel-to-oxidant ratios in oxidant-fuel mixtures have been shown to have a significant effect on the combustion synthesis as well as the characteristics of the nanoparticles synthesized. Stoichiometric redox reactions are represented when φe = 1, whereas a fuel lean reaction occurs with φe > 1 and a fuel rich reaction at φe < 1.Reference Jain, Adiga and Pai Verneker25 Spontaneous combustion is a phenomenon which occurs when the sum of exothermic reactions occurring in the solution, resulting from microwave irradiation and solution heating, exceeds the ignition temperature. The fuel-to-oxidant ratio is therefore an important predictor for both the intensity (temperature) and duration of the combustion flame. It has previously been suggested that the nitrate should be in excess of the fuel by at least 50% for optimum combustion of urea and nitrate.Reference Burgos-Montes, Moreno, Colomer and Fariñas29
Jalota et al.Reference Jalota, Tas and Bhaduri24 demonstrated the importance of fuel-to-oxidant ratios for a Ca/P ratio of 1.67. The BCP formulation, while having the same Ca/P ratio as the HA formulation, had a φe of 0.02 as compared to 0.5 in HA. Therefore, this reduction in the fuel-to-oxidant ratio is responsible for the formation of a biphasic mixture of β-TCP and HA nanoparticles with two distinct morphologies [HA = Figs. 2(a), 2(d), and 2(g); BCP = Figs. 2(c), 2(f), and 2(i)] which we have, again, demonstrated here. Therefore, in this work, we further varied the relative fuel-to-oxidant ratio (φe) for a Ca/P ratio of 1.5 and found that increasing the fuel-to-oxidant ratio resulted in chemical phases tending toward HA at higher fuel-to-oxidant ratios. Additionally, monetite peaks were observed up to φe = 0.30, which has been previously observed in reactions where the bath solution in hydrothermal methods was unable to buffer the release of H+ ions (i.e., low pH).Reference Zhang and Darvell11
Although the increase in urea may optimize the combustion ratio and prevent the formation of monetite, there is a concomitant increase in pH as urea decomposes. An increase in pH from the decomposition of urea may also serve to drive the resultant calcium phosphate to be HA, which is stable at higher pH.Reference Dorozhkin and Epple2 Similarly, increased HA formation at higher urea concentrations was observed. The effect of pH in synthesis methods with Ca/P = 1.5 was examined without the addition of urea. We found that the nanoparticles tended toward an intermediate calcium phosphate, Ca2P2O7, at lower pH and transitioned to β-TCP as they approached pH = 3.5. Therefore, solution pH during precursor formation (i.e., precombustion) by MASCS is an important factor in predicting final chemical phases. It will be important in a future work to fully characterize the effects of pH on combustion temperature as well as flame characteristics (temperature, duration, etc.).
The presence of ample nitrate is imperative for combustion and an optimal ratio between nitrate and urea likely exists. However, the choice of a nitrate source is also important as it may introduce other ions which may impact crystal growth kinetics. The addition of magnesium nitrate as either a partial (T-Mg/Na) or full (T-Mg) substitution for sodium nitrate increased the particle diameter and length as compared to TCP-1 and changed the phase from pure β-TCP to biphasic compositions of HA and magnesium phosphate. Magnesium and calcium are both divalent cations, and it has been previously shown that the presence of magnesium may interfere with calcium phosphate formation through a competitive binding inhibition mechanism.Reference Chowdhury, Kunou, Nagaoka, Kundu, Hoshiba and Akaike30 During precursor formation, magnesium and calcium may preferentially bind to the phosphate ions and precipitate out. It is thought that nanowhiskers form by a sequential nucleation–solidification–nucleation method along the c-axis.Reference Tas19 There was a near complete loss of high aspect ratio nanoparticles in the magnesium formulations, indicating that preferential growth along the c-axis was inhibited. Magnesium phosphates in biphasic compositions tend to form amorphous structures resulting in a change in morphology.Reference Zhou, Luchini and Bhaduri31
Next, the effect of sodium chloride on the resultant nanoparticle morphology was examined owing to the fact that sodium is a monovalent ion. Sodium chloride was added so as to double the molar concentration of sodium (T-Na) as compared to the TCP-1 formulation. There was a significant increase in the aspect ratio in the T-Na group, but the change in salt flux composition resulted in chloroapatite formation. The use of CaCl2 as flux was recently reported as resulting in chloroapatite whisker formation (i.e., micron size).Reference García-Tuñón, Couceiro, Franco, Saiz and Guitián26 Therefore, while the presence of sodium does not appear to inhibit c-axis growth, Cl− in the molten salt bath becomes incorporated in the forming crystals and changes the chemical phase to chloroapatite.
Finally, the effect of a slowed cooling rate on nanoparticle formation was evaluated. Alumina is transparent to microwave irradiation but is a thermal insulator. Therefore, the heating and combustion reaction kinetics did not significantly differ, but the cooling rate was slowed due to insulating effects. There was a significant increase in the aspect ratio from about 5 to 12, with the appearance of some nanoparticles with aspect ratios in excess of 20. This reduction in cooling rate resulted in the growth of more high-aspect-ratio nanowhiskers as compared to the TCP-1 synthesis method but also promoted biphasic transformations to generate a biphasic HA/β-TCP composition.
V. CONCLUSIONS
This study examined parameters for synthesizing calcium phosphate nanowhiskers with a Ca/P ratio of 1.5 by MASCS. Changes in the fuel-to-oxidant ratio or pH were shown to have an effect on both morphology and phase. Particles synthesized in precombustion solutions at pH = 1 or 2 had decreased nanoparticle diameter (∼300 nm) and length (∼1 µm) as compared to particles synthesized at pH = 3.5 (diameter ∼ 500 nm and length ∼ 2 µm). The presence of magnesium prevented the formation of high aspect ratio nanoparticles and resulted in biphasic compositions of HA and magnesium phosphate, likely through a competitive inhibition mechanism. The addition of sodium chloride maintained the average particle diameter as compared to TCP-1 but increased the particle length and aspect ratio nearly four-fold, but also resulted in incorporation of chloride ions into the resulting crystal structure to produce chloroapatite nanowhiskers.
A slow cooling rate of the molten salt bath following MASCS resulted in particles with a two-fold increase in aspect ratio, from 5.7 in the TCP-1 formulation to 12.2 in the TCP-SC, while concomitantly resulting in a biphasic composition of HA and β-TCP. It may be beneficial in a future work to study an extended range of cooling rate parameters (such as quenching) to more fully understand its role in nanoparticle growth and phase formation. Additionally, further understanding of the influence of the salt flux and fuel source is needed.
ACKNOWLEDGMENT
This work was funded by NSF CMMI 0753479.
Based in part on the dissertation submitted by D.E. Wagner for the Ph.D. degree in Biomedical Engineering, the University of Toledo, Toledo, OH, 2011.