Introduction
Several authors have suggested that low concentrations of progesterone may lead to an abrupt termination of pregnancy (McDonald et al., Reference McDonald, Nichols and McNutt1952; Robinson et al., Reference Robinson, Leslie and Walton1989; Stevenson and Mee, Reference Stevenson and Mee1991). Excessive rates of embryonic loss and fetal mortality are economically detrimental to the sheep industry, and a portion of this loss can be attributed to progesterone concentrations during pregnancy. Dixon et al. (Reference Dixon, Knights, Winkler, Marsh, Pate, Wilson, Dailey, Siedel and Inskeep2007) found an increase in complete and partial pregnancy loss at day 25 of gestation in ewes that had less than 2 ng/ml of progesterone. In addition to the work in sheep, a number of studies in cows have determined a positive relationship between plasma progesterone concentrations and retention of pregnancy (Starbuck et al., Reference Starbuck, Dailey and Inskeep2004; Larson et al., Reference Larson, Butler and Currie2007). Plasma progesterone concentrations may be reduced due to a decrease in production and/or an increase in hepatic catabolism.
Cytochrome P450 enzymes (1.14.14.1; unspecific monooxygenase) are involved in the metabolism of a number of important endogenous compounds including vitamin D3 activation, catabolism of cholesterol to bile acids and metabolism of all major classes of steroid hormones (Waxman et al., Reference Waxman, Lapenson, Aoyama, Gelboin, Gonzalez and Korzekwa1991). Cytochrome P450 enzymes are also involved in the metabolism of a number of different xenobiotics, and in humans the cytochrome P450 3A sub-family is generally regarded as the most important catabolic enzyme involved in drug metabolism (Yuan et al., Reference Yuan, Madani, Wei, Reynolds and Huang2002). The two major enzymes involved in progesterone catabolism belong to the cytochrome P450 2C and 3A sub-families and the major metabolites are 21-hydroxyprogesterone and 6β-hydroxyprogesterone, respectively (Murray, Reference Murray1991 and Reference Murray1992). It is well-accepted that although both endogenous (Waxman et al., Reference Waxman, Lapenson, Aoyama, Gelboin, Gonzalez and Korzekwa1991) and exogenous (Bidstrup et al., Reference Bidstrup, Bjornsdottir, Sidelmann, Thomsen and Hansen2003) substrates of cytochrome P450 enzymes can stimulate their activity (i.e. phenobarbitol, pyridine), very few studies have attempted to down-regulate cytochrome P450 enzymes. The current study addresses this concept in an attempt to increase peripheral concentrations of progesterone.
Smith et al. (Reference Smith, Stinefelt, Blemings and Wilson2006) found that ewes orally gavaged with sodium propionate, a gluconeogenic substrate, had increased serum concentrations of insulin and decreased progesterone clearance compared to ewes orally gavaged with an isocaloric amount of sodium acetate (non-gluconeogenic). Hepatocytes cultured in the presence of insulin had a dose-dependent reduction in the fractional rate constant for progesterone decay compared to controls (Smith et al., Reference Smith, Stinefelt, Blemings and Wilson2006). However, these experiments by Smith et al. (Reference Smith, Stinefelt, Blemings and Wilson2006) failed to address whether this decrease in progesterone clearance was due to a decrease in cytochrome P450 activity associated with the increase in insulin secretion following ingestion of propionate. Therefore, the objectives of the current experiment were to determine the pattern of insulin secretion after supplementing feed with sodium acetate or sodium propionate and to determine any association between the differential patterns of insulin secretion with the hepatic activity of cytochrome P450 2C and 3A, and progesterone clearance after feeding.
Material and methods
Animals and feeding
Sixteen ovariectomized (2 months prior to experimentation) mature Suffolk ewes were blocked by weight (86 ± 2 kg) and randomly assigned to experimental treatments. Ewes were housed individually in 3 m × 3 m pens for the experimental period of 10 days. Animal care and use were according to a protocol approved by the West Virginia University Animal Care and Use Committee (ACUC no. 04-0604). Ewes had ad libitum access to water and were fed 3 kg/day of a standard ewe ration containing 50% corn silage, 38% triticale haylage and 12% soybean meal (on an as-fed basis). The DM content of the mixed ration was 38.4% with 17.6% crude protein (CP) and 62.1% total digestible nutrients (DM basis). Equal portions of the ration (1 kg as-fed basis) were offered three times daily at 0600, 1400 and 2200 h. The ewes consumed all of the feed within 45 min. Ewes were allowed 2 days (day 1 and day 2) to adapt to the individual housing and the new feeding schedule (ewes were previously fed 3 kg/day once a day) before either propionate or acetate supplementation. Sodium acetate (lot 085K0003; Sigma Chemical Co., St Louis, MO, USA) or sodium propionate (lot 035K0039; Sigma Chemical Co.) was then introduced in a stepwise manner with one-third of the treatment provided on day 3, followed by two-third of the full treatment on day 4 and finally full treatment for the subsequent days (day 5 through day 10). The treatments consisted of either 0.7 M sodium acetate or 0.4 M sodium propionate dissolved in 200 ml of water. These amounts of acetate and propionate were calculated to be isocaloric (0.146 Mcal). The sodium acetate solution or sodium propionate solution was mixed into the above ration directly before each feeding.
Sample collection and hormone analysis
On day 9, a jugular catheter was inserted prior to the morning feeding. At 0600 h, ewes were fed their respective diets. One hour after feeding, at 0700 h, ewes were given 5 mg of progesterone, dissolved in ethanol, intravenously (i.v.) in the left jugular vein. This time was chosen because insulin concentrations were still elevated in the propionate-supplemented compared to the acetate-supplemented ewes in a preliminary experiment. Blood samples (∼5 ml) were collected via the right jugular vein before progesterone administration and at 2, 4, 6, 8, 10, 15, 20 and 30 min after progesterone administration into pre-chilled EDTA containing tubes. Progesterone concentrations from the jugular plasma samples were determined using radioimmunoassay (RIA) (Sheffel et al., Reference Sheffel, Pratt, Ferrell and Inskeep1982) with a sensitivity of 100 pg/ml and intra- and inter-assay CV of 4.6% and 7.6%, respectively. Fractional rate constants of progesterone clearance (k, ng/ml per min) were determined for each individual ewe using SigmaPlot 8.0 (SPSS, Chicago, IL, USA) using the equation Pt = P 0 e−kt (Pt = progesterone at any given time (ng/ml); P 0 = initial progesterone concentration (ng/ml); t = time (min)), which describes a first-order exponential decay curve. Miller et al. (Reference Miller, Williams, Pipes and Turner1963) found two distinct half-lives after injecting radioactive progesterone i.v. The first half-life was 3.6 min and represented the mixing or equilibration phase. In a more recent study, using ovariectomized dromedary camels, the initial half-life of progesterone was found to be 2.7 min and represented tissue equilibration (Al-Busadah and Homeida, Reference Al-Busadah and Homeida2004). From these studies, we can ascertain that the primary decay of progesterone within the first 6 min is due to the uptake of progesterone into all organs, while the slower decay after equilibrium represents the clearance of progesterone via the liver.
On day 10, blood was collected (∼5 ml) via jugular venipuncture directly before feeding (0600 h) and at 15, 30, 60, 90, 120, 180, 240 and 300 min after feeding into pre-chilled EDTA containing tubes. Jugular plasma insulin was measured using an insulin RIA kit (lot TKIN 870; Diagnostic Products Corporation, Los Angeles, CA, USA) with a sensitivity of 0.05 nM and intra- and inter-assay coefficients of variation of 1.4% and 7.8%, respectively. The assay was validated to measure sheep insulin in our laboratory. Briefly, plasma dilutions from two ewes were assayed separately for insulin and found to be parallel with the standard curve.
Liver biopsies were taken on day 10 following the 60 min blood sampling (modified from Navarre and Pugh, Reference Navarre and Pugh2002). The wool was removed from the animals’ right side and the skin was scrubbed twice with betadine. After determining the location of the ninth intercostal space, 2% lidocaine hydrochloride (lot 6050804, Columbus Serum, Columbus, OH, USA) was administered as a local anesthetic. The skin was punctured using a scalpel and a 14 gauge × 16 cm biopsy needle (J-118A; Jorgensen Laboratories Inc., Loveland, CO, USA) was used to collect the liver samples. Liver samples were submerged in 100 mM potassium phosphate buffer containing 1 mM EDTA (pH 7.4; phosphate buffer), placed on ice, and immediately used to isolate microsomes to determine cytochrome P450 2C and 3A activities.
Microsomal preparation
Liver samples submerged in phosphate buffer were homogenized using a glass Dounce homogenizer. Homogenized samples were centrifuged at 10 000 × g for 10 min. The pellets were discarded, and the supernatants were centrifuged at 100 000 × g for 60 min (modified from Nelson et al., Reference Nelson, Huang and Moody2001). The microsomal pellets were resuspended in 500 μl of phosphate buffer. Microsomal recovery was determined using a cytochrome c reductase (reduced nicotinamide adenine dinuleotide phosphate; NADPH) assay kit, as described in the manufacturer’s protocol (product number CY0100; Sigma Chemical Co.). Briefly, cytochrome P450 reductase activity was assessed in homogenized tissue (all sub-cellular parts) and subsequently in microsomal preparations from the same sample, and used to standardize cytochrome P450 2C and 3A activity in all subsequent samples. The recovery of cytochrome P450 reductase ranged from 70% to 90%.
Enzymatic activity
Enzymatic reactions for determining both cytochrome P450 2C and 3A activity contained 25 μl of microsomes, 75 μl of phosphate-buffered NADPH (lot 104K7034; Sigma Chemical Co.; final concentration of 250 μM) and 100 μl of substrate or phosphate buffer loaded into UV star 96-well plates (PGC Scientifics, Frederick, MD, USA). The oxidation of NADPH was determined by measuring the amount of light absorbed at 340 nm (37°C) for 5 min using a Spectra max Plus plate reader (Molecular Devices, Inc., Sunnyvale, CA, USA). The extinction coefficient for NADPH (6220 l/mol per cm) was then used to determine oxidized NADPH mol per unit time. Cytochrome P450 2C and 3A reactions remained linear for 10 min after the addition of NADPH and were standardized using cytochrome P450 reductase activity (U/ml) as a housekeeping enzyme.
Cytochrome P450 2C activity was measured as the non-ketoconazole-inhibitable, omeprazole-dependent oxidation of NADPH (modified from Li et al., Reference Li, Weidolf, Simonsson and Andersson2005). A stock solution of omeprazole (a specific substrate for cytochrome P450 2C; lot 115K1873, Sigma Chemical Co.) was prepared in dimethyl sulfoxide at a concentration of 250 mM, and then diluted with phosphate buffer to reach a final concentration of 2.5 mM omeprazole in each enzymatic reaction containing substrate. All cytochrome P450 2C reactions contained 1% dimethyl sulfoxide either with or without omeprazole. Due to the reactivity of omeprazole with cytochrome P450 2C and 3A, a 15-min pre-incubation with 250 μM ketoconazole (lot 121H0524; Sigma Chemical Co.) was used to inhibit cytochrome P450 3A (Bidstrup et al., Reference Bidstrup, Bjornsdottir, Sidelmann, Thomsen and Hansen2003), and sufficient inhibition was determined by measuring cytochrome P450 3A activity with nifedipine, as described below. A sample of liver microsomes was serially diluted in phosphate buffer to validate the cytochrome P450 2C activity assay, a linear relationship was observed between the rates of omeprazole-dependent oxidation of NADPH v. the activity of cytochrome P450 reductase (NADPH oxidation = 44.77 (cytochrome P450 reductase) − 0.04).
Cytochrome P450 3A activity was measured as the nifedipine-dependent oxidation of NADPH (modified from Guengerich et al., Reference Guengerich, Martin, Beaune, Dremers, Wolff and Waxman1986 and Bork et al., Reference Bork, Muto, Beaune, Srivastava, Lloyd and Guengerich1989). A stock solution of nifedipine (a specific substrate for cytochrome P450 3A; lot 115K1285; Sigma Chemical Co.) was prepared in acetone at a concentration of 20 mM and then diluted with phosphate buffer to reach a final concentration of 200 μM nifedipine in each enzymatic reaction containing substrate. All enzymatic reactions for cytochrome P450 3A contained 1% acetone either with or without nifedipine. A sample of liver microsomes was serially diluted with phosphate buffer to validate the cytochrome P450 3A activity assay, a linear relationship was observed between the rates of nifedipine-dependent oxidation of NADPH v. the activity of cytochrome P450 reductase (NADPH oxidation = 6.86 (cytochrome P450 reductase) − 0.01).
Statistical analysis
The fractional rate constants of progesterone decay were determined for each ewe using Regression Wizard of SigmaPlot 8.0 using the equation Pt = P 0 e−kt. The effects of treatments on cytochrome P450 2C, cytochrome P450 3A and progesterone clearance (k) were tested with ANOVA using the GLM procedure of SAS (SAS software v. 9.1; SAS Institute Inc., Cary, NC, USA). The effect of treatment on insulin concentrations was tested using a repeated measures ANOVA of the MIXED procedure of SAS with an autoregressive covariance structure, and means were separated using PDIFF option of the LSMEANS statement. Least square means and s.e. are reported. Statistical significance was declared at P ⩽ 0.05.
Results
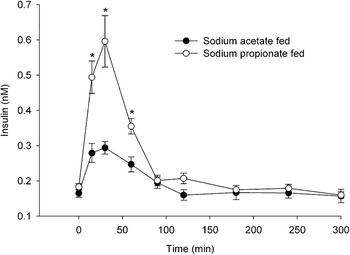
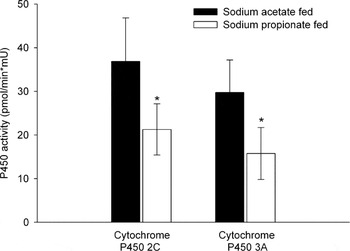
Insulin concentrations before feeding (0600 h) were not different for ewes in the acetate and propionate groups (Figure 1). At 15 and 30 min after feeding, ewes supplemented with propionate had elevated insulin concentrations compared to the acetate-supplemented group. At 60 min after feeding, insulin concentrations in propionate-supplemented ewes began to decline, but were still elevated compared to the acetate-supplemented group. From 90 to 300 min, insulin concentrations did not differ within or between groups and were the same as time 0 (i.e. 8 h after the previous feeding). Cytochrome P450 2C activity in liver tissue from the propionate-supplemented ewes was reduced to nearly one-half of the activity in liver tissue from acetate-supplemented ewes (Figure 2). Similarly, cytochrome P450 3A activity was reduced in the liver of the propionate-supplemented ewes to nearly one-half of that in acetate-supplemented ewes.
Plasma concentrations of insulin in ewes supplemented with 0.7 M sodium acetate or 0.4 M sodium propionate relative to feeding at 0 min. *Difference between treatment groups at a given time point (P < 0.05).

Enzymatic activity of cytochrome P450 2C and cytochrome P450 3A in liver biopsies taken 1 h after feeding in ewes supplemented with sodium acetate or sodium propionate. Enzymatic activities are scaled to cytochrome P450 reductase (housekeeping enzyme). *Difference between treatments (P ⩽ 0.05).

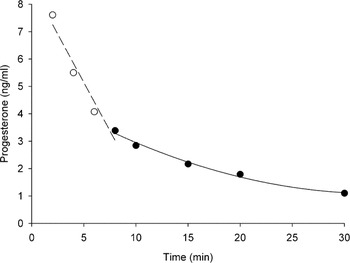
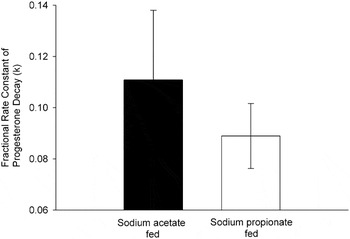
Progesterone concentrations prior to the injection of 5 mg of progesterone were less than 0.3 ng/ml (data not shown). In the sodium propionate-supplemented and sodium acetate-supplemented ewes, 72% of the injected progesterone, 10 min after progesterone administration, had been either catabolized by the liver or taken up by extra-hepatic tissues. Due to the high variability of progesterone clearance from the peripheral circulation during the first 6 min of blood sampling, which represents the equilibration phase, these time points were not used in determining the fractional rate constants of progesterone clearance (open circles; Figure 3). Fractional rate constants of progesterone clearance (k) were determined for each individual ewe utilizing progesterone concentrations from 8, 10, 15, 20 and 30 min relative to progesterone injection (closed circles; Figure 3). Although progesterone clearance was numerically lower in the propionate-supplemented group (0.089 ± 0.013 ng/ml per min v. 0.111 ± 0.027 ng/ml per min), this difference was not significant (Figure 4).
Mean progesterone concentrations from acetate-supplemented ewes, which depicts two half- lives. The open circles represent total tissue uptake of progesterone (equilibration phase). The closed circles were used in determining the fractional rate constants of progesterone clearance for each individual ewe.

Fractional rate constants of progesterone clearance (k, ng/ml per min) in ewes supplemented with sodium acetate or sodium propionate. First-order exponential decay curves (Pt = P 0 e−kt) were fit to each ewe in order to determine k.

Discussion
Insulin concentrations peaked 30 min after feeding in both the acetate- and propionate-supplemented groups. The increase in insulin concentration was three times greater in propionate-supplemented as compared to acetate-supplemented ewes, which would be expected because of the gluconeogenic properties of propionate. A single oral gavage of sodium acetate or sodium propionate in sheep elevated concentrations of acetate or propionate in the hepatic portal vein, which were sustained for 4 h when compared to sheep not orally gavaged with either acetate or propionate (Smith et al., Reference Smith, Stinefelt, Blemings and Wilson2006). An oral gavage of sodium propionate resulted in greater insulin concentrations in peripheral circulation at 30 and 60 min as well as higher glucagon concentrations at 30, 60 and 120 min v. animals orally gavaged with sodium acetate (Smith et al., Reference Smith, Stinefelt, Blemings and Wilson2006). The peak insulin concentration and the pattern of the insulin response curve to either propionate or acetate found in this study were similar to the response observed by Smith et al. (Reference Smith, Stinefelt, Blemings and Wilson2006), despite the difference in the method of propionate or acetate delivery between the two studies.
Murray (Reference Murray1992) found that the most abundant hydroxylation products of progesterone in the hepatic microsomes of sheep were 6β, 21, 2α and 16α hydroxyprogesterone metabolites. A member of the cytochrome P450 2C sub-family was involved in metabolizing progesterone into its 21-hydroxyprogesterone metabolite, and a member of the cytochrome P450 3A sub-family was involved in metabolizing progesterone into its 6β-hydroxyprogesterone metabolite, as determined by measuring different metabolites after immuno-inhibition with specific anti-P450s (Murray, Reference Murray1991 and Reference Murray1992). The primary pathway for hepatic steroid inactivation begins with the hydroxylation of the steroid by a member of the cytochrome P450 enzyme super-family (You, Reference You2004). After the initial inactivation of the steroid (phase I biotransformation), the compound will undergo a second phase of metabolism (phase II biotransformation) whereby the steroid is conjugated to glucuronide and sulfate. Because of the added polarity from the conjugation reactions, these lipophilic compounds can be secreted more easily in the urine or feces (i.e. pregnanediol; You, Reference You2004).
Dean and Stock (Reference Dean and Stock1975) observed a decrease in overall hepatic microsomal cytochrome P450s during pregnancy, which led them to hypothesize a biological control mechanism to elevate serum progesterone concentrations by decreasing catabolism. In the current experiment, activities for cytochrome P450 2C and 3A were lower 1 h after feeding in ewes supplemented with sodium propionate compared to sodium acetate. This time is congruent with the time over which propionate supplementation resulted in increased insulin concentrations. A relationship between insulin and cytochrome P450 expression was proposed when Barnett et al. (Reference Barnett, Gibson, Wolf, Flatt and Ioannides1990) and Shimojo et al. (Reference Shimojo, Ishizaki, Imaoka, Junae, Fujii and Okuda1993) observed enhanced expression of cytochrome P450 3A during insulin-dependent diabetes, which was reversed by insulin replacement. Saad et al. (Reference Saad, Thomas, Schawalder, Waechter and Maier1994) found a dose-dependent decrease in testosterone hydroxylation at the 6β position when rat hepatocytes were cultured with increasing concentrations of insulin (1, 10 and 100 nM), a reaction that is catalyzed primarily by the cytochrome P450 3A sub-family with minimal contribution from cytochrome P450 2C13 (Ryan and Levin, Reference Ryan and Levin1990). Woodcroft and Novak (Reference Woodcroft and Novak1999) showed that pyridine-mediated induction of cytochrome P450 2E1 mRNA and protein abundance could be substantially decreased when cells were cultured in the presence of 1 μM insulin for 96 h. Sidhu and Omiecinski (Reference Sidhu and Omiecinski1999) found a decreased expression of cytochrome P450 3A1 in rat hepatocytes cultured with 1 μM insulin and then exposed to phenobarbitol, a known cytochrome P450 3A1 inducer. They also found a lower induction of cytochrome P450 3A1, due to phenobarbitol exposure, in cells exposed to physiological (i.e. 1 nM) concentrations of insulin (Sidhu and Omiecinski, Reference Sidhu and Omiecinski1999). Lemley et al. (Reference Lemley, Butler, Butler and Wilson2008) found a dose-dependent decrease in the relative abundance of both CYP2C and CYP3A mRNA with increasing insulin dosage in dairy cows that were challenged with a hyperinsulinemic-euglycemic clamp. Therefore, we believe the decreased cytochrome P450 2C and 3A activities in the sodium propionate-supplemented animals compared to the sodium acetate-supplemented animals are most likely due to the effect of elevated insulin concentrations at the time of biopsy.
Bedford et al. (Reference Bedford, Harrison and Heap1972 and Reference Bedford, Harrison and Heap1974) reported metabolic clearance rates (volume of blood cleared of progesterone per unit time) for progesterone to be approximately 3.5 to 4.3 l/min in sheep. Splanchnic clearance rate of progesterone could account for 30% of total progesterone metabolism, and 70% to 90% of the total clearance of progesterone in these splanchnic organs was cleared by the liver (Bedford et al., Reference Bedford, Harrison and Heap1974). In these studies, metabolic clearance rates were determined by infusing progesterone into the peripheral circulation via the jugular vein, which is different from the in vivo source of progesterone, primarily produced in the ovary or the gravid uterus both of which are part of the portal drained viscera. Therefore, others have reported greater hepatic progesterone clearance, by infusing progesterone into the lower extremities because this progesterone is first taken to the liver for metabolism before entering whole-body circulation. Gurpide (Reference Gurpide1975) estimated a 70% hepatic extraction of progesterone in pregnant ewes, and Parr et al. (Reference Parr, Davis, Miles and Squires1993) determined that 96% of the progesterone entering into the liver and gut region was metabolized by these tissues.
Taking into account the fact that the liver is the primary site of progesterone catabolism, several researchers have correlated liver blood flow through the hepatic portal vein and the metabolic clearance rate of progesterone. Parr et al. (Reference Parr, Davis, Miles and Squires1993) showed that a 40% increase in liver blood flow in sheep almost doubled the metabolic clearance rate of progesterone. Similar studies in the dairy cow by Sangsritavong et al. (Reference Sangsritavong, Combs, Sartori, Armentano and Wiltbank2002) determined a positive correlation between liver blood flow and metabolic clearance rate of progesterone. The relationship was determined to be metabolic clearance rate = 1.38 (liver blood flow) + 0.10 (r 2 = 0.92). However, these studies compared the above and below maintenance diets, which differed in energy, protein and DMI. This strong correlation between progesterone concentration and liver blood flow strengthens the notion that the primary site of progesterone catabolism is the liver, and that altering liver physiology may be a plausible approach to raising progesterone concentrations during early stages in pregnancy when progesterone is essential. In the current work, consumption of dietary DM was equal for the two treatment groups, and dietary treatments were both isocaloric and isonitrogenous. These diets resulted in a 45% decrease in the activity of progesterone catabolic enzymes, without confounding changes in DMI or the amount of CP available.
In the current work, progesterone clearance from peripheral circulation was not statistically different; however, propionate-supplemented ewes had numerically lower fractional rate constants of progesterone decay compared to acetate-supplemented ewes. A power test, using the means and variances generated from these data, estimated that 40 observations for each treatment would be needed to detect a significant effect of treatment. After an oral gavage of sodium acetate or sodium propionate, serum progesterone concentrations began to diverge at 30 min in anestrous ewe lambs given an intramuscular injection of 20 mg of progesterone and were greater in the sodium propionate ewes at 3 and 4 h after treatment (Smith et al., Reference Smith, Stinefelt, Blemings and Wilson2006). Lower progesterone clearance was then associated with elevated insulin concentrations rather than elevated glucagon concentrations. Utilizing a murine hepatocyte cell line, a dose-dependent decrease in the fractional rate constant of progesterone clearance was observed with increasing concentrations of insulin (Smith et al., Reference Smith, Stinefelt, Blemings and Wilson2006). These results are in agreement with work by Selvaraju et al. (Reference Selvaraju, Agarwal, Karche, Srivastava, Majumdar and Shanker2002), who demonstrated that a subcutaneous injection with long-acting bovine insulin elevated serum progesterone concentrations in repeat breeder cows.
In the current work, cytochrome P450 activity was reduced 45% (or reduced to 55%) with propionate supplementation; however, we observed no difference in progesterone fractional clearance rates. Administering progesterone into the jugular vein may have limited hepatic catabolism and/or increased extra-hepatic uptake of progesterone from the plasma. In summary, ewes supplemented with sodium propionate (a gluconeogenic substrate) had elevated concentrations of insulin at 15, 30 and 60 min after feeding as well as lower cytochrome P450 2C and 3A activity compared to ewes supplemented with sodium acetate (energy control).
Insulin concentrations may play an important role in regulating progesterone catabolic enzyme activity in the liver. Identifying feedstuffs that can increase insulin without concomitantly increasing liver blood flow might help mitigate excessive progesterone catabolism without the need to reduce intake below maintenance requirements. Progesterone production and/or hepatic catabolism of progesterone both impact peripheral concentrations of progesterone as well as uterine and embryonic exposure to progesterone. Therefore, elucidating a mechanism that decreases the activity of progesterone catabolic enzymes could provide for increased progesterone concentrations and possibly decreased embryonic loss.