Introduction
Debate about the prevalence of depression and other affective disorders amongst the very old has been ongoing for many years (Snowdon, Reference Snowdon2001). Recent projections suggest that between 11% and 27% of those aged >80 years report clinical depression or a degree of depressive symptomology that adversely impacts on quality of life (Stek et al., Reference Stek, Gussekloo, Beekman, van Tilburg and Westendorp2004; Bergdahl et al., Reference Bergdahl2005; Steffens et al., Reference Steffens, Fisher, Langa, Potter and Plassman2009). The variability in prevalence estimates has been attributed to the instruments used, comprising either clinical measures (e.g. the Composite International Diagnostic Interview (CIDI); Kessler and Ustun, Reference Kessler and Ustun2004) or self-report scale of depressive symptomology (e.g. Goldberg Depression Scale (GDS); Goldberg et al., Reference Goldberg, Bridges, Duncan-Jones and Grayson1988). Furthermore, many studies typically comprise very small sample sizes (n = 200–700) across varying age boundaries (70+, 80+) and precludes comparisons with samples of younger adults from the same population. Indeed, in contrast to these smaller studies, many large epidemiological studies find evidence of declining prevalence of depression with increasing age (Korten and Henderson, Reference Korten and Henderson2000; Blazer and Hybels, Reference Blazer and Hybels2005), though one major review suggests no clear association of depression with increasing age (Jorm, Reference Jorm2000). In Australia, the 2007 National Survey of Mental Health and Well-being (NSMHWB) estimated that whilst 1 in 5 adults experienced a common mental disorder in the 12 months prior to the survey, declining prevalence rates were found with increasing age, though this may be a consequence of including younger adults as a reference point who typically report higher rates of poor mental health (ABS, 2007). However, more recent projections have indicated that around 8% of Australians aged over 60 experience clinically significant depression (Pirkis et al., Reference Pirkis2009). Whilst lower prevalence of depression in old age has been attributed to selection and survival mechanisms (Henderson, Reference Henderson1994), questions have been raised about the validity of these findings that describe low prevalence of mental ill-health in older adults (O'Connor, Reference O'Connor2006). Indeed, there are significant limitations in many larger epidemiological surveys which may adversely impact the validity of conclusions drawn from such samples. For example, failure to select and discriminate between older adults has been identified as a weakness in other national surveys (Beekman et al., Reference Beekman, Copeland and Prince1999; Chong et al., Reference Chong2001; Kessler et al., Reference Kessler2010). Within the NSMHWB, adults aged 84 years of age and over were not sampled, and comparisons with the oldest-old in an earlier 1997 NSMHWB survey (ABS, 1997) are restricted since the earlier survey failed to discriminate between those participants aged over 74.
Several explanations have been posited for the disparity between depression prevalence and increasing age (Snowdon, Reference Snowdon2001). These include the representativeness of large epidemiological surveys which, by design, often fail to capture those older adults temporarily or permanently residing in institutions (e.g. hospitals, nursing homes) where the prevalence of depression is considerably higher (Anstey et al., Reference Anstey, von Sanden, Sargent-Cox and Luszcz2007), and where the influence of comorbid physical disability and dementia afflicts many of those in residential care (Drayer et al., Reference Drayer2005). Further confounding factors relate to the reliance on self-report in many survey designs (Lyness et al., Reference Lyness1995), the greater influence of selection or response bias, inadequate sampling of the oldest old and a lack of differentiation of the “young-old” and “old-old” in analysis (Jorm, Reference Jorm2000). There is clearly a need to supplement existing prevalence rates of mental ill-health for the very old (aged 75+), who are typically under-represented in large epidemiological studies (Forsell et al., Reference Forsell, Jorm, von Strauss and Winblad1995).
The aim of this study is to contribute to the debate regarding the prevalence of depression in the oldest old by addressing the issue of inadequate sampling of older adults in community-based survey research. The Dynamic Analyses to Optimise Ageing (DYNOPTA) project sought to develop a more suitable dataset to inform policy decisions relevant to the health of an aging population by pooling data from nine Australian longitudinal studies of aging (Anstey et al., Reference Anstey2010b). With an overall baseline sample size exceeding 50,000 participants aged between 45 and 101 years, DYNOPTA data provide an opportunity to examine and differentiate the profile of probable depression from middle age to the oldest old. The individual studies that contributed data to DYNOPTA used different scales to assess depression or depressive symptoms; therefore we describe the harmonization process used to construct a common measure for our analyses. The paper then provides estimates of probable depression by age and gender from the baseline DYNOPTA dataset and compares these results with prevalence rates from the 1997 and 2007 Australian NSMHWB surveys.
Methods
Participants
Data for the analyses were drawn from the baseline wave of the DYNOPTA project (Anstey et al., Reference Anstey2010a). The DYNOPTA project pools data from nine Australian longitudinal studies of aging and comprises the Australian Longitudinal Study of Ageing (ALSA), the Australian Longitudinal Study of Women's Health (ALSWH), the Australian Diabetes, Obesity and Lifestyle study (AusDiab), the Blue Mountains Eye Study (BMES), the Canberra Longitudinal Study (CLS), the Household Income and Labour Dynamics in Australia Study (HILDA), the Melbourne Longitudinal Study of Healthy Ageing (MELSHA), the PATH Through Life Study (PATH), and the Sydney Older Person Study (SOPS). The harmonization of existing studies, by pooling data or parallel analysis, is increasingly recognized as an important method that adds value to and addresses the limitations of investment in individual longitudinal studies (Noale et al., Reference Noale2005; Piccinin and Hofer, Reference Piccinin, Hofer, Hofer and Alwin2008). Overall, there were 50,652 respondents in the pooled DYNOPTA dataset at baseline, with data collected between 1990 and 2001. For this study, participants (N = 44,812) were aged 45–106 years and were included if they were living in the community (i.e. not in aged-care institutions) and had completed a depression inventory in the contributing study from which they were drawn. Being drawn from population studies, participants reflected the demographic structure of Australia. Most participants were born in Australia (73.6%), with most of the overseas-born Australians coming from Europe (20.2% of the DYNOPTA total), and speaking English at home (93.9%). Similar to other Australian surveys, it is common that Australian Aboriginals are under-represented and this was also reported in DYNOPTA with only 0.7% reporting themselves as of Aboriginal or Torres Strait Islander origin (Anstey et al., in press).
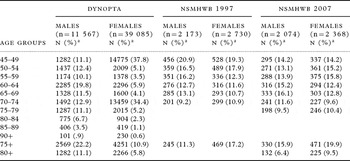
Because of the inclusion of age-cohort and gender-specific studies, the profile of the DYNOPTA sample does not map directly onto the Australian population. However, weights were constructed to address potential selection and response bias and to reflect the Australian population more accurately, adjusting for sex, age and geographical area. For comparative purposes, we also report data from the public-accessible 1997 and 2007 NSMHWB conducted by the Australian Bureau of Statistics (ABS). Frequencies of participants by study, age and gender are indicated in Table 1.
Age and Gender Profiles of the DYNOPTA and NSMHWB 97/07 datasets

a Percent within sex.
Measures: developing a harmonized depression measure
Depression is a key focus of DYNOPTA, yet no single mental health scale was common to all the contributing studies in the DYNOPTA project. However, each study included one of four scales that are frequently used to assess depression or affective disorders, each with sound psychometric properties, demonstrated validity and clinical utility. Therefore, our approach to develop a common measure of “probable depression” for DYNOPTA was to standardize and equate these scales from the contributing studies and to define a common cut-point across scales to identify the DYNOPTA respondents with likely or probable depression. Three of the mental health scales used produce an approximately normal distribution of scores: the Mental Health Index from the Short-Form Health Survey-36 (SF-36) used in the ALSWH mid-life and older samples, AusDiab, BMES, and HILDA; the Mental Health Components Summary score from the shorter SF-12 used in the PATH study; and the Centre for Epidemiological Studies Depression Scale (CESD) used in the ALSA and SOPS studies. The SF-36 Mental Health Index is a valid measure of mental health and, specifically, of depression in epidemiological studies worldwide (Skapinakis et al., Reference Skapinakis, Lewis, Araya, Jones and Williams2005; Gill et al., Reference Gill2006). The Mental Health Component Score from the SF-12 was computed using the RAND scoring method (Windsor et al., Reference Windsor, Rodgers, Butterworth, Anstey and Jorm2006), and has also been validated against DSM criteria (Rumpf et al., Reference Rumpf, Meyer, Hapke and John2001) for depression (AUC = 0.92) (Gill et al., Reference Gill, Butterworth, Rodgers and Mackinnon2007). The CESD has strong validation as a measure of depression in community samples across the lifespan (Radloff and Teri, Reference Radloff, Teri and Brink1986; Beekman et al., Reference Beekman, Kriegsman, Deeg and van Tilburg1995; Reference Beekman1997). Inspection of the distributions of these different scales (not reported here) revealed consistency between gender across age groups. While each scale can be considered a measure of the same latent construct, it was not appropriate simply to derive standardized scores given the differences in the profile of respondents assessed by each scale (e.g. age, sex). All but one scale (the SF-12) included strong representation of women aged 75–79 years. Therefore, baseline data from all studies using the same continuous mental health scales (SF-36 and CESD) were pooled, rescaled based on the pooled standard deviation, and then centered around the mean score for women aged 75–79. The SF-12 was only used in a sample aged 60–64 years and so a similar rescaled score was constructed and centered on the score for 60–64 year old women. However, to equate this score with that derived from the SF-36 and CESD, the deviation observed in the pooled dataset between 75–79 and 60–64-year -old women was subtracted from the rescaled SF-12 score. The fourth mental health scale in the pooled DYNOPTA project, the Psychogeriatric Assessment Scales (PAS), used in the CLS and MELSHA studies, is a count of depressive and affective symptoms and therefore is not appropriately included in the standardized depression scale that was created based on the continuous scales that are approximately normally distributed. However, the PAS has excellent validity against the clinical diagnoses of depression (Jorm et al., Reference Jorm1995) and was included with the other scales to derive a binary variable reflecting the presence of “probable depression”.
In defining a binary measure of “probable depression”, we considered the various cut-points for the individual scales reported in the literature that have been validated to depression as defined by the Diagnostic and Statistical Manual of Mental Disorders (DSM) and International Classification of Disease (ICD). SF-36 and SF-12 Mental Health scores were reversed to make higher scores reflecting poorer mental health in line with the other scales. Established cut-off scores of 60, 55 and 50 (reversed to reflect our reversed SF-scale) corresponded to scores of 1.0, 1.2 and 1.6, respectively, on the standardized DYNOPTA depression (Rumpf et al., Reference Rumpf, Meyer, Hapke and John2001; Skapinakis et al., Reference Skapinakis, Lewis, Araya, Jones and Williams2005; Gill et al., Reference Gill2006; Reference Gill, Butterworth, Rodgers and Mackinnon2007). Similarly, CESD cut-offs of 16, 18 and 20 corresponded to scores of 1.0, 1.2 and 1.6, respectively, on the standardized depression scale (Radloff and Teri, Reference Radloff, Teri and Brink1986; Beekman et al., Reference Beekman, Kriegsman, Deeg and van Tilburg1995; Reference Beekman1997). Cut-offs of 4 and 5 on the PAS (Jorm et al., Reference Jorm1995) indicated scores of 1.2 and 1.8, respectively, on the standardized DYNOPTA depression scale. We therefore decided to make our cut-off at 1.5 standard deviations above the mean on the standardized DYNOPTA depression score as an indicator of “probable depression” since this reflects a mid-point between the various cut-offs for the CESD, SF-36 and PAS. Several logistic regression models (not reported here) tested for differences between the originally administered mental health scale types on the likelihood of being classified as “probably depressed” on the DYNOPTA harmonized variable, controlling for gender and age. Each logistic model was run with a different depression scale as the reference category. Consistently, no differences between the original scale types were reported, which supports the utility in harmonizing the different depression scales since the likelihood of being classified as “probably depressed” was found to be unrelated to the scale originally administered.
Statistical analysis and weighted prevalence
All analyses were undertaken with weighted data; the NSMHWB surveys provide weights, whilst weights had to be developed for DYNOPTA and have been described previously (Anstey et al., Reference Anstey2010b). The DYNOPTA weights sought to account for differences in probabilities of participation selection adjusted to the Estimated Resident Population for the relevant year, sex, age-group and geographical area of each study. Weighted prevalence estimates of probable depression in the DYNOPTA dataset were estimated in STATA version 10 (STATA/IC 10.1 for Windows, 2009, College Station, TX: StataCorp LP) using the svyset command and subsequently using svy proportion commands to indicate proportions of probable depression according to age and sex groupings. These were then compared to the prevalence estimates from the NSMHWB. Cross-sectional logistic regression analysis then tested the effects of age and sex groupings on participants’ likelihood of being “probably depressed” on the weighted DYNOPTA and NSMHWB data. As the majority of DYNOPTA mental health scales used four-week references in their mental health items, monthly prevalence is reported. Due to DYNOPTA's large sample size, we set an α threshold (p <0.01) that would reduce the likelihood of making a Type II error, but we also draw our conclusions based on the size of effect and its relative standard error, reported by the 95% confidence intervals (CI).
Results
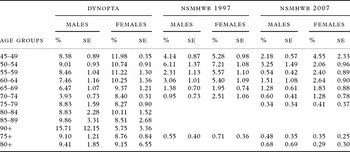
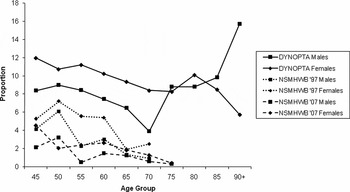
Weighted prevalence of participants with probable depression in DYNOPTA and depression in the 1997 and 2007 NSMHWB surveys are reported in Table 2. Because of design differences between the two NSMHWB surveys in the types of depressive disorders studied, a binary variable was computed for both NSMHWB surveys, which indicated diagnosis of any affective disorder in the preceding 12 months. Since the DYNOPTA “probable depression” variable was developed from mental health scales that have been validated against clinical depression, this would also make fair comparison between the NSMHWB surveys and DYNOPTA. Higher proportions of probable depression for both gender were indicated in DYNOPTA (Figure 1).
Comparison of Probable Depression in DYNOPTA (weighted) with NSMHWB 97/07 by sex and age

Proportions of DYNOPTA participants reporting “probable depression” in comparison with NSMHWB 97/07 by sex and age group.
Note: Whilst there are changes in the weighted prevalence of probable depression from midlife to late-life, particularly for those males aged 70–74 and 90+, a review of the Standard Error (Table 2) would indicate that probable depression prevalence is stable. This is subsequently formally tested and reported in this paper for the DYNOPTA and NSMHWB surveys.

In DYNOPTA, 7.83% and 10.25% of males and females indicated probable depression at baseline. Females were more likely to report probable depression (OR = 1.36; 95% CI: 1.20–1.54; p < 0.001). Increasing age appeared to be associated with a small decline in the likelihood of probable depression; however, this small effect failed to reach our stringent level of significance (OR = 0.98; 95% CI: 0.96–0.99; p = 0.019), and suggests that any change is not substantial. A quadratic effect for age was included to determine whether a non-linear relationship between age and likelihood of probable depression was reported, but this was not indicated in the DYNOPTA sample (OR = 1.00; 95% CI: 0.99–1.00; p = 0.205). We then re-ran our analysis, grouping ages into five-year age groupings in order to reduce the effect of small numbers of participants in the older ages. Increasing age was still associated with a small decline in the likelihood of probable depression, but again this effect failed to reach our level of significance (OR = 0.91; 95% CI: 0.83–0.99; p = 0. 049), although the wide CI indicates a large degree of error in this reported effect. A quadratic effect was again not reported (OR = 1. 01; 95% CI: 0.99–1.02; p = 0.373). Analysis of gender interactions indicated no differences between gender across linear (OR = 1.02; 95% CI: 0.98–1.07; p = 0.337) or quadratic age effects (OR = 1.00; 95% CI: 0.99–1.00; p = 0.234). These results are surprising since the proportion of probable depression, particularly for males, indicates an increase in late life depression, but this was not identified as statistically significant. A piecewise regression analysis, where two slopes were estimated for those aged 45–69 years and those aged 70 and older, failed to identify an increase in probable depression with increasing age. Given the size of the standard errors reported for the older participants, it is clear that even DYNOPTA lacks the necessary power to provide a definitive answer to the question about late-life depression.
Analysis of the two NSMHWB surveys indicated both similar and disparate findings in comparison with each other and DYNOPTA. Similar to our results for the DYNOPTA sample, the 1997 survey indicated females (OR = 1.53; 95% CI: 1.08–2.17; p < 0.019) to be more likely to report any affective disorder, though given the sample size and the large confidence interval, our stringent level of statistical significance was not met. More clearly, gender differences were not reported in the 2007 survey (OR = 1.49; 95% CI: 0.82–2.70; p = 0.183). For analyses of both the 1997 and 2007 surveys, analysis of age was undertaken with five-year age groupings because one of the studies only provided this level of data. In both the 1997 (OR = 1.16; 95% CI: 0.89–1.50; p = 0.266) and 2007 (OR = 0.92; 95% CI: 0.87–0.96; p = 0.518) surveys, a linear effect for age was not reported. Quadratic effects for increasing age were investigated and a significant quadratic age effect (OR = 0.92; 95% CI: 0.87–0.96; p < 0.001) was reported in the 2007 survey only, suggesting that there is a curvilinear relationship between the slope of change in depression with increasing age in the 2007 survey only. Similar to the results for DYNOPTA, gender interactions indicated no differences between gender across linear (1997 NSMHWB: OR = 1.26; 95% CI: 0.65–2.46; p = 0.485; 2007 NSMHWB: OR 1.01; 95% CI: 0.80–1.27; p = 0.957) or quadratic age effects (1997 NSMHWB: OR = 0.97; 95% CI: 0.85–1.12; p = 0.704; 2007 NSMHWB: OR 1.00; 95% CI: 0.99–1.01; p = 0.927).
Discussion
The aim of this paper was to obtain prevalence estimates for probable depression in older Australians and to compare the findings from the DYNOPTA project with two gold-standard surveys of mental health and well-being in Australia. Whilst the findings are derived from clinical depression inventories, they are based on validated measures of depression and there are, nevertheless, a number of important findings with implications for interpreting the course of depression in late-life.
Demographic effects are reported on depressive symptomology across age. The DYNOPTA project indicated that females were more likely to report higher levels of probable depression. This contrasts with clinical findings that have previously been reported (Forsell et al., Reference Forsell, Jorm, von Strauss and Winblad1995) though the larger survey may be more powerful to detect differences between gender. However, for those males who survived to very old age (+85), proportions of probable depression prevalence appeared to be considerably higher. Further analyses of these gender differences are warranted. Consistent with other findings (Korten and Henderson, Reference Korten and Henderson2000; Blazer and Hybels, Reference Blazer and Hybels2005), analysis of both the DYNOPTA and NSMHWB surveys indicated no change in the likelihood of depression with increasing age. However, a significant quadratic effect in the 2007 survey indicated a sharper decline in the rate of change with increasing age. In contrast, analysis of the DYNOPTA dataset indicated a possible trend of linear age effects for chronological and five-year age groupings but these failed to reach our prescribed level of significance. Nevertheless, the range of the corresponding confidence intervals appears to indicate greater variability with increasing age. Considering DYNOPTA's sample size, it was surprising that a clear and consistent pattern was not reported. That some effects just failed to reach a predefined level of statistical significance should not discourage further research, particularly studies to determine whether these findings are consistent within a longitudinal context. DYNOPTA's longitudinal design would certainly facilitate further research to investigate these findings over time. At a population level, these baseline prevalence rates appear to support the argument that age is mostly unrelated to the likelihood of being depressed.
These findings indicate a significant point of departure between DYNOPTA and NSMHWB surveys. The differences in the association between age and likelihood of depression between DYNOPTA and NSMHWB surveys could be attributed to the greater number of DYNOPTA participants, which increases the representation of older participants and which includes participants in age groups that are not sampled in the national surveys. DYNOPTA clearly offers several advantages over existing Australian data relating to the prevalence of probable depression in late life. The weighted DYNOPTA dataset appears to address previous concerns about the low prevalence of depression in two large nationally weighted datasets (O'Connor, Reference O'Connor2006). In comparison with the NSMHWB, DYNOPTA prevalence estimates are higher across the ages reported here. This is surprising since those in residential care, where higher rates of depression are typically reported (Anstey et al., Reference Anstey, von Sanden, Sargent-Cox and Luszcz2007), were excluded from the DYNOPTA analysis. However, the higher prevalence of probable depression could have been attributed to those participants with comorbid conditions who lived in the community.
Despite the robustness of the findings in such a large population-based study like DYNOPTA, there are limitations to be considered. First, most studies that contributed data to the DYNOPTA project did not include clinical psychiatric assessment. However, all studies did incorporate at least one well-validated measure of depression or depressive symptomology with validated cut-points against clinical mental health assessment. Nevertheless, the use of self-report questionnaires which were harmonized into our depressive measure may have overestimated caseness of clinical depression. However, the DYNOPTA prevalence still indicates a higher level of depressive symptoms reported by participants, which although not clinically significant may still impact adversely on quality of life. Finally, one issue that should be addressed in future analyses of the DYNOPTA population is to explain the increase in the higher proportion of probable depression in males aged over 75, a change that was not statistically significant. This could be explained in part by the fact that the proportion of probable depression for those aged 75–85 years was in line with younger DYNOPTA age groups and increased variability in older ages, which is particularly highlighted by the much higher prevalence of probable depression for males aged over 89 years. Whilst 15.71% reported probable depression, a standard error of 12.15% suggests that even by harmonizing several longitudinal studies of aging, these oldest-old participants are still under-represented to power these analyses. Still, it was surprising that even a piecewise regression analysis failed to indicate an increase in the proportion with probable depression for the oldest males. Longitudinal analyses of the DYNOPTA dataset may provide more substantive conclusions about the course of late-life depression.
We have described the construction of a common depression metric in the DYNOPTA project that pooled data from nine Australian longitudinal studies of aging to derive prevalence estimates for the oldest-old and we have demonstrated that scores on a standardized depression scale are unrelated to the depression scale that was administered by the original study. This highlights the utility in combining survey data for subsequent analysis, which may seek to identify the precursors of probable depression in late-life. There is clearly a need to extend the cross-sectional analyses reported here to distinguish aging from cohort effects (Jorm, Reference Jorm2000), and further analysis of the DYNOPTA dataset will certainly help to resolve this issue and the role of aging and associated diseases that increase the likelihood of probable depression in old age.
Conflict of interest
None.
Description of authors' roles
All authors have read and approved the final version of this paper. RAB harmonized the data, undertook the statistical analysis, and wrote the paper. PB supervised harmonization of the data, undertook some statistical analysis, and wrote the paper. TDW advised on harmonizing the data and contributed to writing the paper.
ML supervised the data collection and advised on the harmonization, and contributed to writing the paper. LAR advised on the harmonizing the data and contributed to writing the paper. KJA supervised the data collection and advised on the harmonization, and contributed to writing the paper.
Acknowledgments
This work was supported by a National Health and Mental Medical Research Council grant (410215). The data on which this research is based were drawn from several Australian longitudinal studies including: the Australian Longitudinal Study of Ageing (ALSA), the Australian Longitudinal Study of Women's Health (ALSWH), the Australian Diabetes, Obesity and Lifestyle Study (AusDiab), the Blue Mountain Eye Study (BMES), the Canberra Longitudinal Study of Ageing (CLS), the Household, Income and Labour Dynamics in Australia study (HILDA), the Melbourne Longitudinal Studies on Healthy Ageing (MELSHA), the Personality And Total Health Through Life Study (PATH) and the Sydney Older Persons Study (SOPS). These studies were pooled and harmonized for the Dynamic Analyses to Optimize Ageing (DYNOPTA) project. All studies would like to thank the participants for volunteering to take part in the respective studies. Details of all studies contributing data to DYNOPTA, including individual study leaders and funding sources, are available on the DYNOPTA website (http://DYNOPTA.anu.edu.au). The findings and views reported in this paper are those of the authors and not those of the original studies or their respective funding agencies.