Implication
A new model has been developed which can simulate milk production and body condition score change of dairy cows through lactation under grazing conditions. For both milk production and body condition score change the model shows good accuracy. From a farmer’s perspective, the model, once adapted with an user-friendly interface, can be used at individual animal level or at a herd level. Clear management practices can be tested by applying certain strategies around pasture and animal management to determine their effects on milk production and body condition score change.
Introduction
Modelling dairy systems can be complex not only due to the interactions between all the intrinsic components of the cow (breed, genetic potential, parity, etc.) but also due to the interaction of the animal with the environment (feeding system, type of housing, time of year, stage of lactation, etc.) and the management (dairy farmer decisions) to which animals are subjected (nutrition status, breeding, etc.) (Buckley et al., Reference Buckley, O’Sullivan, Mee, Evans and Dillon2003; Martin and Sauvant, Reference Martin and Sauvant2010a). A model if useful must be capable of simulating all of the components of a system in a realistic fashion and the model must be capable of reacting to the changing components of the system. The ever increasing pressures placed on farmers due to changing circumstances (e.g. milk price volatility and climate change) means that there is increased pressure with all decisions taken on the farm. Having a model that can react in a meaningful way across these different questions allows farmers to optimise their decision-making process continually. For example, when feeding the dairy cow, predicting the partition between milk production and body condition score (BCS) change throughout lactation either in grazing or indoor feeding would allow better decisions to be made on farm but these challenges present a major obstacle for modellers all over the world (Friggens et al., Reference Friggens, Ingvartsen and Emmans2004; Faverdin et al., Reference Faverdin, Baratte, Delagarde and Peyraud2011; Baudracco et al., Reference Baudracco, Lopez-Villalobos, Holmes, Comeron, Macdonald, Barry and Friggens2012). The model presented here deals with this issue in a grazing context.
A key feature in the development of a model is the evaluation and validation step. The most common way to validate a model is to compare with existing experimental data. The E-Cow model (Baudracco et al., Reference Baudracco, Lopez-Villalobos, Holmes, Comeron, Macdonald, Barry and Friggens2012) has been evaluated using two independent experimental data sets from New Zealand and Argentina. The statistical analyses used were the concordance correlation coefficient (CCC) and the relative prediction error (RPE) to evaluate the daily herbage dry matter intake, the milk yield (MY) and live weight change. The milk production and herbage intake of the French model GrazIN (Delagarde et al., Reference Delagarde, Faverdin, Baratte and Peyraud2011a; Faverdin et al., Reference Faverdin, Baratte, Delagarde and Peyraud2011) was validated by comparing model outputs against experimental data using the mean square prediction error on 206 experimental herds (Delagarde et al., Reference Delagarde, Valk, Mayne, Rook, González-Rodríguez, Baratte, Faverdin and Peyraud2011b).
The objective of this paper was to present and evaluate a new model in terms of milk production and BCS prediction. The strength of this model lies on an update of the idea of the partition of the energy and protein intake between the milk production and the body reserve in pasture-based systems (Bruce et al., Reference Bruce, Broadbent and Topps1984). The goal was to integrate the genetic progress and it consequences in terms of intake, BCS change in the partition of the nutrient intake depending on the lactation stage and the genetics of the animal. Data from two different studies in two different countries (Ireland and France) that operate grass-based systems of differing levels of intensity and supplementation were used to evaluate the model. The model has also been evaluated on its ability to respond to changes in genetics of the animals, herbage allowance (HA) and concentrate supplementation with outputs compared with expected outputs based on published literature.
Material and methods
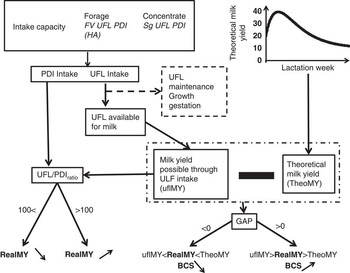
The herd dynamic milk (HDM) model is a dynamic model developed in C++ capable of simulating the performance of dairy animals (from birth to death) individually, with a daily time step. Briefly, the model allows differentiated management of different groups of animals (mainly through feeding). The groups included are calves (0 to 90 days), three groups of heifers (90 days to 365 days, 12 to 24 months and over 24 months), lactating cows and the dry cows. Each animal is simulated individually permitting a precise representation of each animal on the farm. At calving, the dam (heifer or cow) is transferred from the heifer or dry cow group to the lactating cow group and one or two calves are added to the calf groups depending on the prolificacy (adjusting for mortality). This paper will describe in detail the cow component of the model during lactation in terms of milk production and BCS change. The young stock, dry cow, fertility and mortality aspect are described in the Supplementary Material S1 to S5. A flow diagram of the lactation element of the model is presented in Figure 1.
Flow diagram representing the running of the model to predict the real milk yield (MY) of an animal. FV=fill value; UFL=unité fouragère lait; PDI=protéine digestible dans l’intestin; HA=herbage allowance; BCS=body condition score.

Inputs and outputs of the model
The initial herd demography is specified via the description of the individual animals presented at the start of the simulation. The information required for every animal is age (day); BW (kg); theoretical potential maximum MY (kg/day) for the calf (used when she becomes a cow), heifer and cow; as well as the day in gestation and the number of inseminations (since the last calving for the cows) for the heifer and cow; and finally the day in lactation and the BCS and BCS at calving for the cow. The BCS scale used within this model is the 0 to 5 scale (Bazin et al., Reference Bazin, Augeard, Carteau, Champion, Chiliard, Disenhaus, Durand, Espinasse, Gascoin, Godineau, Jouanne, Ollivier and Remond1984). The theoretical potential maximum MY is defined as the theoretical maximum daily milk production of the mature cow (parity 3 and more) at peak of lactation with a static BCS and BW. The period of simulation is expressed in monthly time blocks and can be from 1 month to at least in theory an infinite time. The initialisation of the model also requires the user to input key management decisions that include the maximum number of animals on farm, information about insemination (breeding period; maximum number of inseminations), dry off (specific date or day in lactation) and culling criteria. In terms of feeding, the HA, feed energy and protein content are needed as well as allocation of supplementary feed whether concentrate or forage. The main daily outputs of this model are the dry matter intake, milk production, BCS and BW for every animal for everyday of the year. These outputs can be summarised for the cattle by week of lactation or by week of the year. The total milk produced per cow per lactation is also available.
Herd feeding and dairy cow performance
The model incorporates the French feeding system (Faverdin et al., Reference Faverdin, Delagarde, Delaby and Meschy2010; Faverdin et al., Reference Faverdin, Baratte, Delagarde and Peyraud2011), which was modified to integrate milk production, BCS and BCS change of animals. In this paper, the milk output from the model is expressed in kilogram of standard milk (MY) at 4.0% of fat and 3.1% of protein content, corresponding to the equation of Faverdin et al. (Reference Faverdin, Delagarde, Delaby and Meschy2010) (Supplementary Equation S12).
Intake and nutrient supply
The INRA (Institut National de la Recherche Agronomique) feeding system (INRA, 2010) was selected to model the nutrient intake within the model. The intake when housed and at grazing is calculated based on the GrazeIn model as described in Delagarde et al. (Reference Delagarde, Faverdin, Baratte and Peyraud2011a and Reference Delagarde, Valk, Mayne, Rook, González-Rodríguez, Baratte, Faverdin and Peyraud2011b), Faverdin et al. (Reference Faverdin, Baratte, Delagarde and Peyraud2011). In simple terms, intake of the animal is the lesser of the intake permitted by the intake capacity and fill value (FV) of the feed, the HA and the intake needed to meet the requirements. The intake at grazing is calculated depending on the possible intake of the housed animal corrected for HA and time at pasture. The quality of the forage or grass is characterised by its energy value (unité fouragère lait (UFL)), protein (protéine digestible dans l’intestin (PDI)) and FV. The FV of a forage is an inverse function of its ingestibility and is calculated by the ratio of intake of the reference forage to voluntary dry matter intake of the considered forage (Faverdin et al., Reference Faverdin, Baratte, Delagarde and Peyraud2011). The quality of the concentrate is determined by its UFL and PDI. The concentrate has no fixed FV, its FV is calculated dependent on the substitution rate between concentrate and forage, which represents the metabolic regulation of intake and depends on the percentage of concentrate and the total energetic value of the diet (Faverdin et al., Reference Faverdin, Baratte, Delagarde and Peyraud2011).
Calculation of the theoretical milk yield and maximum theoretical mobilisation
In this model, the BCS change and the MY are modelled together in an interlinked way depending on the interaction between the nutrient, feed intake and partition. These two components depend mainly on following two factors.
Factor 1 – a BCS pool at calving (maximum theoretical mobilisation (theoMOBmax)), expressed in units of BCS. This BCS pool gives the theoretical maximum mobilisation of the dairy cow through the lactation.
Factor 2 – the milk yield gap (MYgap) between the theoretical milk yield (theoMY) of the cow and the MY allowed by her energy intake, expressed in kilogram of milk.
The theoMY of the cow is driven by her maximum theoretical milk yield (theoMYmax), expressed in kilogram of standard milk and is dependent on the parity and the day of lactation (LacD):
 $$\eqalignno{{\rm theoMY}\,{\equals}\, & {\rm coeff}\_\,{\rm parity}\,{\times}{\rm theoMYmax}\cr &{\times}\left( {0.27{\plus}6.47{\times}e^{{{\minus}0.013{\times}{\rm LacD}}} {\minus}\,6.20{\times}e^{{{\minus}0.017{\times}{\rm LacD}}} } \right)\cr &$$
for primiparous,
 $$\eqalignno{{\rm theoMY}\,{\equals}\, & {\rm coeff}\_\,{\rm parity}\,{\times}\,{\rm theoMYmax}\cr &{\times}\left( {0.25{\plus}2.95{\times}e^{{{\minus}0.015{\times}{\rm LacD}}} {\minus}\,2.70{\times}e^{{{\minus}0.028{\times}{\rm LacD}}} } \right)\cr &$$
for multiparous.
With coeff_parity=0.75 for parity 1, 0.92 for parity 2 and 1 otherwise (Hutchinson et al., Reference Hutchinson, Shalloo and Butler2013).
The shape of the lactation profiles originates from a previous study of Masselin et al. (Reference Masselin, Sauvant, Chapoutot and Milan1987), which described many classical lactation curve models based on the theoMYmax. The theoMYmax expresses the cow’s milk production potential in terms of her estimated yields at peak lactation in the third parity. The equations have then been adjusted using previously published data from INRA (Delaby et al., Reference Delaby, Leurent, Gallard and Schmitt2009) and Teagasc (Horan et al., Reference Horan, Dillon, Faverdin, Delaby, Buckley and Rath2004). Those data originates from experiments where cows spend most of their lactation at grazing.
The theoMOBmax (equation (3)), which is the maximum possible BCS change through the lactation, is set at calving and is always negative. The equation was developed by Delaby et al. (Reference Delaby, Horan, O’Donovan, Gallard and Peyraud2010a) for different breeds. It has been calculated using data with a large range of BCS loss and theoMYmax for primiparous and multiparous cows (Delaby et al., Reference Delaby, Horan, O’Donovan, Gallard and Peyraud2010a):
 $$\eqalignno{{\rm theoMOBmax}\,{\equals}\, & 2.2{\plus}{\rm parity}\,{\minus}\,0.047\cr &{\times}{\rm theoMYmax}{\times}{\rm coeff\_parity}\,{\minus}\,0.51{\times}{\rm BCS}_{{{\rm calv}}} \cr &$$
with parity=−0.1 for primiparous and +0.1 for multiparous, BCScalv the BCS of the cow at calving and the theoMOBmax expressed in units of BCS and coeff_parity=0.75 for party 1, 0.92 for parity 2 and 1 otherwise (Hutchinson et al., Reference Hutchinson, Shalloo and Butler2013).
Calculation of the milk yield allowed by the energy intake
It has been shown in French studies at grazing (Hoden et al., Reference Hoden, Peyraud, Muller, Delaby, Faverdin, Peccatte and Fargetton1991) that the milk production of any 1 day is more influenced by the previous day’s nutrition than it is by the direct feed intake on that day. This component of individual animal performance is included in the model with the milk production allowed by the diet depending on the feedstuff ingested in the 2 previous days (Jacquot, Reference Jacquot2012):
 $${{\rm uflMY}\,{\equals}\,{{0.3{\times}{\rm UFLint}_{{D{\minus}2}} {\plus}0.7{\times}{\rm UFLint}_{{D{\minus}1}} {\minus}\,{\rm UFLreq}\,{\minus}\,E} \over {0.44}}}$$
With UFLint D−1 the UFL ingested the previous day, ULFint D−2 the UFL ingested 2 days before and 0.44 corresponding to a requirement of 0.44 UFL/kg of milk at 4% of fat content (Supplementary Equation S12).
The UFL requirement (UFLreq) consists of the energy for maintenance, gestation and growth (Faverdin et al., Reference Faverdin, Delagarde, Delaby and Meschy2010) (Supplementary Equation S1 to S6). E is a correction factor for net energy taking into account the negative effect of feeding level and concentrate feeding level has on the organic matter digestibility and energy valorisation of the ration (Faverdin et al., Reference Faverdin, Baratte, Delagarde and Peyraud2011) (Supplementary Equation S5).
The MYgap of the animal is the difference between the MY allowed by the UFL intake and the theoMY and is expressed in kilogram of milk:
 $${{\rm MYgap}\,{\equals}\,{\rm uflMY}\,{\minus}\,{\rm theoMY}}$$
Calculation of the daily milk yield
The animal response is calculated depending on the MYgap sign. When MYgap is positive then the cow has surplus energy to partition between additional milk and BCS deposition, when MYgap is negative the cow is in deficit of energy and adjusts milk and BCS accordingly. It is first assumed that the diet is well balanced in terms of PDI (PDIint/UFLint=100) (Vérité and Delaby, Reference Vérité and Delaby2000), with PDIint and UFLint the PDI and UFL ingested during the day.
The shape of the equations (6) and (7) has been generated to take into account the fact that the responses are linked to the potential of the animal and to the available energy. Those equations have been validated based on external data from INRA in Le Pin (Delaby et al., Reference Delaby, Faverdin, Michel, Disenhaus and Peyraud2003; Delaby et al., Reference Delaby, Leurent, Gallard and Schmitt2009).
If the energy intake is higher than the requirement for theoMY (MYgap>0), the cow is able to produce more milk than the theoMY. The extra energy is used partly to produce more milk and partly to gain body reserve (through BCS and BW gain). The MY response rule included is curvilinear, thus it increases with theoMY and with the MYgap based on the exponential equation:
 $$\eqalignno{{\rm bcsMYresp}\,{\equals}& \,{\rm MYgap}\cr &{\times}\left[ {\left( {0.57{\plus}0.012{\times}{\rm theoMY}} \right){\times}e^{{{\minus}0.023{\times}{\rm MYgap}}} } \right]\cr &$$
with bcsMYresp the response in kilogram of milk, this response is added to the theoMY.
If the energy intake is lower than the requirement for theoMY (MYgap<0), the cow will mobilise body reserve to compensate the MYgap and will lose body reserve (if possible). The ability to mobilise will depend on the remaining pool of body condition available (actualBCSpool) and the stage of lactation with a higher ability of the cow to mobilise in early lactation (Faverdin et al., Reference Faverdin, Delagarde, Delaby and Meschy2010):
 $$\eqalignno{{\rm bcsMYresp}\,{\equals}&\,{\rm MYgap}\cr &{\times}\left( {0.75{\plus}0.25{\times}{{{\rm LacD}} \over 7}{\times}e^{{{\minus}0.25{\times}{{{\rm LacD}} \over 7}}} } \right)\cr &{\times}{{{\rm actualBCSpool}} \over {{\rm theoMOBmax}}}$$
with bcsMYresp being the response in kilogram of milk, LacD the day in lactation, with this response added to the uflMY.
After the 12th week of lactation the coefficient applied on the (actualBCSpool/theoMOBmax) is set at 0.90. This is because, after week 12, the model considers the ability to mobilise the residual pool as constant and similar to the value obtained in week 12.
In a second step, the impact of the protein content of all the feed intake on the MY response is represented in the model through the equation developed by Vérité and Delaby (Reference Vérité and Delaby2000):
 $${{\rm pdiMYresp}\,{\equals}\,{\minus}\,6.25{\plus}{{7.55} \over {1{\plus}0.21{\times}e^{{{\minus}0.14{\times}\left( {{\rm PDI}/{\rm UFLratio}\,{\minus}\,100} \right)}} }}}$$
with pdiMYresp the response in kilogram of standard milk and PDI/UFLratio equal to PDIint/UFLint if the gap is negative, and is equal to (PDIint/UFLint)×(uflMY/theoMY) if the gap is positive.
Finally, according to the different combinations of milk gap and PDI/UFLratio, there are four situations that can occur. Resulting in the MY calculated as
-
∙ theoMY+max(bcsMYresp,pdiMYresp) if MYgap>0 and PDI/UFLratio>100,
-
∙ theoMY+bcsMYresp+pdiMYresp if MYgap>0 and PDI/UFLratio<100,
-
∙ uflMY+max(bcsMYresp,pdiMYresp) if MYgap<0 and PDI/UFLratio>100,
-
∙ uflMY+bcsMYresp+pdiMYresp if MYgap<0 and PDI/UFLratio<100.
Body condition score change
The daily change of BCS (BCSchange) in units of BCS is dependent on the UFL balance of the animal meaning the energy differences between UFL intake and UFL expenditure as milk, maintenance, gestation and growth (Supplementary Equation S7). If the cow is in a deficit of energy, the loss of BCS will be calculated as one unit of BCS equal to 250 UFL as described by Jouven et al. (Reference Jouven, Agabriel and Baumont2008) (Supplementary Equation S8). If the cow is in surplus of energy an equation (Supplementary Equation S10) has been developed to ensure that there is never a BCS >5. It integrates the higher costs of adipose tissue deposition for a cow in high condition (BCS>3.5). It is based on a basic cost of 300 UFL for one point of BCS for a cow between 1.5 and 3.5 of BCS (Jouven et al., Reference Jouven, Agabriel and Baumont2008). In the model everyday, the BCSpool is calculated as the actual BCSpool from previous day minus the BCSchange taking into account an upper bound limit of 0 and a lower bound limit of the theoMOBmax (the theoMOBmax is always negative).
When dry, the BCS change is using the same dynamic only with the component linked to milk set at 0.
Sensitivity analysis
The model was evaluated by comparing the simulated performance under various scenarios with data available from the literature. The simulation used scenarios that systematically varied the following key components:
-
1. Milk production potential: three different theoretical maximum milk yields: 30 kg/cow per day (LG), 40 kg/cow per day (MG) or 50 kg/cow per day (HG).
-
2. Feed allowance: three different HA 14 kg/cow per day, 18 kg/cow per day and 22 kg/cow per day (all assumed to be grazed to 4 cm).
-
3. Supplementation: The addition of 0 or 4 kg of cereal-based concentrate/cow per day throughout the entire lactation.
This resulted in 18 different scenarios. The simulations were carried out for a full 12-month period (starting on the 1 January) allowing the observation of the whole lactation. It was assumed that at the start of the simulation the parity 3 cows had a BCS at calving of n (3.6, 0.25), n (3.4, 0.25) and n (3.2, 0.25) for the LG, MG and HG groups, respectively (1 to 5 scale), a BW of 615 kg and that animals were dry and 208 days pregnant. The BCS parameters follow a normal distribution as described by Geweke (Reference Geweke1991): n (average, SD). Feed quality was constant throughout the simulation and was based on published experiments (grass: FV=0.95 FU, UFL=1.00, PDI=103; concentrate: UFL=1.10, PDI=126; silage: FV=1.13, UFL=0.75, PDI=51) (McCarthy et al., Reference McCarthy, Delaby, Pierce, Brennan and Horan2012) and it was assumed that the cows were grazing for their whole lactation.
Model external evaluation
The model was used to simulate two very different experiments, one in Ireland and one in France. Outputs from the model in relation to milk production and BCS were evaluated relative to the experimental data. The next section describes the two studies used to complete the evaluation. The description of the experiments has been confined to the part relevant to this evaluation.
On farm studies, Irish experimental study 1 (Curtins experiment)
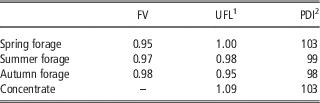
The first experimental study has been carried out at the Animal and Grassland Research and Innovation centre, Teagasc, Moorepark, Ireland (52.17°N; −8.27°W). This experiment has been previously fully described in McCarthy et al. (Reference McCarthy, Pierce, Delaby, Brennan and Horan2013). Two different stocking rate (SR)’s have been used to evaluate the model: 3.28 cow/ha (SR1) and 2.51 cow/ha (SR2). The cows used in this experiment were based on Holstein Friesian of both North American and New Zealand origin balanced for overall genetic merit. Concentrate supplementation was similar for all treatments which started at 4 kg/day post calving and was reduced and removed totally only when herbage supply exceeded animal demand for all treatments (usually mid-March). Cows were milked twice a day and MYs were recorded individually. Milk fat and protein concentrations were determined weekly from successive evening and morning milkings. BCS was assessed every 3 weeks by the same individual throughout the study on a scale of one to five in increments of 0.25. On 1 January 2009 each SR group were composed of 31 cows and 15 pregnant heifers. The qualities of the grass and concentrate from this experiment are presented in Table 1.
Information about the quality of the feedstuff by season for the 3 years of the simulation for the dairy lactating cow on the Irish experiment

FV=fill value.
1 Energetic value: ‘Unité Fourragère Lait’ (UFL). 1 UFL=1700 kcal net energy for lactation.
2 Proteic value: ‘Intestinal digestible protein’ (PDI).
On farm studies, French experimental study 2 (Le Pin experiment)
The objective of this experiment carried out at the INRA experimental farm of Le Pin-au-Haras (48.448°N, 0.098°E) was to evaluate over an extended period of time the ability of different breeds of dairy cows to produce and to reproduce under two feeding strategies in the context of group calving. This experiment has previously been fully described in Cutullic et al. (Reference Cutullic, Delaby, Gallard and Disenhaus2011). Since 2006, two groups of dairy cows from the Holstein and the Normande breeds were evaluated under two feeding strategies.
In early lactation during the winter period (90 days), animals of the high feeding group received an ab libitum total mixed ration (TMR) with maize silage (55%), dehydrated alfalfa (15%) (average forage quality 0.90 FV, 0.89 UFL and 76 PDI) and 30% of concentrate (average concentrate quality 1.1 UFL and 165 PDI/kg of dry matter). During the same period animals of the low feeding group were fed ad libitum with a TMR composed of grass silage (50%) and haylage (50%) without any concentrate (average of 1.07 FV, 0.92 UFL and 83 PDI). In early April when at grazing, the high feeding group of cows had access to a limited grass area of 0.35 ha/cow (permitting around 90 days of full grazing without forage supplementation) with a grass quality average of 0.98 FV, 0.91 UFL and 100 PDI. They received 4 kg of concentrate/day (average of 1.11 UFL and 136 PDI) and as soon as a grass deficit was detected, 5 to 8 kg of maize silage was added to the diet. The low feeding group of cows had access to a larger grass area of 0.55 ha/cow (permitting 180 days of exclusive grazing) with a grass quality average of 0.97 FV, 0.89 UFL and 102 PDI. They received no concentrate supplementation. Late in autumn, the grazed grass was replaced by grass silage (quality of 1.06 FV, 0.98 UFL and 67 PDI).
Model evaluation
In order to make consistent comparisons, the milk produced in the experiments was transformed into standard milk (Supplementary Equation S12). For the milk production and BCS, in both experiments, the model was evaluated on a weekly time step.
The theoMYmax for the Irish study was set for all mature cows at a mean of 37 kg (SD 5 kg) of milk/day. This potential was determined by evaluating the performance of the average actual cows through the 3 years. The average MY of the cattle was adjusted to parity 3 equivalents by assuming that parity 1 and parity 2 yield were 75% and 92% of parity 3 yields (Hutchinson et al., Reference Hutchinson, Shalloo and Butler2013). As the SRs were balanced for MY, the same theoMYmax yield has been applied across SR. Then the level of feeding effect has been included in the calculations as low (SR2) and very low (SR1) leading to a correction of the potential of 1.25 and 1.40, respectively, compared with the actual milk deliveries. These corrections were generated based on historical information. For the French study, a specific genetic index (Delaby et al., Reference Delaby, Peyraud, Foucher and Michel2010b) developed for this study was used to generate the individual theoMYmax (average of 53 kg, SD of 5 for the Holstein mature cows, average of 40 kg, SD of 4 for the Normande mature cows). The genetic index included the sire and grandsire’s genetic evaluation, the dam’s milk production over three lactations adjusted for the fixed environmental effect and the feeding treatment applied during each lactation. For the Irish data, the prediction of the model was evaluated by comparing average weekly model outputs of the subcattle v. the experimental data from the 1st to the 40th weeks of lactation. The simulation was run for both SR’s, and results of multiparous and primiparous cows were evaluated separately.
Using the French data the model prediction of the two different breeds and two different feeding levels was completed by comparing average weekly model outputs of the groups v. the experimental data from the 1st to 44th week of lactation. Based on individual genetic information available for the French data, it was possible to complete individual animal simulations (as it was possible to estimate the theoMYmax) and subsequent evaluation. The comparison between the simulation and actual data included the individual weekly average MY as well as the BCS for the 3 years. The accuracy of the simulation was evaluated per week and on a seasonal basis spring (early lactation – week 1 to 15), summer (mid lactation – week 16 to 25) and autumn (late lactation – week>25).
Statistical analyses
The root mean square error (RMSE), RPE and CCC were used to evaluate accuracy of the model when compared with the actual data. The RMSE provides information on the accuracy of the simulation by comparing term by term the actual and predicted data (Bibby and Toutenburg, Reference Bibby and Toutenburg1977). The lower the RMSE is, the more accurate the simulation. The RPE is an expression of the RMSE as a percentage of the actual data. According to Fuentes-Pila et al. (Reference Fuentes-Pila, DeLorenzo, Beede, Staples and Holter1996), a RPE <10% indicates a satisfactory prediction, between 10% and 20% a relatively acceptable prediction, and an RPE >20% suggests a poor model prediction. In this study, the RMSE and RPE were used on the comparison of the different sub cattle at the lactation week scale.
The CCC (Lin, Reference Lin1989; Nickerson, Reference Nickerson1997) evaluates the correlation between two data sets but also the deviation from the 45° line. The strength of agreement is considered as poor if the CCC is <0.65, moderate if between 0.65 and 0.80, substantial if between 0.80 and 0.90, and almost perfect if >0.90 (McBride, Reference McBride2005).
Results
Sensitivity analyses
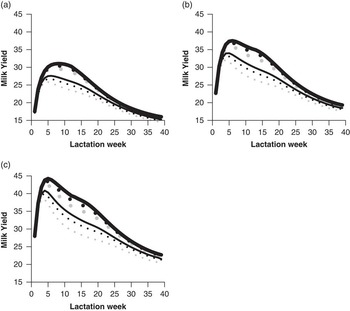
The results of the sensitivity analyses in terms of MY and BCS are presented in Figures 2 and 3. In the simulations, the average daily milk production was 26.4 kg/cow across all simulations (HA, concentrate and theoMYmax). The highest average simulated MY corresponded to 33.3 kg/cow under the 50 theoMYmax, HA of 22 kg/cow and 4 kg of concentrate with the lowest average MY simulated corresponding to 20.1 kg for the 30 theoMYmax, HA of 14, without concentrate supplementation. An increase of 1 kg of theoMYmax resulted in an average increase of 0.4 kg of milk produced. An increase of 1 kg of HA resulted in an average increase of 0.2 kg of milk/cow per day (minimum of 0.1, maximum of 0.5), which was higher for the 50 theoMYmax cow (average of 0.3 kg) than for the 30 theoMYmax (average of 0.1 kg). An increase of 1 kg concentrate resulted in an average increase of 0.8 kg of milk/cow per day (maximum of 1.1 kg, minimum of 0.5 kg) with this increase being higher for the 50 theoMYmax cow (average of 0.9 kg) than for the 30 theoMYmax (average of 0.6 kg). Furthermore, this increase was higher at an HA of 14 (average of 0.9 kg) than at an HA of 22 (average of 0.6 kg).
Influence of the genetic milk potential of the cow ((a) 30 kg, (b) 40 kg, (c) 50 kg), the herbage allowance per cow (grey dot: 14; black dot: 18, black line: 22) and the amount of concentrate per cow per day (thin line: 0, bold line: 4) on average standard milk yield (kg) of a dairy herd.

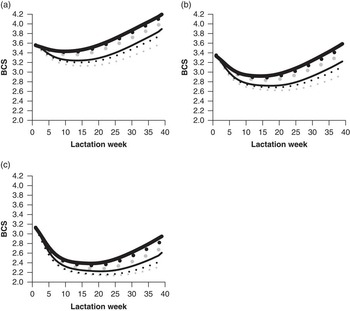
Influence of the genetic milk potential of the cow ((a) 30 kg, (b) 40 kg, (c): 50 kg), the herbage allowance per cow (grey dot: 14, black dot: 18, black line: 22) and the amount of concentrate per cow per day (thin line: 0, bold line: 4) on average body condition score (BCS) (1 to 5) of a dairy herd.

The average BCS loss was of 0.63 units between calving and nadir, with a maximum loss of 1.1 for the 50 theoMYmax, HA 14 kg with no concentrate and a minimal loss of 0.2 units for the 30 theoMYmax, HA 22, 4 kg of concentrate. The impact of an increase of 1 kg in theoMYmax resulted in an average increase in BCS loss of 0.03 units of BCS to the nadir. The impact of an increase of 1 kg of HA resulted in an average decrease of 0.01 units of BCS loss to the nadir. In terms of concentrate the increase of 1 kg of concentrate resulted in an average decrease of BCS loss of 0.05 units.
Curtins experiment
Model outputs
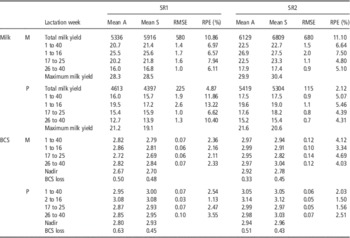
The model simulated a higher daily (1.3 kg of milk/cow) and annual (893 kg of milk/cow) milk production for the multiparous cows managed under the SR2 treatment than under the SR1 (Table 2). The same trend was observed for the primparous cows with an average increase of daily production of 1.8 kg/cow and an average increase of 907 kg of milk through the whole lactation from the SR1 to the SR2 treatment. For the BCS the model simulated a higher average BCS throughout lactation for the SR2 than for the SR1 (0.15 units higher for the multiparous and 0.05 higher for the primiparous) (Table 2). The model simulated a higher average BCS for the primiparous cows than for the multiparous cows (average of 3.03 against 2.87). The BCS loss across the different SRs was similar with 0.47and 0.44 for the SR1 and SR2, respectively (average between primiparous and multiparous).
Comparison between the average actual (A) and simulated (S) standard milk production (kg) and body condition score (BCS) (units) of the dairy cattle for the stocking rate (SR) 3.28 (SR1) and 2.51 (SR2) for the multiparous (M) and primiparous (P) cow on the Irish experiment

RMSE=root mean square error; RPE=relative prediction error.
Model evaluation
Over the total lactation, the weekly milk production for the SR1 group of cows had an RPE of 6.97% for the multiparous cows and 11.86% for the primiparous cows (Table 2) when the model outputs and the experimental data were compared. The higher RPE for the primiparous cows was related to an underestimation of the milk production of these group of cows in the spring (RPE=13% and RMSE=2.58 kg) and a slight underestimation of the milk production in autumn (RPE=10% and RMSE=1.32 kg). For both primiparous and multiparous cows in SR1, the BCS through lactation and per season resulted in an RPE which was <4% and the RMSE <0.10 units of BCS (Table 2). The weekly milk production of the SR2 group of cows was reasonable with the RPE throughout lactation and at a seasonal level <8% for both multiparous and primiparous SR2 cows (Table 2). On the cumulative MY, the primiparous SR2 cows had a RPE of 2% and RMSE of 115 kg of milk. For the multiparous cows, the model overestimated the MY with an RPE of 11% and a RMSE of 680 kg. The difference in percentage of error between the weekly MY and the cumulative MY is due to the difference in the lactation length between actual and predicted. The BCS of the SR2 animals resulted in an RPE which was <5% with the RMSE <0.15 units (Table 2).
The accuracy of the model was similar for both SR’s, however, there was a decrease in precision in the model for the primiparous cows in the SR1 groups.
Le Pin experiment
Model output
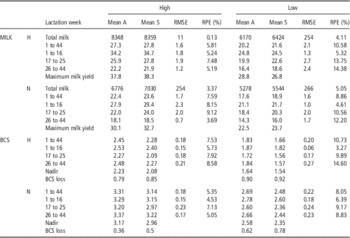
The model simulated a higher average milk production for the high feeding group (average of 25.7 kg of milk/cow per day) of cows than for the low feeding group of cows (average of 20.3 kg of milk) and a higher milk production for the Holstein cows (average of 24.7 kg of milk) over the Normande cows (average of 21.3 kg of milk) (Table 3). On average, through the overall lactation the high feeding group of cows produced 1 935 and 1 486 kg/cow more milk than the low feeding group for the Holstein and the Normande groups of cows, respectively (Table 3). The model simulated a higher BCS loss for the Holstein than for the Normande (average of 0.89 against 0.64) group and a slightly higher loss for the low feeding group than for the high feeding group (average of 0.85 against 0.68).
Comparison between the average actual (A) and simulated (S) standard milk production (kg) and body condition score (BCS) (units) of the dairy cattle for the high and low feeding system for the Holstein (H) and Normande (N) cow on the French experiment

RMSE=root mean square error; RPE=relative prediction error.
Model evaluation
For the high feeding group, the weekly milk production had an RPE which was <10% at both overall lactation and seasonal scale for both Holstein and Normande cows (Table 3). For the average BCS the model had an RPE which was <10% with all computed RMSE figures <0.25 units for the high feeding group of cows (Table 3). The differences between the actual and the predicted BCS loss were 0.06 for the Holstein and 0.14 for the Normande cows.
For the cows in the low feeding systems when compared on a weekly basis, all RPE values were <15% for MY (Table 3). The model has a tendency to slightly overestimate the milk production for both Holstein and Normande cows in the low feeding systems in summer (RPE of 14% and 11%, RMSE of 2.73 and 1.95 kg/cow per day, respectively) and autumn (RPE of 14% and 12%, RMSE of 2.35 and 1.74 kg/cow per day). For the average BCS the prediction were relatively accurate with all RPE values <15% and all RMSE values less than 0.25 units except for the low feeding Holsteins in autumn (RMSE of 0.27) (Table 3). The differences between the actual and predicted BCS loss are 0.02 for the Holstein and 0.16 for the Normande groups.
The model has been more accurate in simulating the high feeding levels than the low in terms of milk production due to an over prediction of the milk production of the low feeding group in autumn. In terms of BCS the model was slightly more accurate in predicting the BCS of the Holstein than the Normande cows due to an underestimation of the BCS of the Normande group.
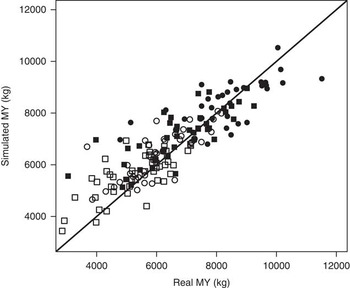
As the genetics of the individual cows was available, a comparison at individual cow level was also completed for both breed and feeding systems together. For the total milk production throughout lactation the CCC was 0.85 with a coefficient of bias of 0.97 (Figure 4). On the comparison by week of lactation the CCC was 0.84 with a coefficient of bias of 0.99.
Comparison between the individual actual and predicted total lactation standard milk yield (MY) of the French cows. One dot represents the global milk production of one cow through one lactation. The full dot represent the high feeding level, empty dot the low feeding level, the round dot the Holstein cows and the square dot the Normande cows.

Discussion
Overall assessment of the model
The model developed in this study has been able to react in a sensible fashion to variation in concentrate feed levels, HA and herd genetic potential. Using the French data, the model was capable of reproducing the impact of the different types of feeding (high and low feeding group) as well as the different types of feeding intra group (TMR, grazing and indoor feeding). The model was also capable of reproducing the higher milk production and BCS loss of the Holstein cows when compared with the Normande cows. For the Irish data, the model was capable of adapting to the two different SRs by simulating higher average MYs per cow for the lower SRs showing the ability of the model to react realistically to variation in feed levels. Primiparous cows have also produced significantly less milk than the multiparous cows in the simulation.
In relation to HA and concentrate feed level variation, the model responses are within the range of previously published studies. In this model the impact of theoretical milk is higher in early lactation (between 4.2 and 6.0 kg of standard milk/10 kg of theoretical milk) than in late lactation (between 3.0 and 3.9 kg of standard milk). This finding is in agreement with the findings of Buckley et al. (Reference Buckley, Dillon, Rath and Veerkamp2000) which showed that a higher peak MY is associated with a steeper decline (less persistent) lactation curves, which leads to a decrease of the impact of genetic potential in late lactation. The outputs from the model show an overall trend that is similar to previous studies with a change from 0.08 to 0.45 kg of milk/kg of HA simulated in the model. This compares with 0.02 to 0.23 kg of milk/kg of HA in the literature. As shown in previous studies, the concentrate response increased with the theoretical milk production (Fulkerson et al., Reference Fulkerson, Davison, Garcia, Hough, Goddard, Dobos and Blockey2008) and it decreased with increasing HA (McEvoy et al., Reference McEvoy, Kennedy, Murphy, Boland, Delaby and O’Donovan2008). The outcomes from this model are within the range of the previously published studies for concentrate supplementation (Supplementary Table S5) with the impact of 1 kg of concentrate resulting in an increase of 0.5 to 1.1 kg of standard milk across different genotypes and HA categories. The impact of concentrate supplementation on BCS loss has been demonstrated by the model. The impact of the increase of 4 kg of concentrate/cow per day resulted in a reduction in the body condition loss post calving, this impact is higher for the LG and MG (0.21 units) than for the HG cow (0.16 units). The model outputs are within the range of previously published studies with a reduction of BCS loss of between 0.03 and 0.05 of BCS/kg of concentrate (Horan et al., Reference Horan, Mee, Rath, O’Connor and Dillon2005; McCarthy et al., Reference McCarthy, Berry, Dillon, Rath and Horan2007).
External evaluation
With an RPE <15%, the model can be said to have good accuracies at predicting BCS and milk production (Fuentes-Pila et al., Reference Fuentes-Pila, DeLorenzo, Beede, Staples and Holter1996) and is in the range of previous studies. At the herd level, Baudracco et al. (Reference Baudracco, Lopez-Villalobos, Holmes, Comeron, Macdonald and Barry2013) presented a model with an RPE of 8.8% for annual MY. When compared against 206 experiments, the GrazIN model had an average RPE of 14% at the herd level (Delagarde et al., Reference Delagarde, Valk, Mayne, Rook, González-Rodríguez, Baratte, Faverdin and Peyraud2011b). Primiparous cows in the GrazIN model had a higher RPE (19%) than for multiparous cow (11%) (Faverdin et al., Reference Faverdin, Baratte, Delagarde and Peyraud2011). At individual animal level Baudracco et al. (Reference Baudracco, Lopez-Villalobos, Holmes, Comeron, Macdonald and Barry2013) predicted the MY with a CCC 0.74 and 0.77 with observed MYs for two different cow breeds. When taking all of these components together, this model can be said to be as least as good or better across a range of different evaluation criteria.
For the Irish data, the model developed in this study had a satisfactory prediction for MY on the overall lactation for both SRs. However, there were some points of discrepancy. The underestimation of the model in early lactation of the primiparous SR1 cows shows that the model underestimates the ability of the primiparous cows to compensate for the lack of feed, despite a relatively accurate prediction of the BCS. The prediction of BCS change is very accurate for the Irish data with all RPE <5% at the lactation or season levels. Within the French data all RPE were <15% for daily milk production over the lactation which shows that the model is well able to adapt to the different types of feeding (TMR, grazing, indoor feeding). The model had a tendency to slightly overestimate the milk production for the Normande dairy cows in early lactation probably due to the over mobilisation of BCS by the simulated Normande group compared with the actual cows. For both experiments the model predicted the BCS loss and the nadir with precision <0.25 which shows a very good accuracy.
With respect to fitting individual cow data, the CCC of 0.84 with a coefficient of bias of 0.99 for weekly milk production and 0.85 with a coefficient of bias of 0.97 for annual total MY, for individual French cows shows that the model is well able to predict at animal level the impact of feeding and individual animal genetics on individual MYs. However, a good and precise definition of the theoMY of the cow is needed for accurate simulations. This highlights the need to develop tools for estimating theoMYmax in the field to allow for a precise simulation in the model as the results are sensitive to both theoretical maximum milk and BCS at calving. Finding an accurate theoretical maximum milk yield for the dairy cow is always a challenge as the cows are almost never fed enough to express their full potential (Faverdin et al., Reference Faverdin, Delagarde, Delaby and Meschy2010) When the model will be ready for commercial farms use, a feature will be added to permit the calculation of the theoMYmax using genetic information and historical information.
Model advancement and limitations
The HDM model is an individual-based model focusing principally on the impact of diet and management on milk production and BCS at individual animal and herd level. Many models have been developed to simulate the production of cattle at grazing but there are varying levels of accuracy and many do not permit the modelling of individual existing animal performance. For example, in the model e-Dairy (Baudracco et al., Reference Baudracco, Lopez-Villalobos, Holmes, Comeron, Macdonald and Barry2013), which is an individual-based model, each cow is generated randomly at the start of the simulation (for the potential MY and the BW at calving). Contrary to the HDM model, the duration of the simulation is fixed at 1 year, not allowing the testing of longer term strategies. As in the HDM model the individual and herd milk production, BCS and BW are simulated daily but in addition the daily protein and fat content is also simulated in the e-Dairy model. Models like the one described by Rotz et al. (Reference Rotz, Mertens, Buckmaster, Allen and Harrison1999) use groups of animals (early mid and late lactation sub divided with multiparous and primiparous cows) to simulate the milk production and BW. Each group has a potential MY, a milk fat content, BW, change in BW and a fibre digestive capacity. Once again contrary to the HDM, simulation of a specific animal is not possible neither is the individual simulation of different management regimes of the cow by her genetic potential. A limitation of the model is the use of the theoMYmax. The determination of theoMYmax at the farm level is challenging. Research is on-going to link the genetics of the animal to this theoMYmax to permit an accurate use of the model on farm.
The strength of the current model is its ability to balance energy partition between milk and body reserves according to the gap between intake and requirement. According to Martin and Sauvant (Reference Martin and Sauvant2010b), this allows the model to simulate across a wide range of genotypes and environments. The model can be defined as efficient in recreating different extensive grazing scenarios with different animal genetics. However, further evaluation would be needed if the model would be used for high genetic merit cows in terms of milk production or very intensive systems with high levels of concentrate supplementation. The HDM model can be used as the animal core of a farm systems model (Ruelle et al., Reference Ruelle, Shalloo, Wallace and Delaby2015) for both research and extension. This model combined with the system model (the pasture-based herd dynamic model) (Ruelle et al., Reference Ruelle, Shalloo, Wallace and Delaby2015) will be adapted as an online tool to facilitate its use by farmers and advisors in the future. From a farmer’s perspective, the combined model will be used to support the decision-making process regarding SR, pre grazing height, post grazing height and concentrate supplementation. However, the HDM model only simulates a cow in what could be described as good health status and does not take into account the possible impact of mastitis, lameness or other health-related events, which would require further development.
Conclusion
The model presented is capable of adapting to different management systems and animal breeds in a realistic manner when compared with already published experiments and experimental data with all RPE <15% for both BCS and milk production. The model simulates milk production and BCS of the Holstein dairy cows at grazing as well as in indoor feeding situations accurately. The model is well able to simulate the effects of SR in grass-based systems for both multiparous and primiparous cows. However, there is a requirement for more work in relation to BCS for the Normande breed.
Acknowledgements
The authors would like to acknowledge the personnel of both research farms for the acquisition of the experimental data. Especially, Ségolène Leurent-Colette, Adèle Lemercier and Loic Leloup from the French experimental farm data; Brendan Horan, Brian McCarthy and Adian Brennan for the Irish experimental farm data. The authors would like to thank Nicolas Friggens for his help in the preparation of this manuscript. The authors acknowledge the financial support of the FP7 GreenHouseMilk Marie Curie project, SAC for co-hosting and funding from the Research Stimulus Fund 2011 administered by the Department of Agriculture, Fisheries and Food (Project 11/S/132).
Supplementary material
To view supplementary material for this article, please visit http://dx.doi.org/10.1017/S1751731116001026