





Flavanols are a subclass of flavonoids, a group of natural compounds that are ubiquitous in plant-based foods. The primary dietary sources of flavanols include cocoa, black tea, green tea, red wine and apples(Reference Gu, Kelm and Hammerstone1). However, the total flavanol content in cocoa, which includes monomeric and oligomeric/polymeric flavanols known as procyanidins, is higher compared with other food sources(Reference Crozier, Preston and Hurst2–Reference Lee, Kim and Lee4). Cocoa flavanols (CF) have greater antioxidant capacity(Reference Lazarus, Hammerstone and Schmitz3,Reference Serafini, Bugianesi and Maiani5) which has attracted research attention due to their potential health benefits. The positive effects of CF on cardiovascular parameters have also been consistently replicated. The consumption of flavanol-rich cocoa products, for example, reduces platelet aggregation(Reference Murphy, Chronopoulos and Singh6), improves insulin sensitivity, systolic and diastolic blood pressure(Reference Grassi, Lippi and Necozione7) and increases blood flow by dilating blood vessels(Reference Fisher, Hughes and Gerhard-Herman8).
Human and animal studies on the cognitive effects of CF intake suggest two primary physiological mechanisms. CF are thought to directly affect cognition by interacting with cellular signalling pathways, enzymes and receptors and indirectly influence cognition by increasing the synthesis of a signalling molecule nitric oxide (NO)(Reference Socci, Tempesta and Desideri9,Reference Sokolov, Pavlova and Klosterhalfen10) . Structural and functional changes in the nervous system resulting from chronic CF consumption are suggested to lead to long-lasting effects. A sufficient dosage of CF, either in a single dose or over several weeks (subacute), is considered necessary to produce immediate effects(Reference Sokolov, Pavlova and Klosterhalfen10). These effects are primarily associated with transient changes in blood vessel tone mediated by NO synthesis within the vascular endothelium(Reference Fisher, Hughes and Gerhard-Herman8,Reference Calver, Collier and Vallance11–Reference Karim, McCormick and Kappagoda14) . NO has several biological functions. Its role as a retrograde neurotransmitter and its vasodilatory effects are thought to mediate enhanced cognitive functions through CF consumption(Reference Karabay, Saija and Field15). Another factor mediating the effects of NO on cognition is its role in improving insulin secretion and reducing insulin resistance. Two recent studies demonstrated that consumption of CF improves cognitive performance by reducing insulin resistance(Reference Desideri, Kwik-Uribe and Grassi16,Reference Mastroiacovo, Kwik-Uribe and Grassi17) .
Several randomised controlled trials have explored the effects of acute(Reference Karabay, Saija and Field15,Reference Akyürek, Altınok and Karabay18–Reference Tsukamoto, Suga and Ishibashi25) and long-term CF intake(Reference Desideri, Kwik-Uribe and Grassi16,Reference Mastroiacovo, Kwik-Uribe and Grassi17,Reference Pase, Scholey and Pipingas20,Reference Massee, Ried and Pase23,Reference Brickman, Khan and Provenzano26–Reference Sorond, Hurwitz and Salat32) on cognition and mood. Although studies examining the acute effects of CF on cognitive functions have yielded mixed findings, evidence suggests that CF may improve some aspects of cognition in healthy young adults(Reference Karabay, Saija and Field15,Reference Massee, Ried and Pase23,Reference Scholey, French and Morris24) . For instance, Karabay et al.(Reference Karabay, Saija and Field15) found that a single dose of CF improved spatial attention but not temporal attention, indicating that the effects of CF may vary across attentional functions. The authors suggested that the observed improvement in spatial attention performance might result from faster eye movements, which are critical for efficiently scanning the visual field. These findings suggest that the attentional effects of CF may be selective and remain incompletely understood.
The purpose of the current randomised crossover trial was to examine the acute effects of CF intake on overt and covert attention in healthy young adults. Overt attention is described as the process of shifting attention from one place or object to a different one by moving the eyes. In contrast, covert attention involves directing attention towards a location or object within the visual field without shifting the eyes. Covert orienting of attention results from widespread neural activation in both cortical and subcortical areas. The brain regions activated during covert attention significantly overlap with those responsible for overt attention(Reference Beauchamp, Petit and Ellmore33–Reference Nobre, Gitelman and Dias35). There is a consensus that the beneficial physiological effects of flavanol intake occur via NO synthesis(Reference Nehlig36). Following CF intake, a series of biochemical processes take place within endothelial cells, leading to the relaxation of smooth muscles, dilation of blood vessels and an increase in cerebral blood flow(Reference Fisher, Hughes and Gerhard-Herman8,Reference Francis, Head and Morris29) . More specifically, CF may support cognition by improving neurovascular coupling, that is, the task-related increase in cerebral blood flow to active regions in response to neuronal metabolic demand. For the brain to function optimally, cerebral blood flow must be maintained at an adequate level. During intensive neural activity, neurons require additional oxygen and nutrients, and this increased demand is met through enhanced blood flow(Reference Csipo, Lipecz and Owens37). Based on findings indicating that CF intake increases blood flow and perfusion in brain regions responsible for attention(Reference Francis, Head and Morris29,Reference Lamport, Pal and Moutsiana38) , we hypothesised that CF intake may have positive acute effects on both overt and covert attention through enhanced functionality of neurons. Therefore, the present study aims to determine whether a single 710 mg dose of CF improves accuracy and reaction time in the visual search and spatial cueing tasks relative to placebo and control conditions.
Materials and methods
Ethical approval and registration
This study was conducted in accordance with the principles outlined in the Declaration of Helsinki and received approval from the Research and Publications Ethics Committee of Bursa Uludağ University (2021/11). All participants provided written informed consent prior to participation. The hypothesis, experimental design, randomisation and data analysis plan of the current study were deposited on the Open Science Framework (osf.io/wyf6m) prior to data collection, in the interest of scientific transparency, replicability and reproducibility. The trial was also registered at ClinicalTrials.gov under the identifier NCT06812689 (https://clinicaltrials.gov/study/NCT06812689).
Participants
Forty-eight healthy undergraduate students (24 male) aged between 18 and 27 years participated in the study (M age = 20·83, sd = 1·39). An a priori power analysis was conducted using G*Power 3.1.9.4(Reference Faul, Erdfelder and Lang39) for sample size estimation based on data from Scholey et al.(Reference Scholey, French and Morris24) and Karabay et al.(Reference Karabay, Saija and Field15). The effect size reported in these studies was medium, d = .30–.53(Reference Scholey, French and Morris24); η p 2 = .09, Cohen’s f = .31(Reference Karabay, Saija and Field15). With a significance criterion of α = .05 and power (1 – β) = .95, the minimum sample size needed with the effect size of .26 is N 40 for an F test. Therefore, the final sample of N 48 exceeded the a priori requirement. The mean height, weight and BMI of the participants were 171·3 cm (sd = 9·53), 65·96 kg (sd = 16·29) and 22·23 kg/m2 (sd = 4), respectively. Inclusion criteria were as follows: no history of neurological, psychiatric, cardiovascular or metabolic disorders; not following any medically restricted diet; not taking antidepressant, anxiolytic and antipsychotic drugs in the past 3 months; not currently taking anticoagulants; not taking herbal supplements in the past week; not allergic or intolerant to cocoa, caffeine, sucrose or fructose; not colour blind and having normal or corrected-to-normal visual acuity. To limit the variability in attention task performance, the age range of the participants was restricted to 18–30 years. Of the fifty-seven students who expressed interest in the study, three were excluded due to neurological conditions, and four were excluded due to antidepressant use. Two participants met the inclusion criteria but withdrew from the study before randomisation due to a scheduling conflict. The flow diagram showing inclusion, randomisation of sequence allocation and participation is presented in Figure 1.
Consolidated standards of reporting trials (CONSORT) flow diagram of the study procedures. The sequence of letters shown for each allocation group indicates, from left to right, the order in which the interventions were administered across the three testing sessions. C, control; F, flavanol; P, placebo; SCT, spatial cueing task; VST, visual search task.

Cocoa intervention
Flavanol-rich natural cocoa and flavanol-free alkalised cocoa powder were supplied at no cost by Barry Callebaut. No additional financial support or sponsorship was provided by the company. Cocoa powders were placed in silver-coloured pouches with identical appearance and dimensions, and the pouches were assigned codes (Δ and Σ) based on cocoa powder they contained.
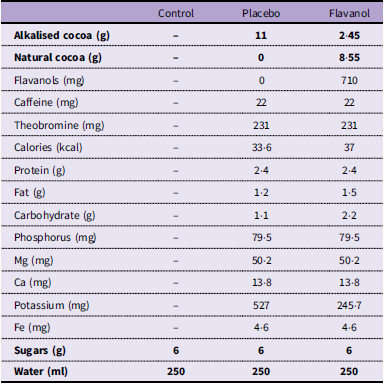
The beverage was prepared using 250 ml of warm-to-hot water to facilitate dissolution of the cocoa powder and allow immediate consumption. An equal amount of sugar (6 g) was added to each beverage to enhance palatability. The natural cocoa powder is light brown and has a bitter taste due to its acidity, with a pH of 6·8. In contrast, alkalised cocoa is darker in colour and mellower in flavour. To prevent participants from distinguishing between the two cocoa beverages based on their colour, the beverages were served in lidded paper cups. While it was not possible to completely mask the taste difference between the two cocoa beverages, 8·55 g of natural cocoa was mixed with 2·45 g of alkalised cocoa in the flavanol condition to minimise this difference. Even if the participants were able to distinguish between them, they were not informed that the beverages differed in flavanol content and therefore could not infer from taste alone which beverage contained flavanols. Thus, the study was carried out in a double-blind manner with respect to the two cocoa beverage conditions. Neither the participants nor the experimenter knew which session involved the flavanol-rich or flavanol-free cocoa beverage.
The three interventions comprised sugar water (control), a cocoa beverage containing no flavanols (placebo) and a cocoa beverage containing 710 mg of flavanols (flavanol condition). The composition of each beverage is listed in Table 1. The reported values were provided by the manufacturer, and all cocoa beverages used in the study were prepared from the same package of each product. The amount of flavanols in the flavanol condition was determined based on the findings of a meta-analysis conducted by Sun et al.(Reference Sun, Zimmermann and De Castro40). This study examined the dose–response relationship between cocoa flavanol consumption and flow-mediated dilation, revealing that 710 mg of CF produced optimum effects. Additionally, since the amounts of caffeine and theobromine were identical in both conditions, any observed differences were less likely to be explained by variation in these compounds.
Nutritional content of experimental products

Table 1. Long description
A table comparing the nutritional content of control, placebo, and flavanol cocoa beverages. The table has 16 rows and 3 columns. Column headers are Control, Placebo, and Flavanol. Row labels include Alkalized cocoa (g), Natural cocoa (g), Flavanols (mg), Caffeine (mg), Theobromine (mg), Calories (kcal), Protein (g), Fat (g), Carbohydrate (g), Phosphorus (mg), Mg (mg), Ca (mg), Potassium (mg), Fe (mg), Sugars (g), and Water (ml). Row 1: Control, dash; Placebo, 11; Flavanol, 2.45. Row 2: Control, dash; Placebo, 0; Flavanol, 8.55. Row 3: Control, dash; Placebo, 0; Flavanol, 710. Row 4: Control, dash; Placebo, 22; Flavanol, 22. Row 5: Control, dash; Placebo, 231; Flavanol, 231. Row 6: Control, dash; Placebo, 33.6; Flavanol, 37. Row 7: Control, dash; Placebo, 2.4; Flavanol, 2.4. Row 8: Control, dash; Placebo, 1.2; Flavanol, 1.5. Row 9: Control, dash; Placebo, 1.1; Flavanol, 2.2. Row 10: Control, dash; Placebo, 79.5; Flavanol, 79.5. Row 11: Control, dash; Placebo, 50.2; Flavanol, 50.2. Row 12: Control, dash; Placebo, 13.8; Flavanol, 13.8. Row 13: Control, dash; Placebo, 527; Flavanol, 245.7. Row 14: Control, dash; Placebo, 4.6; Flavanol, 4.6. Row 15: Control, 6; Placebo, 6; Flavanol, 6. Row 16: Control, 250; Placebo, 250; Flavanol, 250.
Design
The present study explored the acute effects of a single 710 mg dose of CF on overt and covert attention using a randomised, placebo-controlled, double-blind, counterbalanced crossover design. All participants underwent three testing sessions, separated by a 1-week washout period, carried out by the lead author. On different visits, participants consumed sugar water, flavanol-free or flavanol-rich cocoa beverages before performing attention tasks. Cocoa beverages were prepared and administered by two undergraduate research assistants. The researcher remained unaware of which experimental product was administered to the participants until the completion of the experiments. Considering that the order effect might confound the research findings, experimental products (control, placebo and flavanol) and attention tasks were counterbalanced across participants, using a random sequence generator(Reference Haahr41) (Figure 1).
To control for diurnal effects, participants visited the laboratory at the same fixed time and on the same day of the week across the three sessions. Sessions were scheduled at 09·00, 10·00, 11·00, 12·00, 13·00, 14·00 or 15·00. Participants were asked to refrain from consuming products containing caffeine, nicotine, alcohol and cocoa for at least 8 h before arriving at the laboratory. During each session, participants consumed the assigned beverage following the collection of a saliva sample. Francis et al.(Reference Francis, Head and Morris29) showed that the intake of 516 mg of CF increased cerebral blood flow, with the peak occurring 2 h after consumption. To allow CF to reach its maximum effectiveness, attention tasks were performed 1 h and 40 min after beverage consumption, and the experiment was completed roughly 2 h and 20 min after consumption. During the interval between beverage consumption and the attention tasks, participants were permitted to consume only water and were asked not to engage in physically or mentally strenuous activities.
To ensure the methodological quality of our study met certain standards, we considered eleven criteria outlined in the Physiotherapy Evidence Database (PEDro) Scale. The PEDro Scale is recognised as an objective and reliable tool for evaluating randomised controlled trials, helping to determine their external validity (criterion 1), internal validity (criteria 2–9) and the adequacy of their statistical data for interpreting results (criteria 10 and 11). Our study met all but the seventh item, the triple-blind criterion and achieved a score of 9 out of 10 on the PEDro Scale, which is considered indicative of high-quality methodology(Reference Cashin and McAuley42).
Monitor
Attention tasks were presented on a monitor (Acer Aspire C24-1650 AIO Desktop) with a size of 23·8″ (530 mm width and 290 mm height) and a refresh rate of 60 Hz. The screen resolution was set to 1920 × 1080 pixels. Viewing distance was 60 cm. Attention tasks programmed in the OpenSesame 3.3(Reference Mathôt, Schreij and Theeuwes43) were executed on the Windows 11 operating system. Participants’ responses were recorded using a standard Q keyboard.
Attention tasks
Spatial cueing task
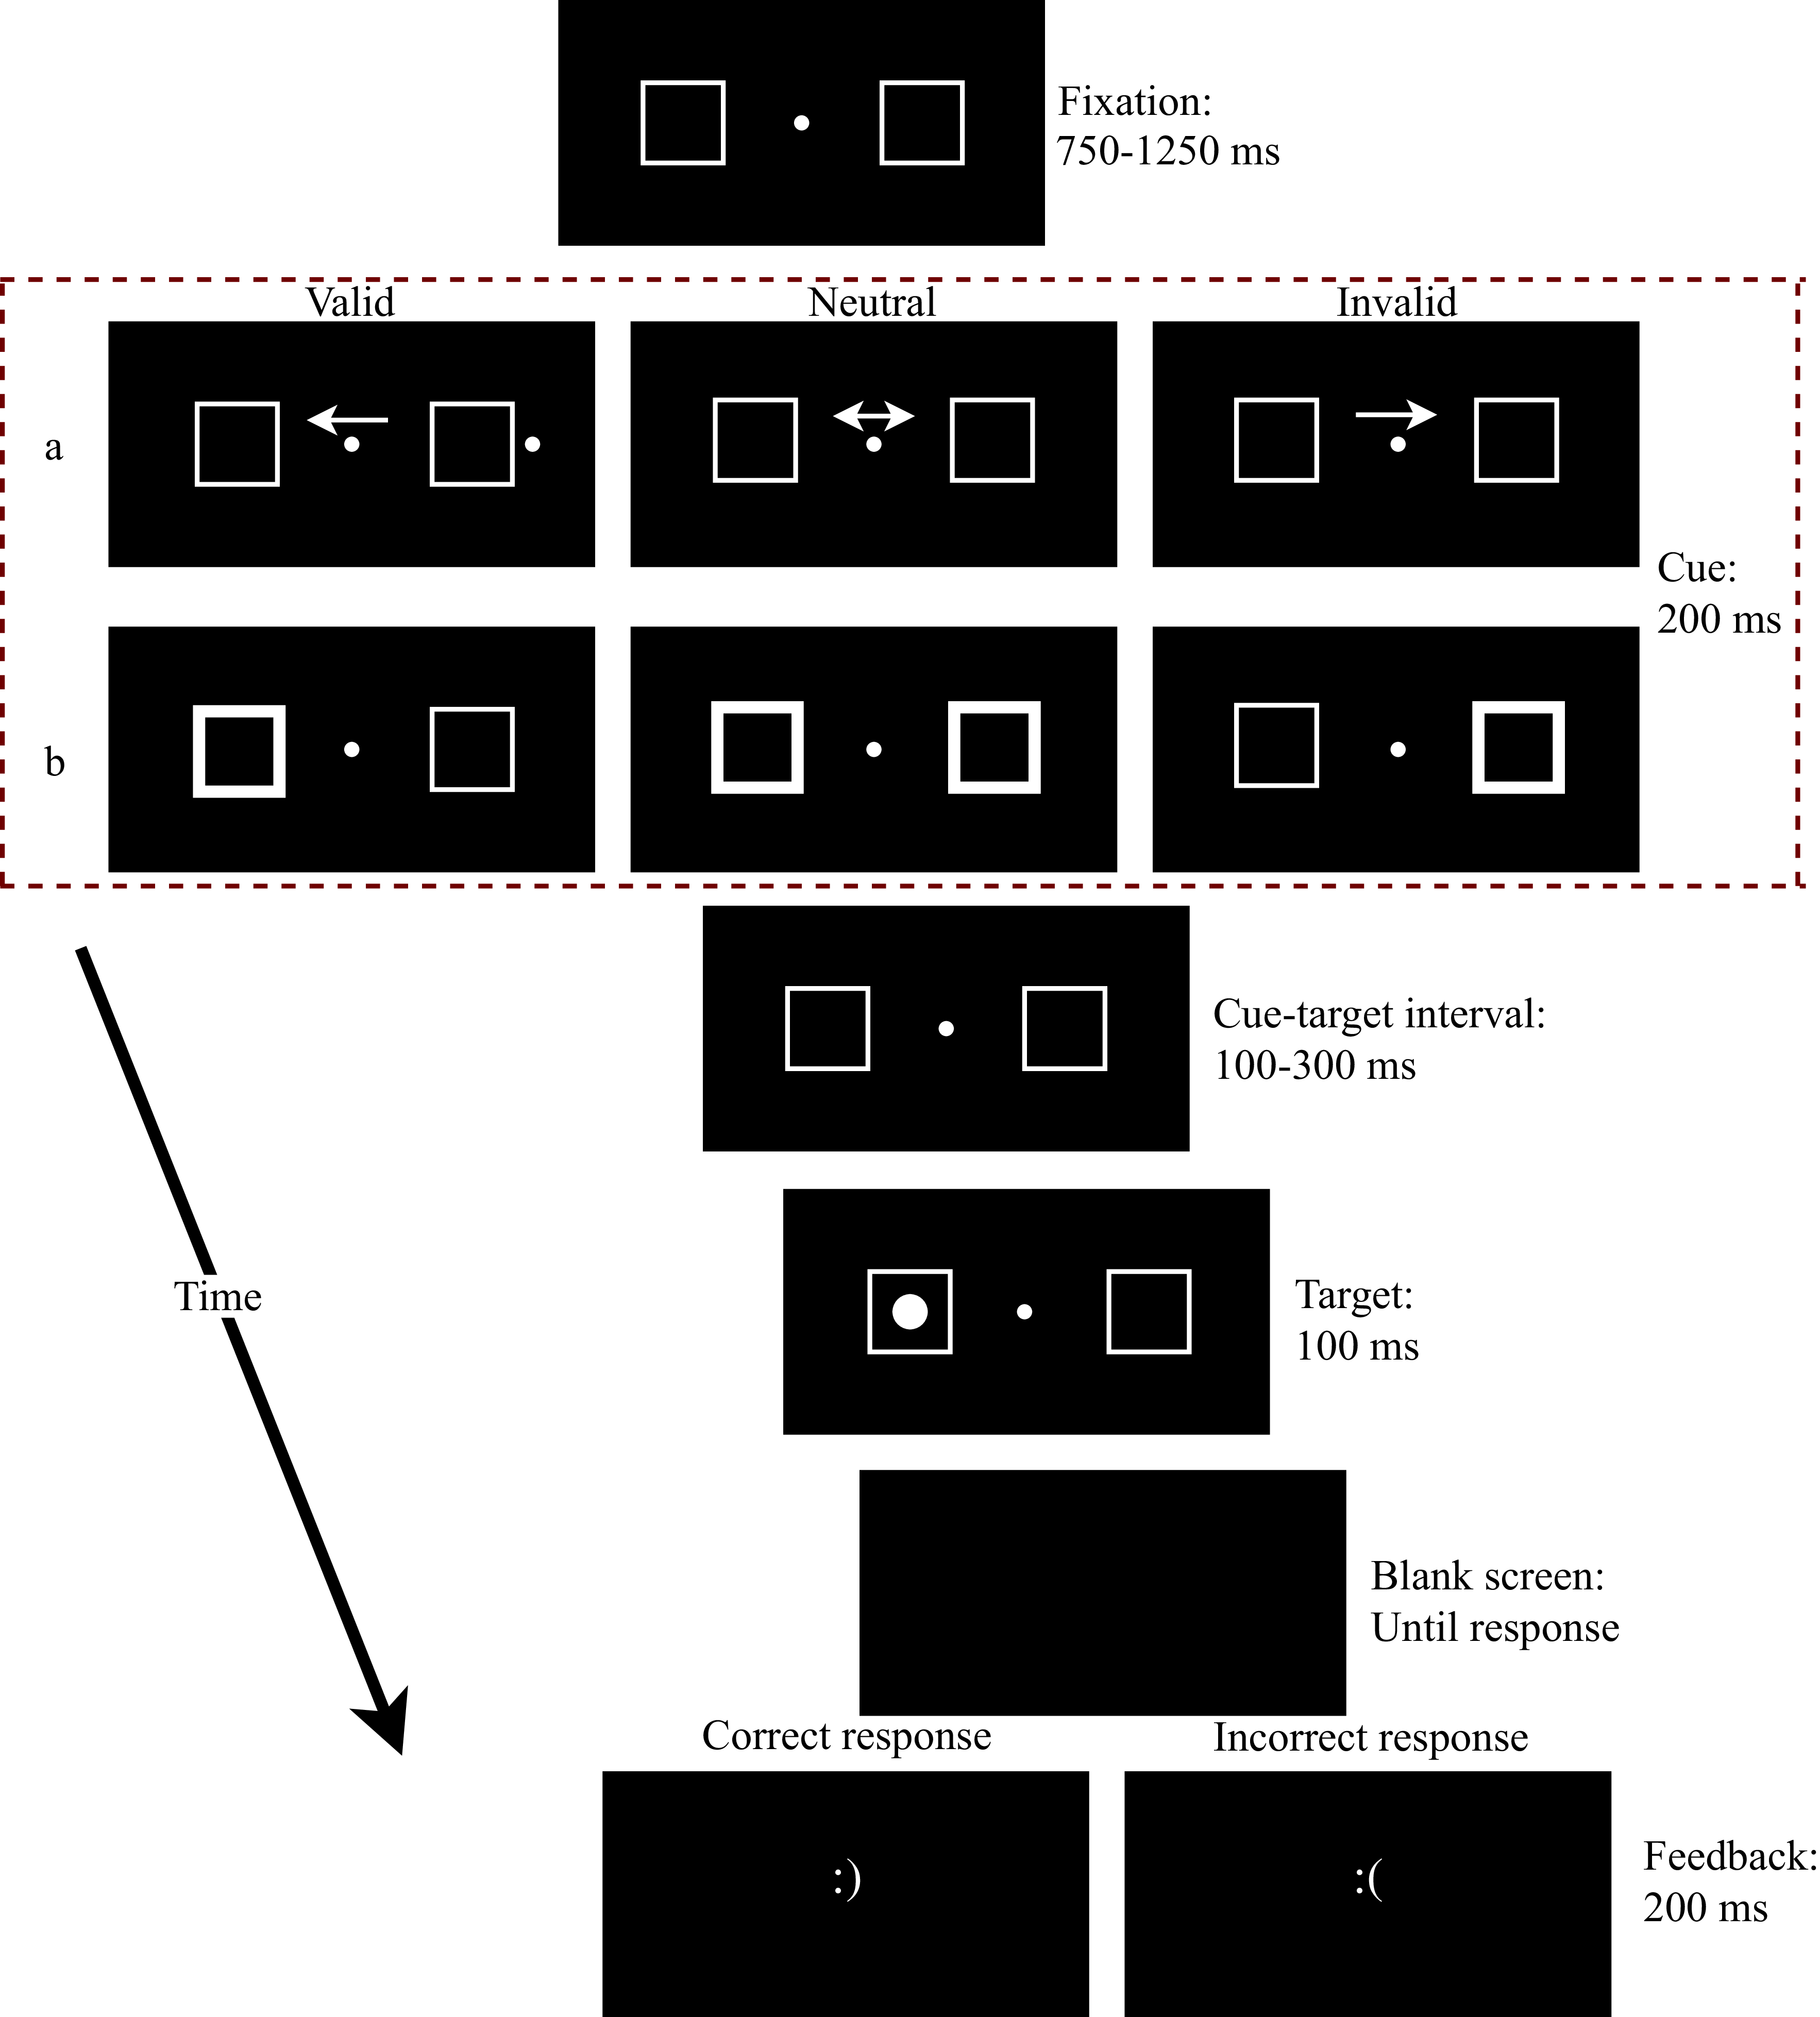
Covert attention was measured using a Spatial Cueing Task(Reference Posner44) with peripheral and central cue conditions (Figure 2). In the task, participants were instructed to gaze at the fixation point throughout the trial and respond as quickly and accurately as possible when they detect the target stimulus (a white circle) appearing in the right or left box, following either a central or peripheral cue. In each trial, a fixation point at the centre of the screen and two peripheral boxes were displayed for a period varying between 750 and 1250 ms. A visual cue directing attention was then presented for 200 ms. After the visual cue disappeared, the target stimulus was displayed for 100 ms in one of the two boxes, with a cue-target interval ranging from 100 to 300 ms. This interval was varied to minimise the temporal orienting of attention. Participants were instructed to press the A key if the target stimulus appeared in the left box, and the L key if it appeared in the right box. Since there was no time limit for participants to respond, the next trial began only after a response was given. Depending on the accuracy of their response, either a happy or a sad smiley appeared for 200 ms as feedback.
Schematic representation of the spatial cueing task: (a) central cue condition; (b) peripheral cue condition.

The central cue is an arrow (→, ←, ↔) pointing to one or both boxes, presented at an eccentricity of 10·1° of visual angle from the fixation cross (Figure 2a). The arrow was displayed 0·75° above the fixation cross and its size was 32× 20 pixels (0·84° by 0·51°). The peripheral cue (Figure 2b) involves an increase in the line width of one or both boxes from 1 pixel (approximately 0·03°) to 5 pixels (0·13°). In both the central and peripheral cue conditions, valid cues direct attention towards the target-present box, while invalid cues direct attention toward the target-absent box. Neutral cues do not provide any spatial information about the target location. They were a double-sided arrow or an increase in the line width of both boxes. A white circle as a target appeared in the centre of one of two boxes. The radius of the target was 12 pixels, and it was presented at an eccentricity of 10·1° (384 pixels) in either the left or right visual field. All visual stimuli were white (RGB 255, 255, 255) and were presented against a black background (RGB 0, 0, 0).
In both cue conditions, there were six experimental blocks and one practice block, each consisting of thirty trials. In the peripheral cue condition, each block contained an equal number of valid, invalid and neutral cues. To prevent participants from disregarding central cues, a higher proportion of valid to invalid cues was used. Therefore, one-third of the thirty trials in each block involved neutral cues. For the remaining twenty trials, valid cues were presented in 80 % of trials (sixteen trials), while invalid cues were presented in 20 % (four trials).
Visual search task
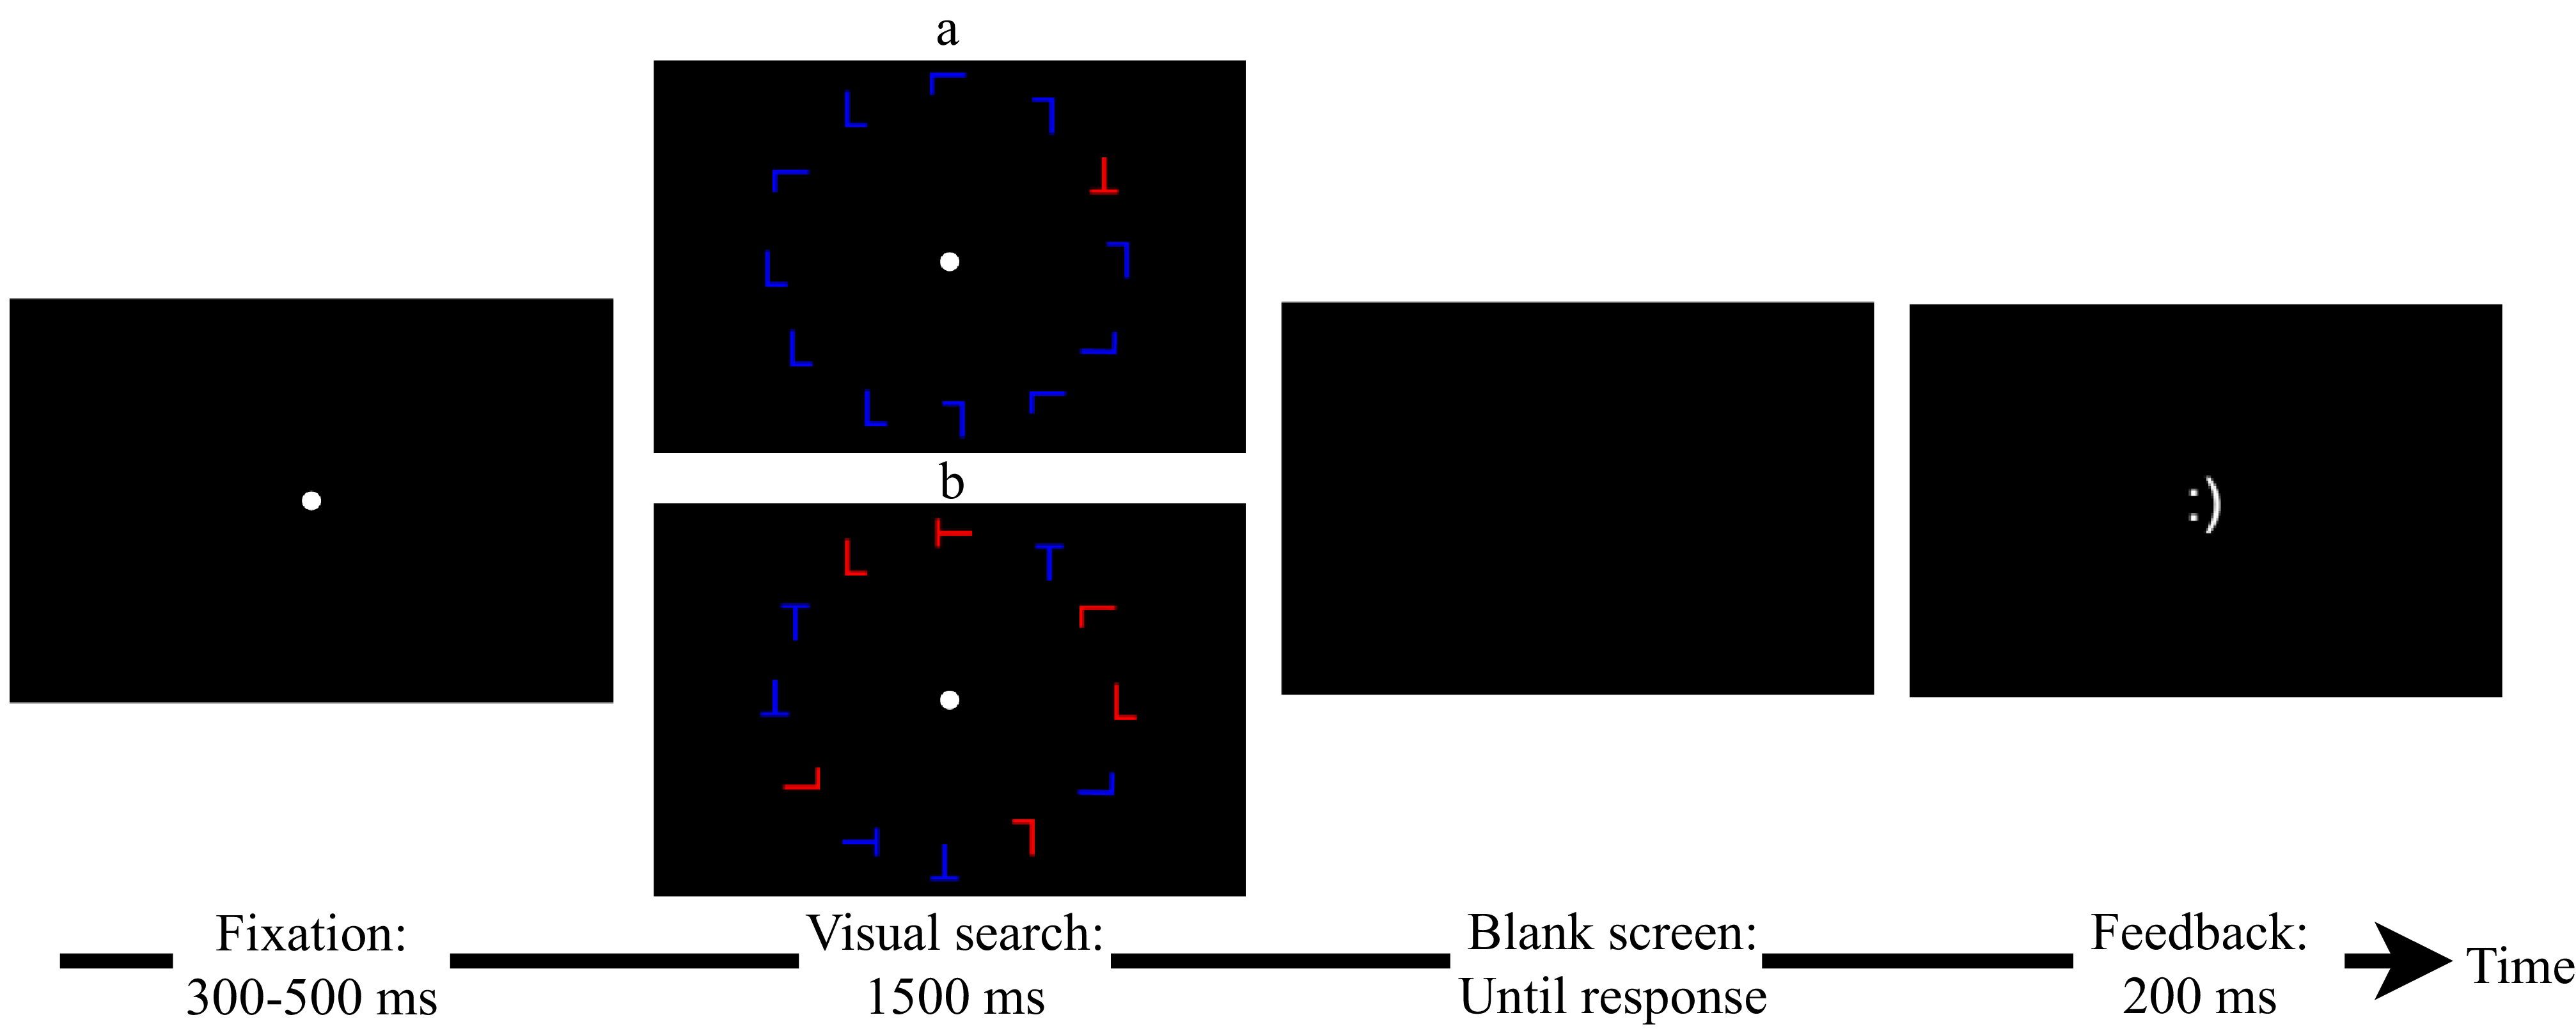
The visual search task (VST)(Reference Treisman and Gelade45) consisted of feature and conjunction search conditions (Figure 3). In both conditions, participants were instructed to search for the target stimulus among distractors on the display and respond as quickly and accurately as possible by pressing a specific key corresponding to the target orientation. Search performance was measured by manipulating the number of items in the display (set size). The set size in each trial was either 12, 18 or 24. Apart from the set size, the similarity between target and distractors is also an important factor in determining search performance(Reference Wolfe46). Therefore, letters with common characteristics were used for both the target and distractors. In blocks where the target was a red ‘T’, distractors were blue ‘L’ in the feature search condition and red ‘L’ and blue ‘T’ in the conjunction search condition. In blocks where the target stimulus was a blue ‘T’, distractors were red ‘L’ in the feature search condition and blue ‘L’ and red ‘T’ in the conjunction search condition. Since distractor-distractor similarity causes perceptual grouping(Reference Duncan and Humphreys47,Reference Müller-Oehring, Schulte and Rohlfing48) , all letters were presented upright or rotated clockwise by 90°, 180° or 270°. The letters were positioned equidistant from the fixation point at a distance of 457 pixels (12° of visual angle), forming a circular arrangement. The letter ‘T’ was sized at 48 × 38·4 pixels (1·23° × 1·01°), while the letter ‘L’ was sized at 48 × 28·8 pixels (1·23° × 0·76°). Red letters (RGB 255, 0, 0) and blue letters (RGB 0, 0, 255) were presented against a black background.
Schematic representation of the visual search task: (a) feature search condition; (b) conjunction search condition.

At the beginning of each trial, a central fixation point was displayed for a duration between 300 and 500 ms. Then, the search display, in which participants were to detect the target stimulus, was shown for 1500 ms. Participants were instructed to press the ‘←’ key in trials where the target was rotated 90° clockwise, the ‘↑’ key in trials where it was rotated 180°, and the ‘→’ key in trials where it was rotated 270°. In trials where the target was presented upright, participants were instructed to press the ‘↓’ key as quickly and accurately as possible. Participants kept four fingers resting on the predetermined response keys throughout the task. The search display was replaced by a blank screen, which remained until a response was given. Depending on the accuracy of the response, either a happy or a sad smiley appeared for 200 ms as feedback. This task consisted of one practice block and sixteen experimental blocks, each containing twenty-four trials (384 trials in total). The target stimulus was a red ‘T’ in eight experimental blocks, while it was the blue ‘T’ in the remaining eight. These blocks were presented in a random order.
Procedure
Participants were informed that they would be taking part in a study exploring the effects of cocoa consumption on visual attention. Upon completing three experimental sessions, they received a gift card and bonus points for one of the courses they were enrolled in. To encourage participants to complete attention tasks as accurately and quickly as possible, an additional gift card was given to the two top performers. Experimental sessions took place between November 2022 and January 2023. Experiments were conducted at the Cognitive Psychology Laboratory of Necmettin Erbakan University.
Before the experimental sessions, participants were asked about their consumption of flavanol-containing foods and beverages over the previous month, based on the list reported by Manach et al.(Reference Manach, Scalbert and Morand49). This information was used to assess whether estimated daily flavanol intake differed across the counterbalanced allocation sequences.
On the first visit, the participants’ body weight and height were measured, and the Ishihara test was administered to ensure none of the participants had colour blindness. Gender, age and handedness were also recorded.
A list of products prohibited during the 8-h pre-session period was provided to participants. To ensure compliance with these instructions, participants were informed that saliva samples would be collected with a cotton swab each time they came to the laboratory, as well as just before the test session. They were also told that the analysis would detect substances consumed within the last 8 h. The saliva samples were collected but not analysed. Participants were encouraged to cooperate by being informed that the test session could be postponed to the following week if they consumed any prohibited products.
Half of the participants (twelve male and twelve female) completed the Spatial Cueing Task followed by the VST, whereas the remaining participants completed the tasks in the reverse order. Practice blocks were completed before the experimental blocks, and data from the practice blocks were omitted from the analyses. Participants were informed that they could take brief optional breaks between blocks and were given a 5-minute break between the two tasks. The structure of each of the three testing sessions is summarised in Figure 4.
Structure of the three experimental testing sessions. The figure illustrates one of the 12 counterbalanced allocation sequences (Group E1). The timeline shows the schedule followed by participants who received the experimental product at 9:00 am.

Statistical analyses
A three-way repeated measures ANOVA, with factors of 3 experimental product (control, placebo and flavanol) × 2 cue type (central, peripheral) × 3 cue validity (invalid, neutral and valid), was performed on the Spatial Cueing Task for accuracy and reaction time (RT). The same analysis, with factors of three experimental product × 2 search type (feature, conjunction) × 3 set size (12, 18, 24-letter), was conducted for the VST. First, the data were screened for potential outliers, with a z-score cut-off of 2. Anticipatory and unintentional responses (RT < 100 ms) were omitted from the data analysis. Additionally, only correctly responded trials were included in RT analyses. When Mauchly’s test of sphericity was violated, Greenhouse–Geisser or Huynh–Feldt corrections were applied based on the estimated epsilon. Bonferroni-adjusted pairwise comparisons were conducted following significant main or interaction effects to control the family-wise error rate. For significant main effects, comparisons were based on estimated marginal means collapsed across the other factors, whereas for significant interactions, comparisons were performed between the relevant levels of the interacting factors. Descriptive statistics are presented as mean ± sd, whereas values reported for repeated-measures ANOVA effects are presented as estimated marginal means ± se of the mean (sem). Statistical significance was set at α = .05. Partial eta squared (η p 2) was used as the measure of effect size. The data analysis was run in JASP 0.16.4.
To assess whether the observed correlations among repeated measures affected the study’s sensitivity, pairwise Pearson correlations were calculated between mean scores in the control, placebo and flavanol conditions, separately for accuracy and reaction time in the VST and SCT. For each task and outcome, the three pairwise correlations were combined into a single overall estimate using Fisher’s z transformation(Reference Silver and Dunlap50). Sensitivity analyses for the main effect of the experimental product were then conducted using G*Power 3.1.9.4(Reference Faul, Erdfelder and Lang39) with the corresponding correlation estimate, a final sample size of 48, α = .05, 1 – β = .95, one group, three measurements and the nonsphericity correction applied in the corresponding primary analysis.
Results
Participant characteristics
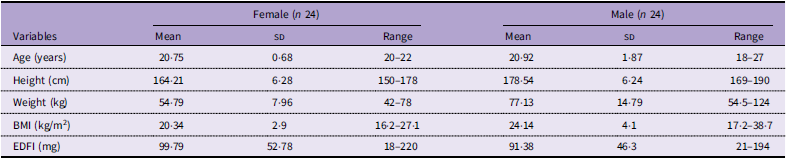
Participant characteristics are presented in Table 2. A one-way ANOVA showed that estimated daily flavanol intake over the previous month did not differ significantly across the six counterbalanced allocation sequences (F 5,42 = .37, p = .87, η p 2 = .04).
Participant characteristics

Table 2. Long description
A table comparing characteristics of female and male participants. The table has 6 rows and 7 columns. Column headers are Variables, Female (n 24) Mean, Female (n 24) SD, Female (n 24) Range, Male (n 24) Mean, Male (n 24) SD, Male (n 24) Range. Row labels are Age (years), Height (cm), Weight (kg), BMI (kg per square meter), EDFI (mg). Row 1: Age (years), 20.75, 0.68, 20-22, 20.92, 1.87, 18-27. Row 2: Height (cm), 164.21, 6.28, 150-178, 178.54, 6.24, 169-190. Row 3: Weight (kg), 54.79, 7.96, 42-78, 77.13, 14.79, 54-124. Row 4: BMI (kg per square meter), 20.34, 2.9, 16.2-27.1, 24.14, 4.1, 17.2-38.7. Row 5: EDFI (mg), 99.79, 52.78, 18-220, 91.38, 46.3, 21-194.
EDFI, estimated daily flavanol intake.
Spatial cueing task
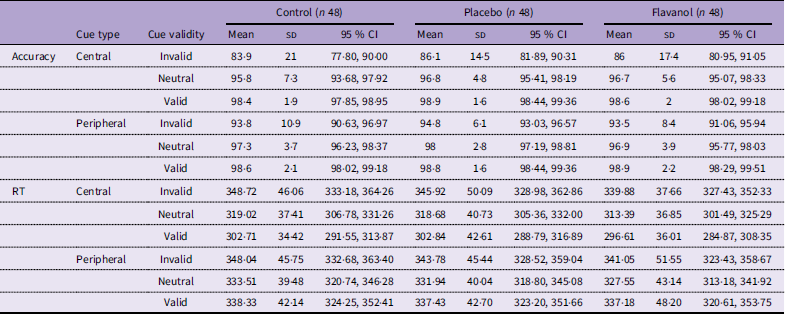
Descriptive statistics for accuracy and RT in SCT are demonstrated in Table 3.
Accuracy (%) and RT (ms) in spatial cueing task

Long description
A table comparing accuracy and reaction time in a spatial cueing task across different conditions. The table has 48 rows and 11 columns. Column headers are: Cue type, Cue validity, Control (n 48) Mean, Control (n 48) SD, Control (n 48) 95 percent CI, Placebo (n 48) Mean, Placebo (n 48) SD, Placebo (n 48) 95 percent CI, Flavanol (n 48) Mean, Flavanol (n 48) SD, Flavanol (n 48) 95 percent CI. Row labels include combinations of Cue type (Accuracy, RT) and Cue validity (Central Invalid, Central Neutral, Central Valid, Peripheral Invalid, Peripheral Neutral, Peripheral Valid). Row 1: Accuracy, Central, Invalid, 83.9, 21, 77.80, 90.00, 86.1, 14.5, 81.89, 90.31, 86, 17.4, 80.95, 91.05. Row 2: Accuracy, Central, Neutral, 95.8, 7.3, 93.68, 97.92, 96.8, 4.8, 95.41, 98.19, 96.7, 5.6, 95.07, 98.33. Row 3: Accuracy, Central, Valid, 98.4, 1.9, 97.85, 98.95, 98.9, 1.6, 98.44, 99.36, 98.6, 2, 98.02, 99.18. Row 4: Accuracy, Peripheral, Invalid, 93.8, 10.9, 90.63, 96.97, 94.8, 6.1, 93.03, 96.57, 93.5, 8.4, 91.06, 95.94. Row 5: Accuracy, Peripheral, Neutral, 97.3, 3.7, 96.23, 98.37, 98, 2.8, 97.19, 98.81, 96.9, 3.9, 95.77, 98.03. Row 6: Accuracy, Peripheral, Valid, 98.6, 2.1, 98.02, 99.18, 98.8, 1.6, 98.44, 99.36, 98.9, 2.2, 98.29, 99.51. Row 7: RT, Central, Invalid, 348.72, 46.06, 333.18, 364.26, 345.92, 50.09, 328.98, 362.86, 339.88, 37.66, 327.43, 352.33. Row 8: RT, Central, Neutral, 319.02, 37.41, 306.78, 331.26, 318.68, 40.73, 305.36, 332.00, 313.39, 36.85, 301.49, 325.29. Row 9: RT, Central, Valid, 302.71, 34.42, 291.55, 313.87, 302.84, 42.61, 288.79, 316.89, 296.61, 36.01, 284.87, 308.35. Row 10: RT, Peripheral, Invalid, 348.04, 45.75, 332.68, 363.40, 343.78, 45.44, 328.52, 359.04, 341.05, 51.55, 323.43, 358.67. Row 11: RT, Peripheral, Neutral, 333.51, 39.48, 320.74, 346.28, 331.94, 40.04, 318.80, 345.08, 327.55, 43.14, 313.18, 341.92. Row 12: RT, Peripheral, Valid, 338.33, 42.14, 324.25, 352.41, 337.43, 42.70, 323.20, 351.66, 337.18, 48.20, 320.61, 353.75.
RT, reaction time.
Accuracy
Three-way repeated measures ANOVA results revealed a main effect of cue type (F 1,47 = 36·63, p < .001, η p 2 = .44) and cue validity (F 1·04,49·03 = 35·54, p < .001, η p 2 = .43) on accuracy. Mean accuracy was 93·5 % in the central cue condition and 96·7 % in the peripheral cue condition. Post hoc comparisons showed that the performance in the invalid trials was lower than in the neutral (t 93 = 6·38, p < .001) and valid trials (t 93 = 7·96, p < .001). However, no significant difference in accuracy was found between neutral and valid trials (t 93 = 1·59, p = .35). Mean accuracy in the invalid, neutral and valid trials was 89·7 %, 96·9 % and 98·7 %, respectively.
A significant interaction effect was found between cue type and cue validity (F 1·14,53·47 = 31·94, p < .001, η p 2 = .41). In the central cue condition, participants showed lower accuracy in invalid trials than in neutral (t 90 = 8·67, p < .001) and valid (t 90 = 10·41, p < .001) trials. In the peripheral cue condition, accuracy was lower in invalid trials than in valid trials (t 90 = 3·44, p < .01).
Both the main effect of experimental product (F 1·83,85·85 = 1, p = .37, ϵ = .91, η p 2 = .02) and the interaction effects of experimental product and cue type (F 1·81,85·07 = 2·03, p = .14, ϵ = .91, η p 2 = .04), experimental product and cue validity (F 1·90,89.42 = .40, p = .66, ϵ = .48, η p 2 = .01), experimental product, cue type and cue validity (F 2·81,132·13 = 0·95, p = .42, ϵ = .70, η p 2 = .02) were not significant on accuracy. Therefore, these results showed that accuracy in the spatial cueing task only depended on stimulus manipulation.
Reaction time
The ANOVA results revealed a significant main effect of cue type (F 1,47 = 69·26, p < .001, η p 2 = .60) and cue validity (F 1·27,59·72 =110·17, p < .001, η p 2 = .70). Participants had better performance in central cue condition (320·87 ± 4·70 sem) compared with peripheral cue condition (337·65 ± 4·90 sem). Post hoc comparisons showed that the RT was slower in invalid trials than in neutral (t 93 = 11·32, p < .001) and valid (t 93 = 13·98, p < .001) trials. Moreover, performance in valid trials was better than in neutral trials (t 93 = 2·66, p < .05).
The interaction effect of cue type and cue validity was found to be significant (F 1·73,81·06 = 117·11, p < .001, η p 2= .71). In the central cue condition, RTs were slower in invalid trials than in neutral (t 90 = 12·66, p < .001) and valid trials (t 90 = 20·09, p < .001), and slower in neutral trials than in valid trials (t 90 = 7·43, p < .001). In the peripheral cue condition, RTs were slower in invalid trials than in neutral (t 90 = 6·05, p < .001) and valid trials (t 90 = 3·03, p < .05). These findings indicate that the effect of cue validity on RT was present in both cue conditions, but was more pronounced in the central cue condition.
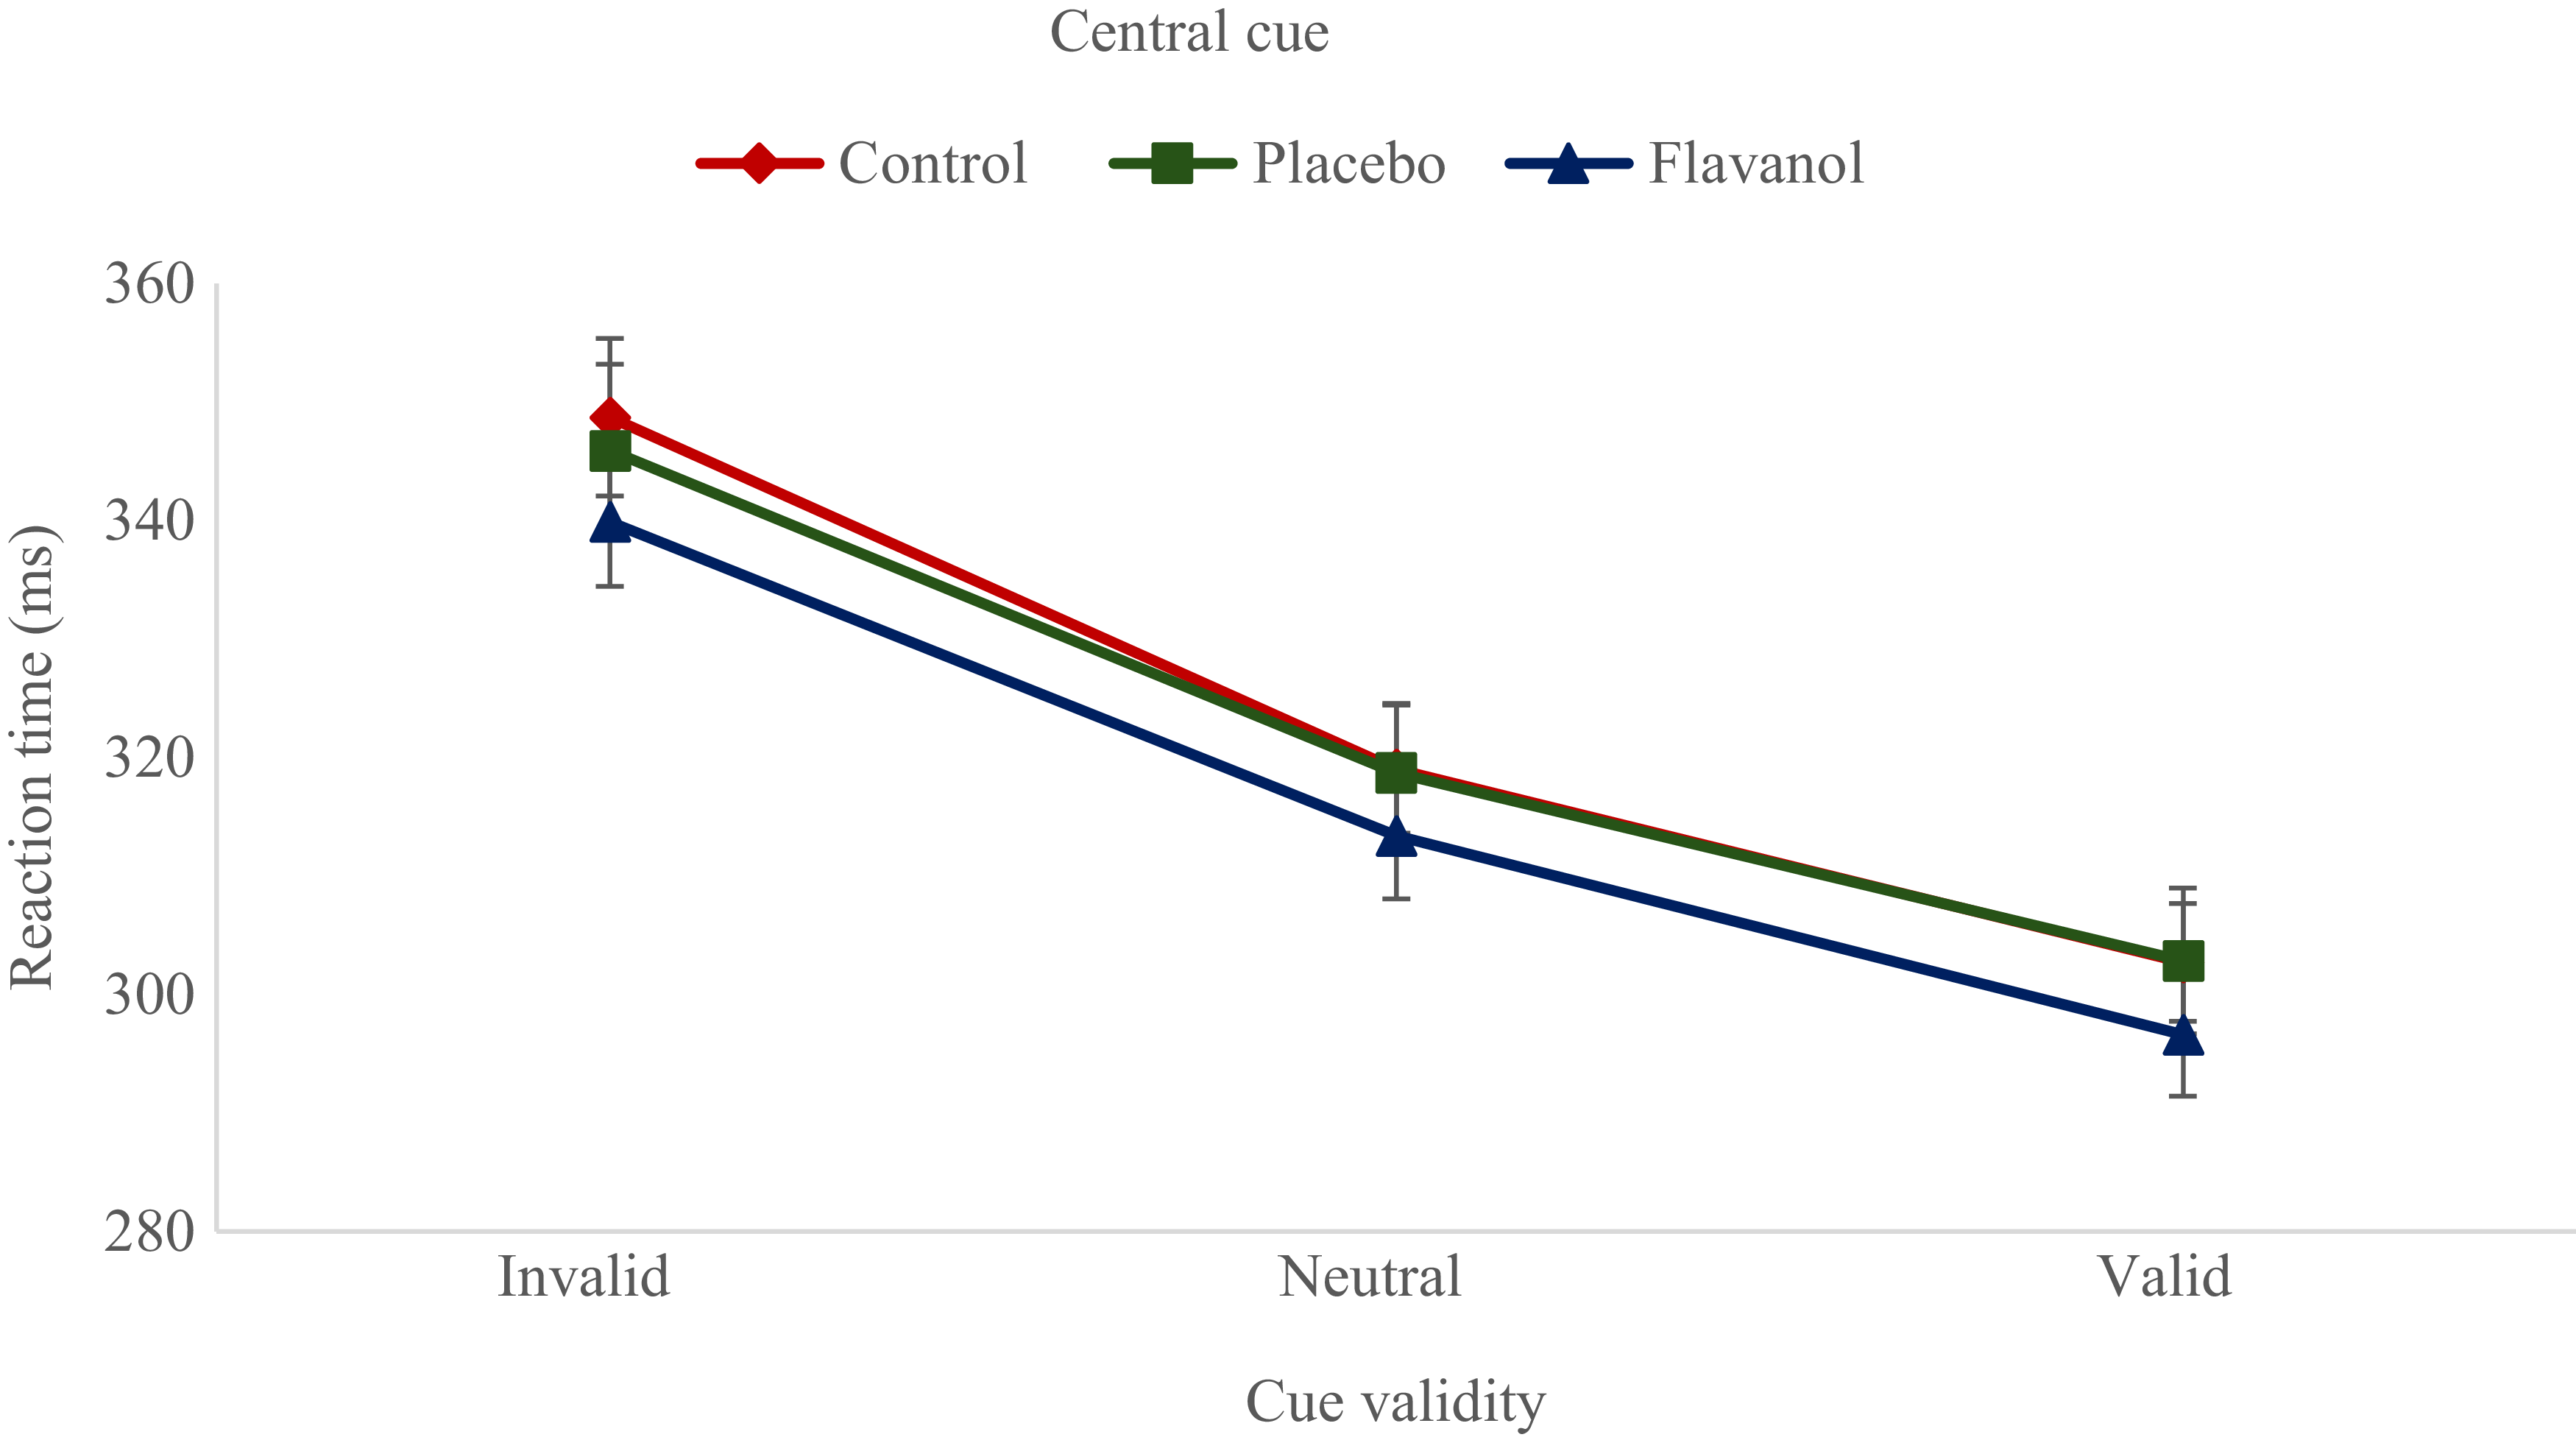
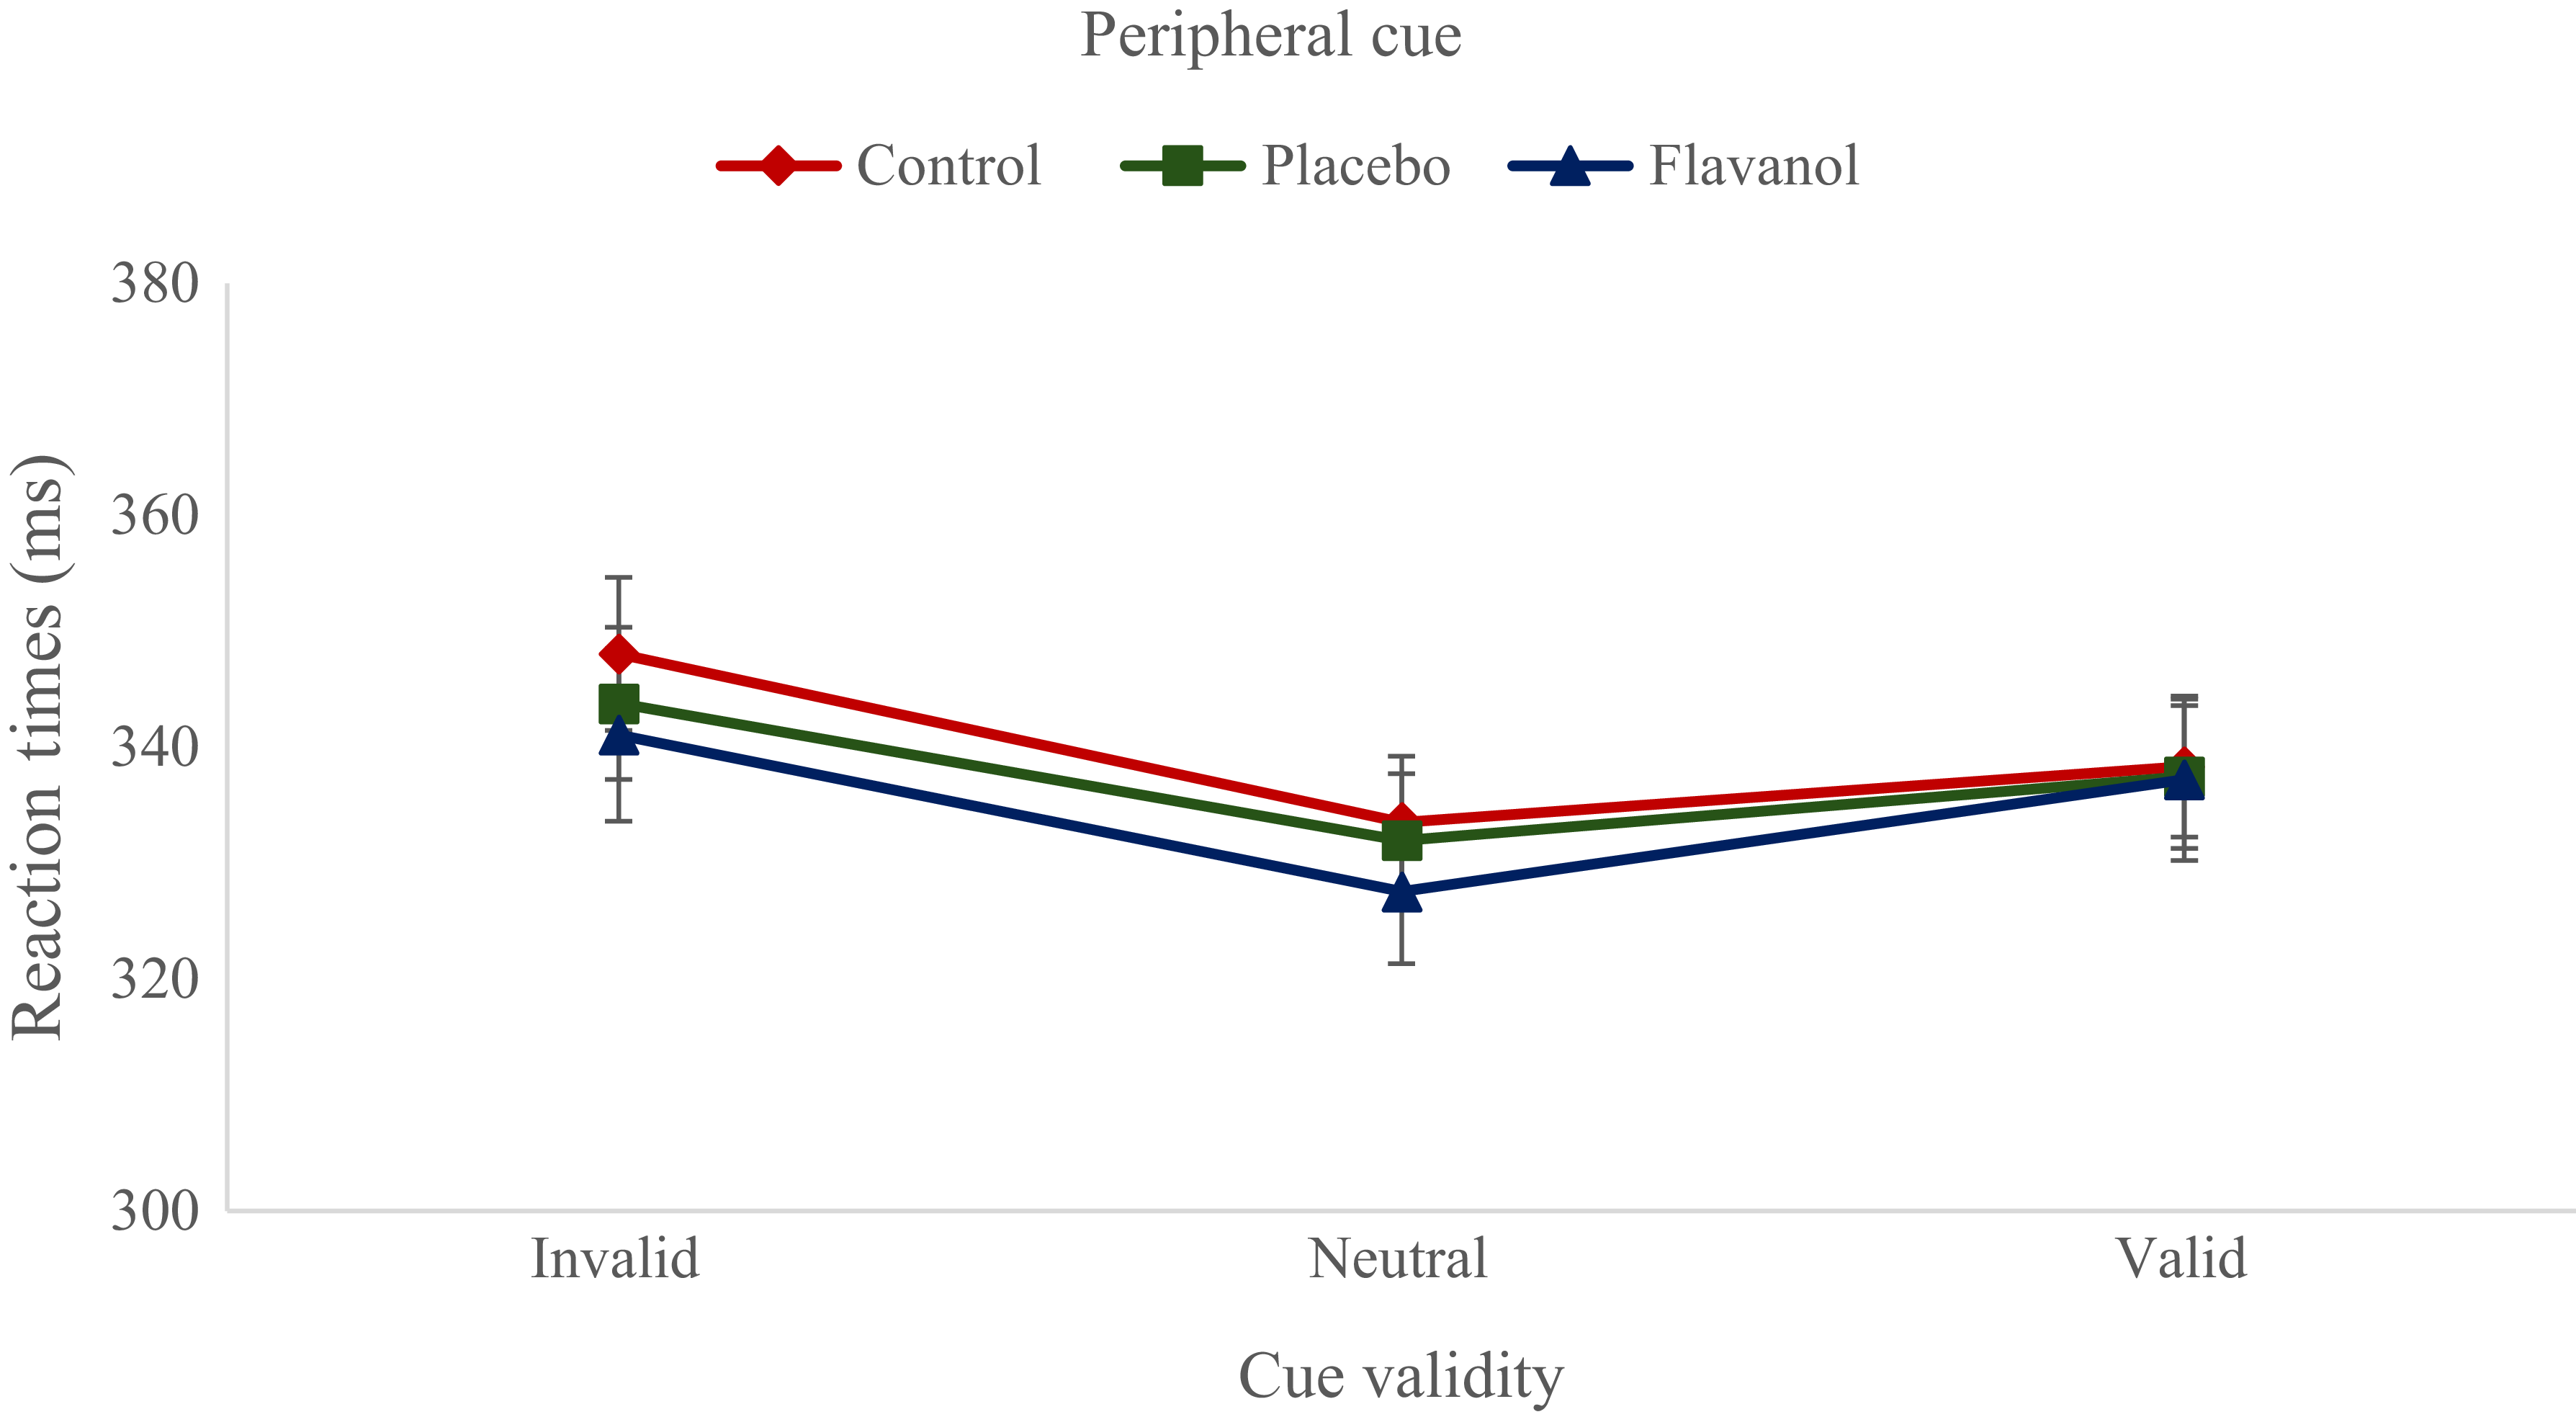
Even though mean RT was shortest in the flavanol condition (Figure 5 and Figure 6), the main effect of experimental product was not statistically significant (F 2,94 = .57, p = .57, η p 2 = .01). Additionally, the interaction effects of experimental product and cue type (F 1·57,73·96 = .33, p = .66, η p 2 = .01), experimental product and cue validity (F 3·48,163·48 = .90, p = .46, η p 2 = .02) and experimental product, cue type and cue validity (F 3·45,162·02 = .60, p = .64, η p 2 = .01) were all non-significant.
Reaction times in the central cue condition of the spatial cueing task. Data points represent means, and error bars indicate the standard error of the mean (sem).

Reaction times in the peripheral cue condition of the spatial cueing task. Data points represent means, and error bars indicate the standard error of the mean (sem).

Visual search task
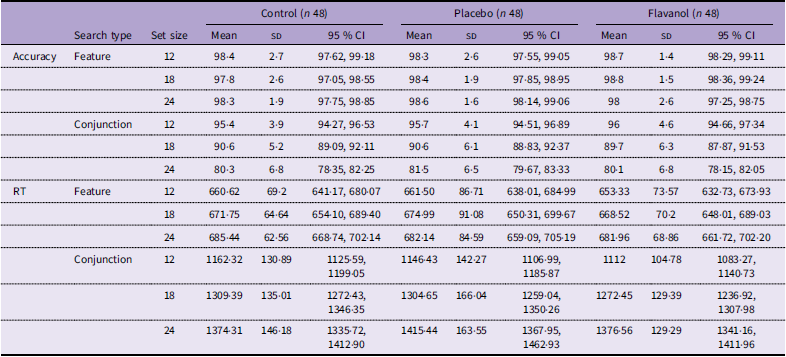
Descriptive statistics for accuracy and RT in VST are demonstrated in Table 4.
Accuracy (%) and RT (ms) in visual search task

Table 4. Long description
The table compares accuracy and response time in a visual search task across three conditions: Control, Placebo, and Flavanol. It has 12 rows and 12 columns. The columns are labeled as Search type, Set size, Control (n 48), Placebo (n 48), and Flavanol (n 48). Each of these columns is further divided into Mean, SD, and 95 % CI. The rows are labeled as Accuracy Feature, Accuracy Conjunction, RT Feature, and RT Conjunction, with set sizes of 12, 18, and 24. Each cell contains specific values for mean, standard deviation, and 95% confidence interval. Notable trends include higher accuracy and lower response times in the Flavanol condition compared to Control and Placebo conditions.
RT, reaction time.
Accuracy
According to three-way repeated measures ANOVA results, a significant main effect was found for search type (F 1,47 = 435, p < .001, η p 2 = .90) and set size (F 2,94 = 576·11, p < .001, η p 2 = .93). Mean accuracy was 98·4 % in the feature search trials, while it was 88·9 % in the conjunction search trials. Post hoc comparisons for set size revealed that the performance in the 12-letter trials was better than 18-letter trials (t 93 = 12·21, p < .001) and 24-letter trials (t 93 = 33·53, p < .001). Performance was also better in 18-letter trials compared with 24-letter trials (t 93 = 21·33, p < .001).
The interaction effect of search type and set size was also significant (F 2,94 = 448·92, p < .001, η p 2 = .91). In the conjunction search condition, accuracy was lower in 24-letter trials than 12-letter (t 90 = 44·40, p < .001) and 18-letter (t 90 = 28·44, p < .001) trials and lower in 18-letter trials than in 12-letter trials (t 90 = 15·96, p < .001). In contrast, set size had no significant effect on accuracy in the feature search condition (t 90 < 1, p = 1). These findings showed that increasing set size impaired accuracy only in the conjunction search condition.
Neither the main effect of experimental product (F 2,94 = .33, p = .72, η p 2 = .01), nor the interaction effects of experimental product and search type (F 2,94 = .42, p = .66, η p 2 = .01), experimental product and set size (F 4,188 = 1·46, p = .22, η p 2 = .03), experimental product, search type and set size (F 4,188 = 1·12, p = .35, η p 2 = .02) on accuracy were significant.
Reaction time
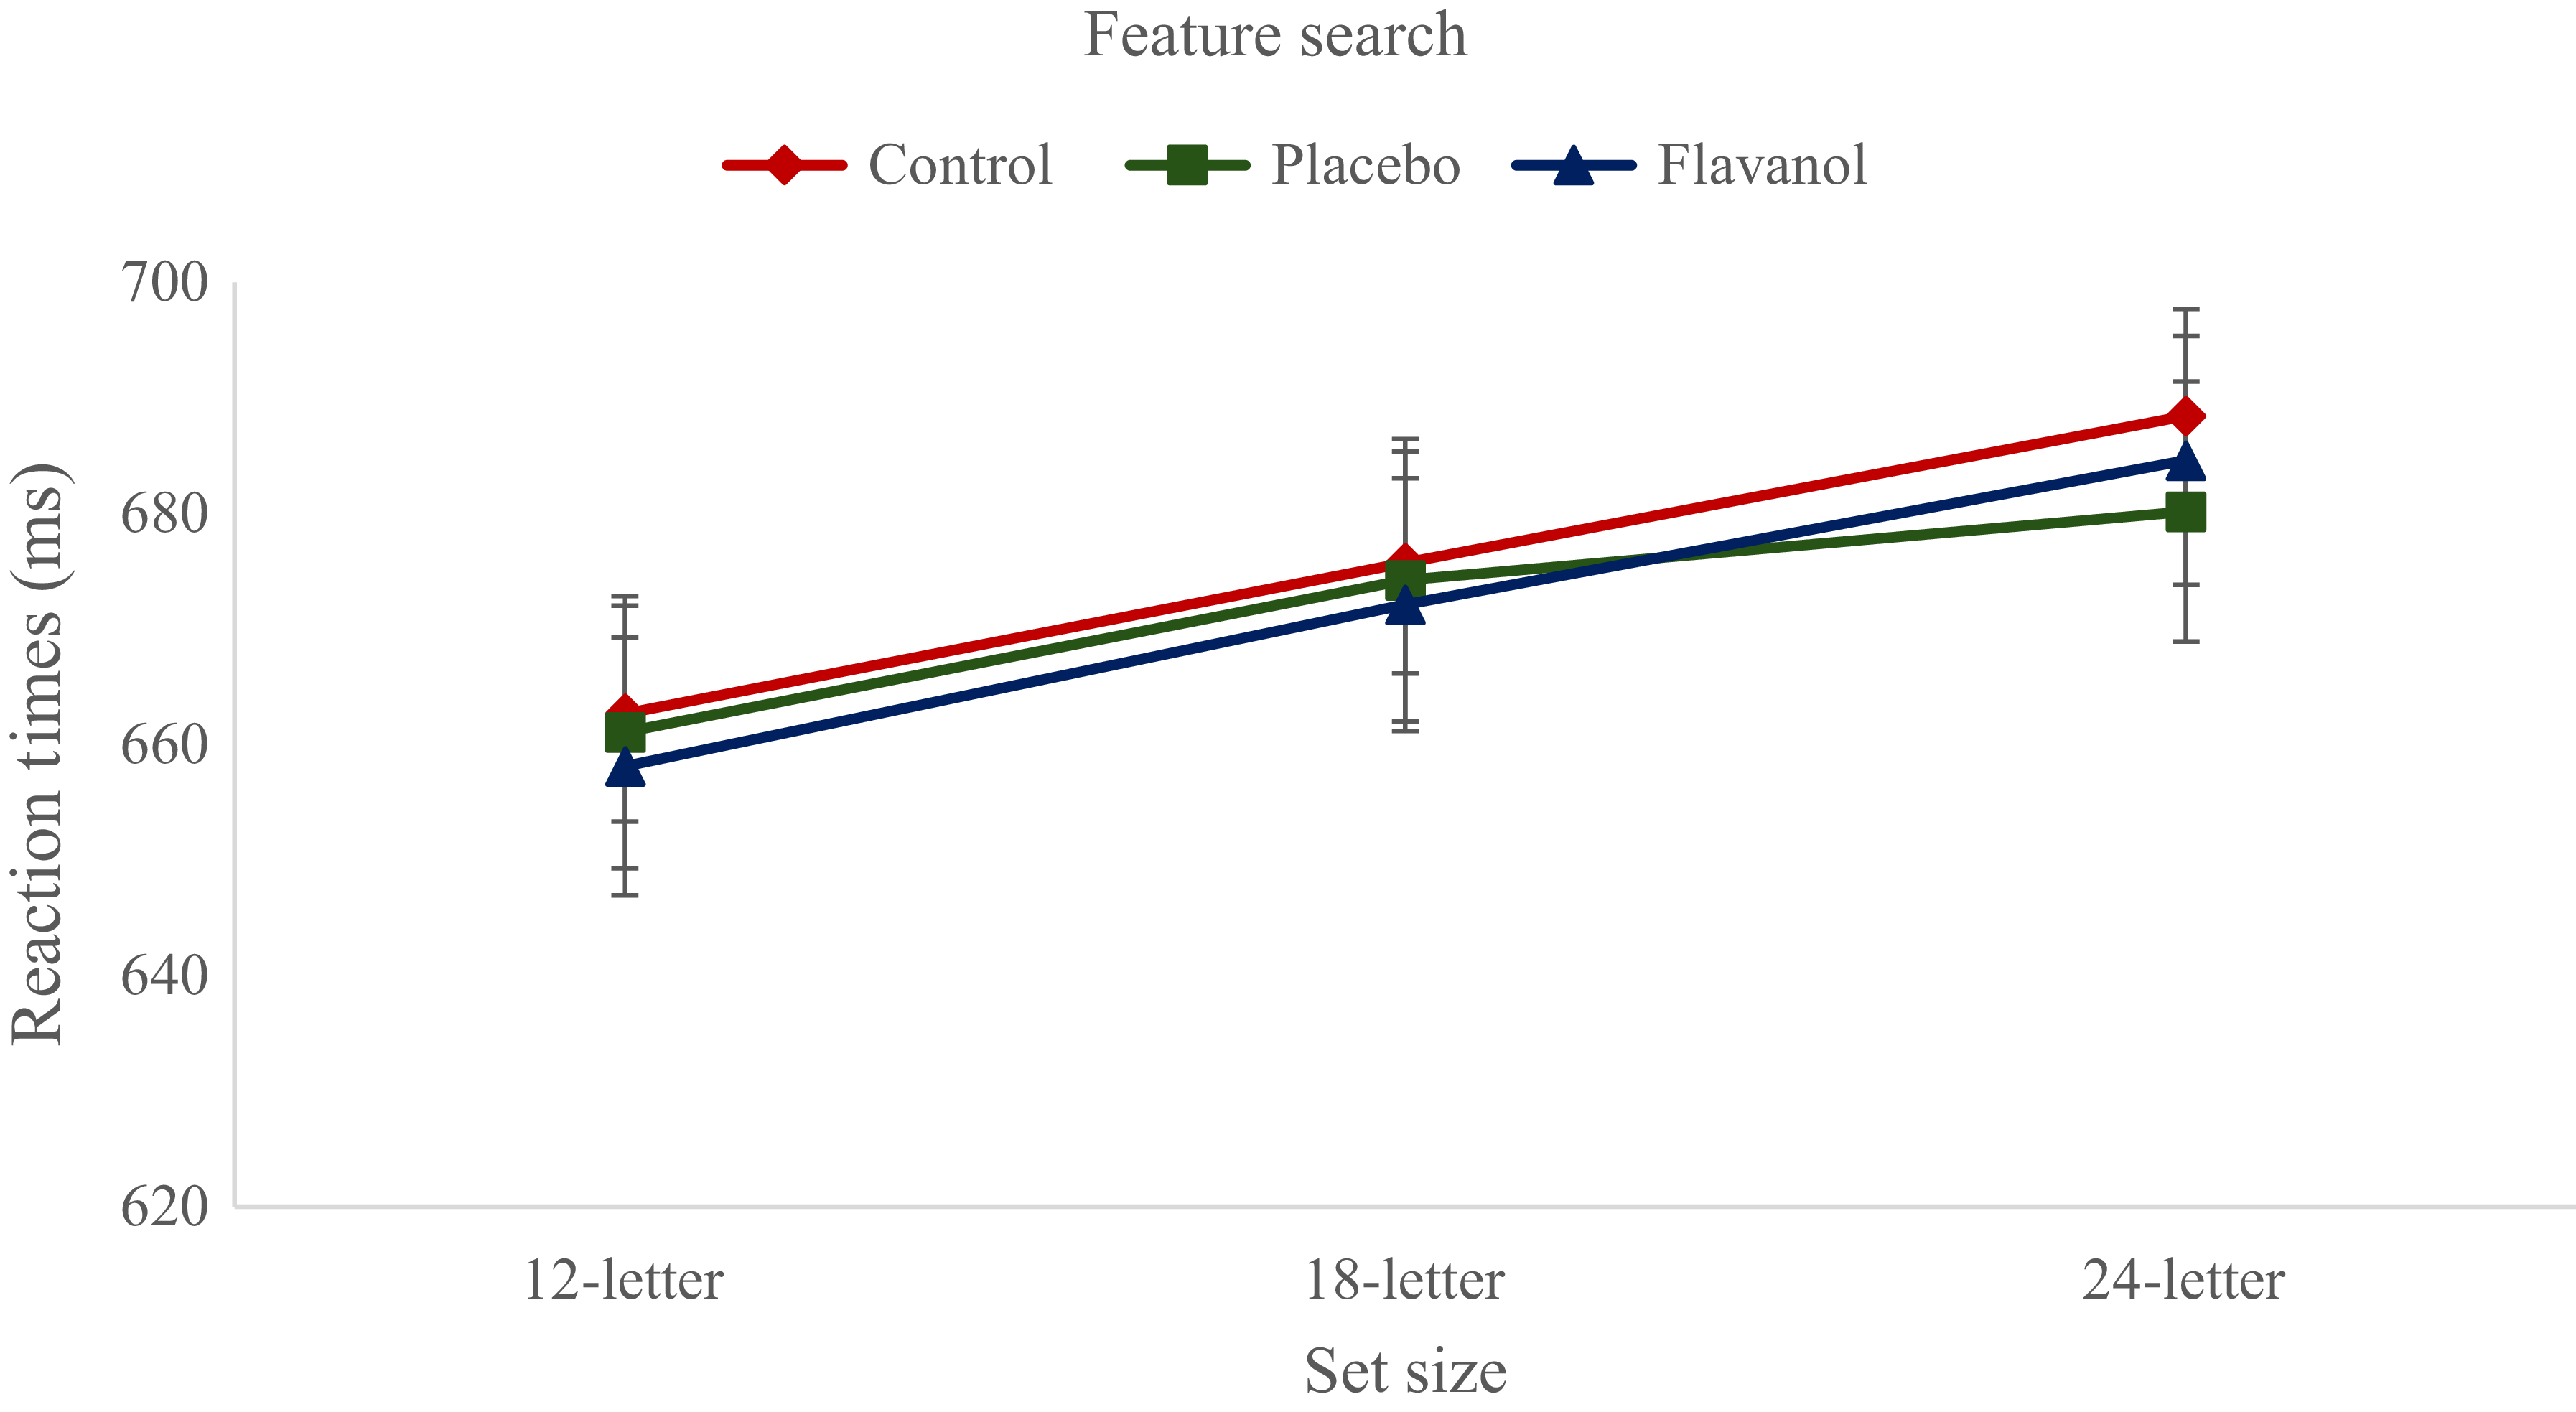
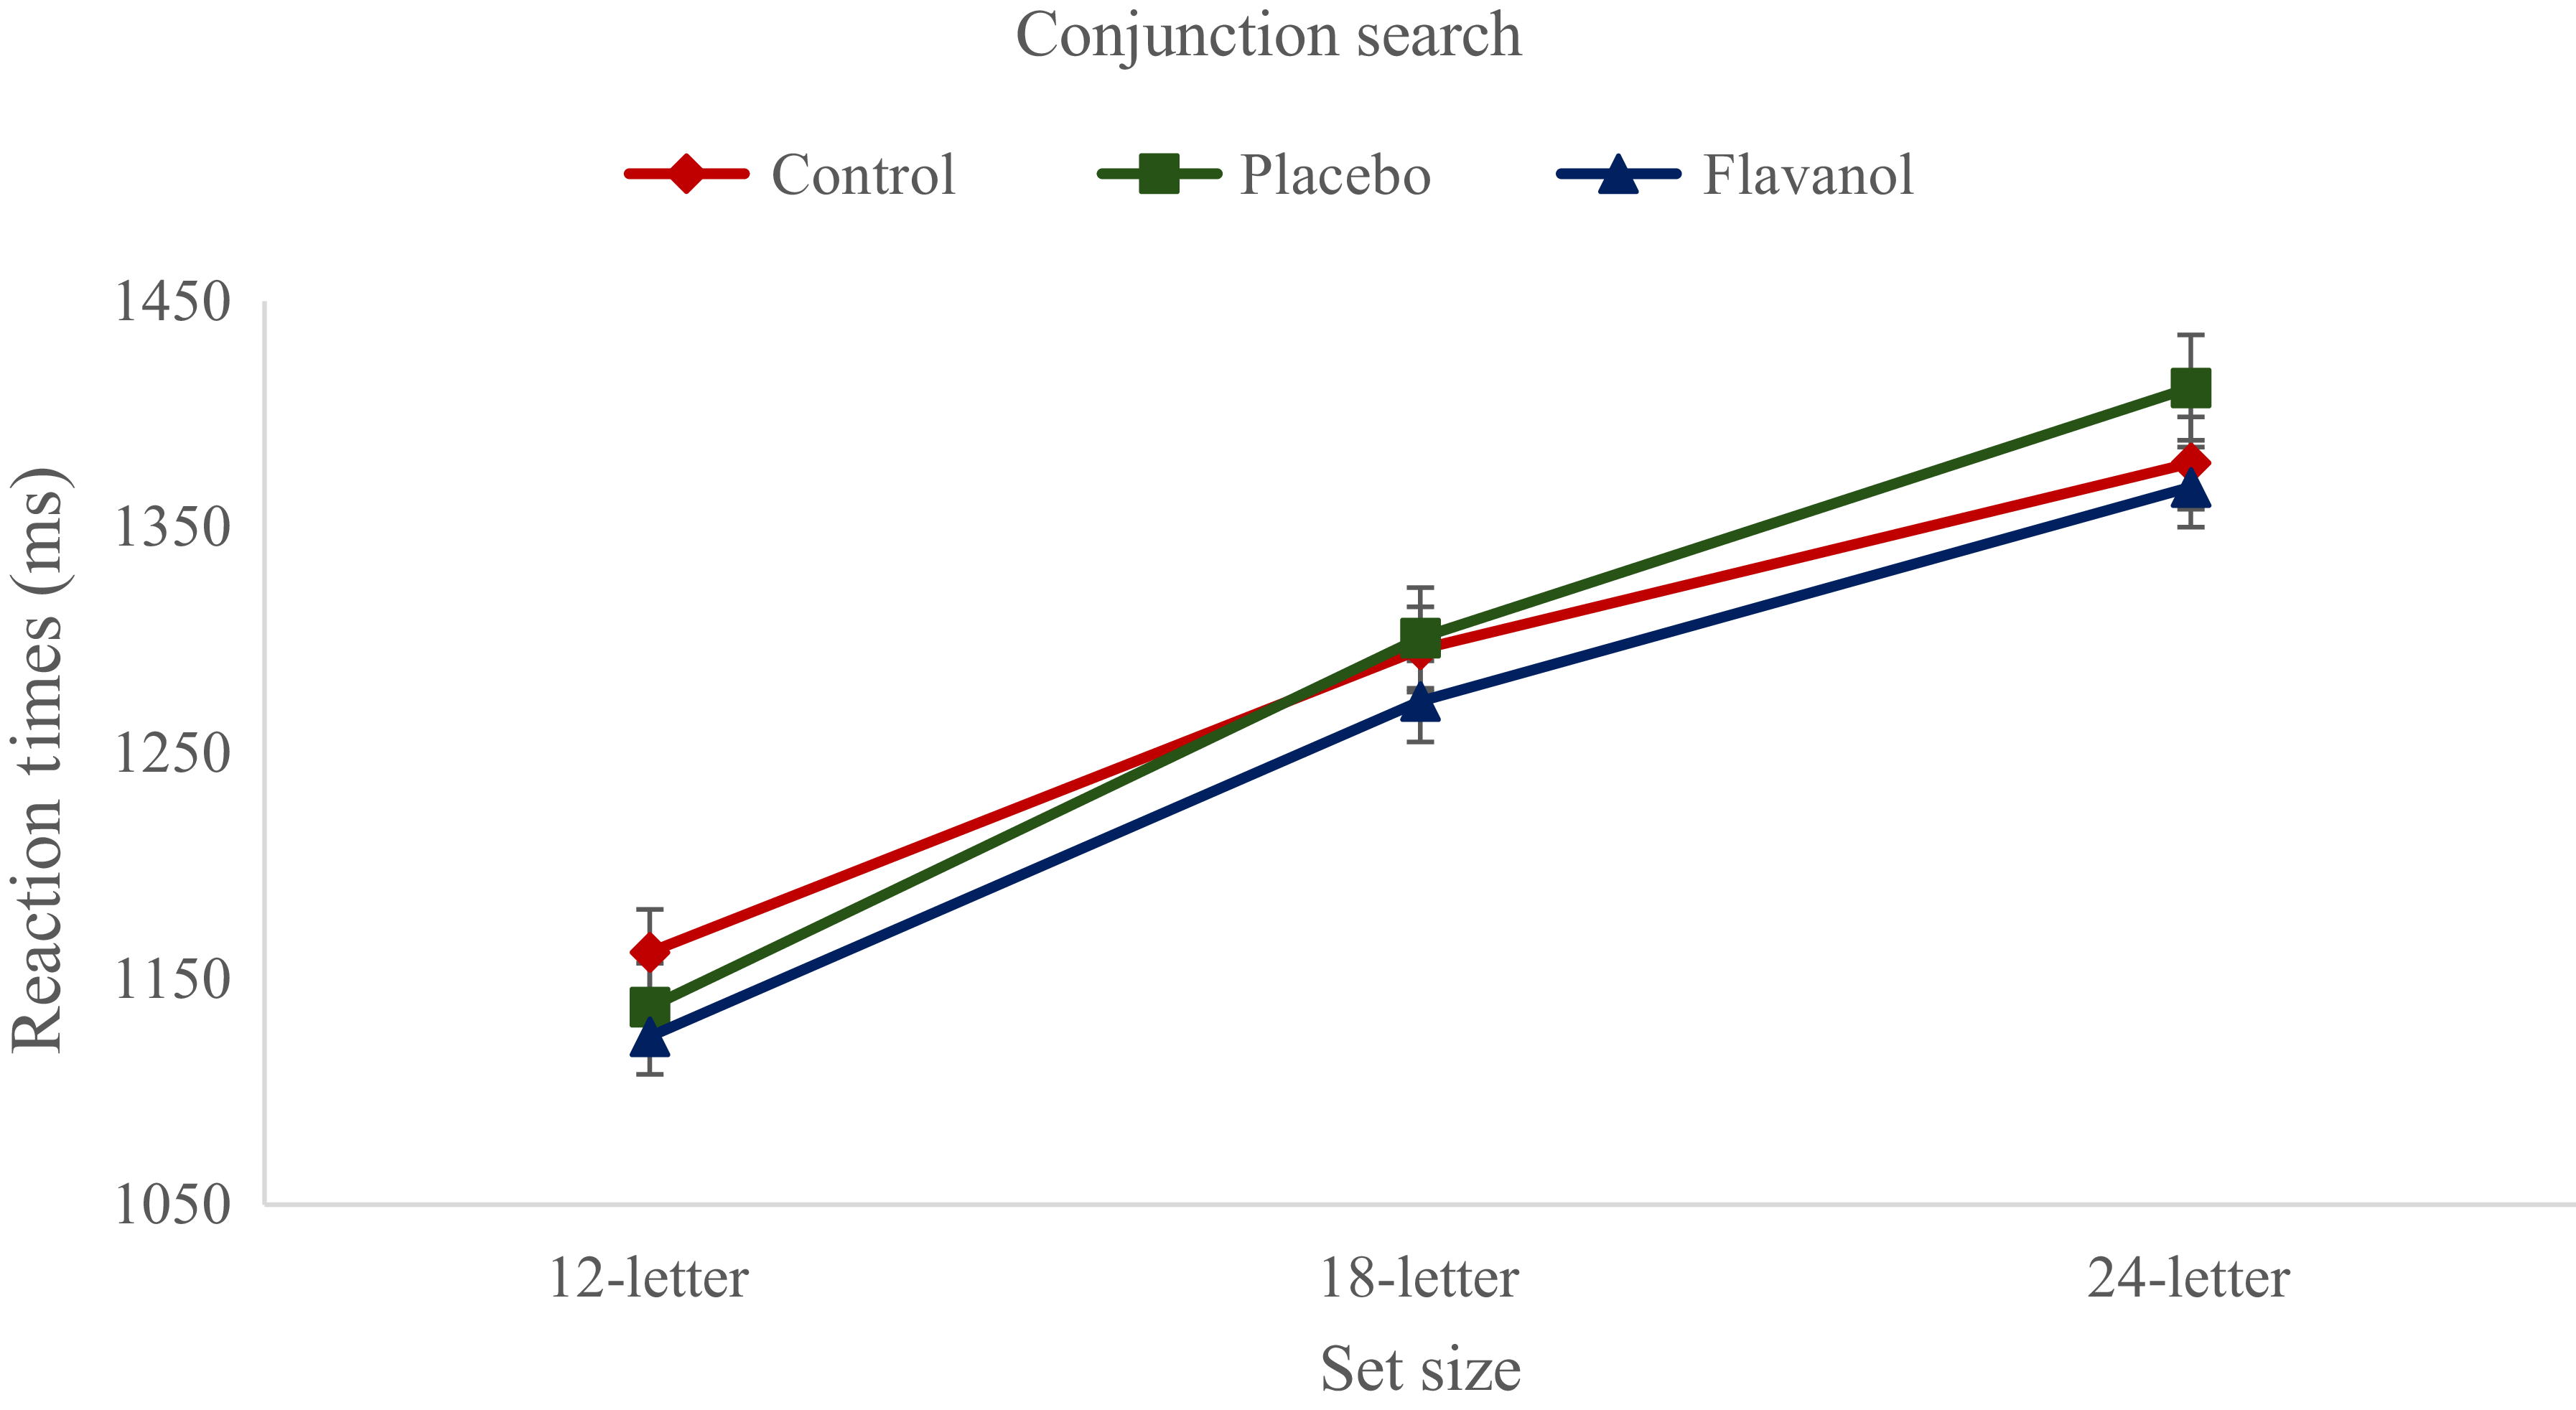
The ANOVA results showed a significant main effect of search type (F 1,47 = 4175·47, p < .001, η p 2 = .99) and set size (F 2,94 =307·19, p < .001, η p 2 = .87) on RT in the VST. Performance was better in feature search (673·01 ± 9·15 sem) than the conjunction search (1276·36 ± 11·53 sem). Post hoc comparisons for the set size revealed that RT was faster in 12-letter trials compared with 18-letter trials (t 93 = 15·30, p < .001) and 24-letter trials (t 93 = 26·27, p < .001). Participants also performed better in 18-letter trials than 24-letter trials (t 93 = 8·99, p < .001).
The two-way interaction effect of search type and set size was also significant (F 2,94 = 233·72, p < .001, η p 2 = .83). In the conjunction search condition, RTs were slower in 24-letter trials than in 12-letter (t 90 = 32·62, p < .001) and 18-letter (t 90 = 12·81, p < .001) trials and slower in 18-letter trials than in 12-letter trials (t 90 = 19·81, p < .001). In the feature search condition, RTs were faster in 12-letter trials than in 24-letter trials (t 90 = 3·17, p < .05), whereas the other set size comparisons were not significant.
Although there was a trend suggesting that participants in the flavanol condition appeared to have better performance, this did not reach statistical significance (Figures 7 and 8). The main effect of experimental product was not statistically significant (F 2,94 = .67, p = .51, η p 2 = .01). Likewise, the interaction effects of experimental product and search type (F 2,94 = 1·84, p = .16, η p 2 = .04), experimental product and set size (F 3.65, 171.57 = 0.93, p = .44, η p 2 = .02), experimental product, search type and set size (F 4,188 = 1·47, p = .21, η p 2 = .03) were also not significant.
Reaction times in the feature search condition of the visual search task. Data points represent means, and error bars indicate the standard error of the mean (sem).

Reaction times in the conjunction search condition of the visual search task. Data points represent means, and error bars indicate the standard error of the mean (sem).

Sensitivity analyses
For SCT accuracy, the overall correlation among repeated measures was r = .74, and the minimum detectable effect size at 95 % power was Cohen’s f = 0·18, indicating greater sensitivity than originally planned (α = .05, 1 – β = .95, r = .50). For SCT reaction time, the corresponding correlation was r = .52, and the minimum detectable effect size was f = 0·23, indicating slightly greater sensitivity than originally planned.
For VST accuracy, the overall correlation among repeated measures was r = .21, and the minimum detectable effect size at 95 % power was Cohen’s f = 0·29, indicating somewhat lower sensitivity than originally planned. For VST reaction time, the corresponding correlation was r = .36, and the minimum detectable effect size was f = 0·27, indicating approximately the planned sensitivity. Thus, relative to the originally targeted effect size f = 0·26, sensitivity was greater for both SCT outcomes, approximately maintained for VST reaction time, and somewhat lower for VST accuracy.
Discussion
In this study, we hypothesised that CF could acutely enhance both overt and covert attention performance. The basis for our hypothesis is primarily the neurovascular coupling mechanism, which involves increased cerebral blood flow to meet the demands for glucose and oxygen due to neuronal activity. Brain imaging studies demonstrated that acute and long-term CF intake increases global cerebral blood flow. The increase in blood flow and neuronal activation following CF ingestion was also observed in brain regions associated with attention(Reference Camfield, Scholey and Pipingas27,Reference Francis, Head and Morris29,Reference Lamport, Pal and Moutsiana38) . In light of these findings, we conducted a randomised, double-blind, placebo-controlled, counterbalanced, crossover trial to test our hypothesis. However, contrary to expectations, our findings did not support the predicted positive effects of acute CF intake on both overt and covert attention.
To the best of our knowledge, the current study is the first to examine the effects of CF on covert attention. As expected, participants showed better performance when the cues were valid. Compared with the neutral cue, participants made more errors and responded slower in the invalid cue condition. These findings support evidence that visual information in the attended location is processed more expeditiously. Nevertheless, CF intake did not improve covert attention. Studies have reported increased cerebral blood flow in the parietal cortex and anterior cingulate cortex following CF intake(Reference Francis, Head and Morris29,Reference Lamport, Pal and Moutsiana38) , regions that are responsible for attentional orienting and executive control. However, our study failed to detect any acute effects of CF on covert attention. Importantly, such neural and haemodynamic changes have not consistently been accompanied by measurable behavioural gains, which may help explain why the present study detected expected cueing effects but no CF-related improvement.
The null results are consistent with a report by Francis et al.(Reference Francis, Head and Morris29), which used a letter-digit pair task requiring the shifting of cognitive resources between different sets of rules. The lack of behavioural effects was attributed to the ceiling effect and the relatively low dose of flavanols (172 mg). Indeed, in a study where a higher dose of flavanols (563 mg) was administered, participants responded faster without making more errors in the colour-word Stroop task, which relies on response inhibition and sustained attention(Reference Tsukamoto, Suga and Ishibashi25). However, the limited sample size in this study should be taken into consideration when interpreting the results. In a study assessing sustained attention, both flavanol supplementation and sleep deprivation were manipulated(Reference Grassi, Socci and Tempesta22). The researchers were unable to provide evidence that consuming chocolate containing 520 mg of flavanols improved performance on the psychomotor vigilance task in both sleep and deprivation conditions. Only in the deprivation condition did female participants show better performance in working memory measured by the 2-back task following flavanol-rich chocolate consumption. However, because methylxanthines have bioactive properties, unmatched methylxanthine levels in the flavanol-rich and flavanol-poor conditions may have confounded the observed effects. In another study, where bioactive substances other than flavanols were not matched, a 773 mg intake of CF improved performance across all cognitive and visual tasks(Reference Field, Williams and Butler21). Again, the possibility that unmatched cocoa components impacted cognitive performance, thereby confounding the effects of CF, cannot be overlooked.
In the current study, overt attention was assessed using a VST that required saccadic eye movements. As expected, accuracy and reaction time were not affected by set size in the feature search task. In contrast, participants made more errors and responded more slowly as set size increased in the conjunction search task. Although the task administered in our study differs from a typical VST, the results appear to be consistent with the previous findings(Reference Duncan and Humphreys47). In a typical VST, participants decide whether the target stimulus is present among a set of distractors. Due to the pop-out effect, set size has no impact on performance in the feature search task, as evidenced by the nearly zero slope between set size and RT. In the conjunction search task, RT increases by approximately 20–30 ms per item on target-present trials and 40–60 ms per item on target-absent trials. In the present study, two major modifications were made to the VST. Because distractor-distractor similarity causes perceptual grouping(Reference Müller-Oehring, Schulte and Rohlfing48), all letters were presented upright or rotated clockwise by 90°, 180° and 270°. In a feature search condition, unique features, such as colour, may allow the target stimulus to be detected without eye movements. For this reason, a task was designed in which responses were based on the orientation of the target stimulus to ensure that overt attention was measured. The task required saccadic eye movements, involving both the detection and identification of the target stimulus. The findings reflect the relationship between RT and set size. The average RT in 12-letter conjunction search was 1140 ms, whereas it was 1385 ms in the 24-letter conjunction search. As reported by Wolfe(Reference Wolfe46), each item increases RT by 20–30 ms, and in the present study, this increase was slightly over 20 ms. In contrast, RT in the feature search was hardly affected by set size, with each distractor increasing RT by 2 ms. These results are consistent with the slope of set size and RT, which is close to zero.
Nevertheless, no evidence was found that CF have any significant impact on overt attention. Although the RT in the conjunction search task was 25 ms faster in the flavanol condition, this difference did not reach statistical significance. In a study where a VST was administered, positive effects of CF intake on spatial attention were observed(Reference Karabay, Saija and Field15). Compared with placebo, participants responded faster in the low CF dose (374 mg), without making more errors. The discrepancy in the results obtained from two studies with the same sample size and research design may be due to differences in the VST administered. While the present study required identifying the target stimulus among distractors presented in different orientations, the study by Karabay et al.(Reference Karabay, Saija and Field15) required participants to detect whether the target was present or absent. Notably, in that study, the positive effects of CF were observed particularly in the target-absent trials. The effect of CF may be more evident in the target-absent trials because confirming the absence of a target is likely to be more cognitively demanding than confirming its presence. This difference in task demands may partially explain why acute CF effects were not observed in the present study.
One of the possible reasons for the null results is the testing of young college students with intact cognitive functioning. This may be because age and pathology are considered crucial variables in the mechanism of action of flavanols(Reference Nehlig36). Only limited research has explored the acute effects of CF on older adults. Therefore, there is insufficient data to make comparison across the age spectrum. Studies examining the long-term effects of CF consumption included participants from different age groups and clinical samples that allow for such comparisons. There is a trend suggesting that elderly individuals benefit more from flavanol consumption(Reference Karataş, Karabay and Alıcı51). The positive effects of 821 mg of flavanol intake on blood flow and blood pressure were more pronounced in healthy older adults with an average age of sixty-one compared with young adults(Reference Fisher and Hollenberg12). Additionally, it has been demonstrated that CF increase brain-derived neurotrophic factor levels in blood serum and general cognitive performance; there is a negative relationship between serum brain-derived neurotrophic factor and age and a positive relationship between serum brain-derived neurotrophic factor and cognitive functions(Reference Neshatdoust, Saunders and Castle31). Taken together, ageing and ageing-related diseases (e.g. CVD) are important determinants of flavanols’ role in supporting cognitive functions.
The lack of positive effects may also be attributed to the duration of flavanol administration. Given the physiological actions of flavanols, it is believed that CF have both immediate and long-lasting effects on cognitive functions. The acute effects are thought to be short-lived and immediate through nitric oxide synthesis in endothelial cells. In long-term consumption, structural and functional changes occurring in the nervous system lead to lasting effects(Reference Sokolov, Pavlova and Klosterhalfen10,Reference Martín, Goya and de Pascual-Teresa52) . In this context, a single dose of CF may not be sufficient to consistently enhance visual spatial attention performance. Studies examining the long-term intake of CF have generally observed positive effects in those where the administration duration is at least 8 weeks(Reference Karataş, Karabay and Alıcı51).
We determined the optimal flavanol dose (710 mg) based on findings from a study examining the dose–response relationship between CF supplementation and flow-mediated dilation(Reference Sun, Zimmermann and De Castro40). In another meta-analysis examining the relationship between CF dose and cognitive functions, it was demonstrated that positive effects generally occur at intakes of 500–750 mg(Reference Barrera-Reyes, de Lara and Gonzalez-Soto53). Therefore, we can be reasonably confident that the lack of positive effects observed in our study is not related to the administered flavanol dose.
Before drawing any definitive conclusions from the results, it is important to acknowledge the limitations of our study. Cocoa contains bioactive compounds that are known to potentially influence cognitive functions. It was reported that caffeine and theobromine concentrations in cocoa are considered too low to exert any effect on neurocognition and behaviour(Reference Socci, Tempesta and Desideri9). Because the amounts of caffeine and theobromine were identical in both the flavanol and placebo conditions, the observed effects can be attributed to the flavanols. However, it cannot be ruled out that flavanols may interact with these substances and cause synergistic or antagonistic effects. Potential substance interactions can be mitigated by administering flavanol supplements instead of cocoa or chocolate.
A further limitation is the lack of a pre-dose assessment at each session, which prevented direct estimation of within-session change following beverage consumption. The rationale for using a post-test design was to avoid doubling the number of cognitive assessments within each session, thereby reducing participant burden and the potential for additional practice and fatigue effects, as well as time-of-day effects on attention performance and circadian processes such as cortisol secretion(Reference Petersen and Posner54). This represented a methodological trade-off, reducing potential confounding associated with repeated testing within the same day at the cost of not directly measuring pre-dose performance at each session. The findings should therefore be interpreted as post-dose differences between conditions rather than as pre–post changes within a session. Keeping the testing day and time consistent for each participant was intended to control time-of-day and day-of-week effects, while the randomised, counterbalanced crossover design was expected to distribute unsystematic day-to-day variation across conditions and thereby minimise systematic bias. However, residual within-person variability across sessions may still have increased error variance and reduced sensitivity to small effects. Accordingly, the observed correlations among repeated measures were incorporated into sensitivity analyses for each task and outcome. The analyses indicated greater than planned sensitivity for both SCT outcomes, approximately the planned sensitivity for VST reaction time and somewhat lower sensitivity for VST accuracy. Although day-to-day variability may have influenced the findings, the study retained approximately or greater than planned sensitivity for three outcomes. Because the study was designed primarily to detect effects around the medium range, the possibility of smaller acute effects of CF cannot be excluded.
Future research may benefit from investigating the effects of CF in different age groups and cognitively impaired populations. A useful example is provided by two otherwise identical studies in which only the samples differed. In the so-called Cocoa, Cognition, and Aging (CoCoA) studies, the subchronic effects of CF were investigated in individuals with mild cognitive impairment(Reference Desideri, Kwik-Uribe and Grassi16) and healthy older adults(Reference Mastroiacovo, Kwik-Uribe and Grassi17). In both samples, 8 weeks of CF intake improved mental flexibility, attention, and working memory, particularly via increased insulin sensitivity. However, compared with healthy older adults, the contribution of altered insulin sensitivity to cognitive functioning was found to be twice as high in participants with mild cognitive impairment. Given that cognitive processes often decline with age, the present study could usefully be replicated in older participants with either intact or impaired attentional functioning. Such research could provide valuable insights into the potential role of CF in mitigating age-related cognitive decline.
Conclusion
To our knowledge, this is the first study to examine the acute effects of CF consumption on both overt and covert attention in healthy young adults. No significant effects of CF were observed on accuracy or reaction time in either task. Nevertheless, the expected visual search and cueing effects were replicated, suggesting that the tasks were sensitive to attentional manipulations, despite the absence of acute CF-related behavioural gains. These findings suggest that a single acute dose of CF may not be sufficient to enhance visual spatial attention performance in healthy young adults.
Data availability statement
The data supporting the findings of this study will be made available after publication on ClinicalTrials.gov under the identifier NCT06812689. The data are also available from the corresponding author upon reasonable request.
Acknowledgements
We thank our undergraduate research assistants, Rumeysa Kırılmaz and Emine Kocael, for their contributions to the project. We also appreciate all the students who participated in the study. Additionally, we are grateful to Dr. Merve Yılmaz Karataş for her valuable suggestions on the original draft. This article is based on research conducted for the first author’s PhD thesis.
Author contributions
OK: Conceptualisation; Data curation; Formal analysis; Funding acquisition; Investigation; Methodology; Project administration; Resources; Software; Visualisation; Writing – original draft; Writing – review & editing. TA: Supervision; Writing – review & editing.
Financial support
This study was funded by the Scientific and Technological Research Council of Türkiye (TÜBİTAK) under Grant No. 122K636. Barry Callebaut provided the cocoa powders used in the study at no cost. Neither organisation had any role in the study design, data collection, data analysis, interpretation of the findings, preparation of the manuscript nor the decision to submit the article for publication.
Competing interests
The authors declare no conflict of interest.



 Open access

