Introduction
Monitoring and minimization of human impacts in Antarctica is needed to ensure environmental stewardship and meet international obligations. McMurdo Station is the largest scientific/logistics station in Antarctica, with a summer population often in excess of 1000. Human activities in the area have contaminated and disturbed adjacent marine habitats (Lenihan et al. Reference Lenihan, Oliver, Oakden and Stephenson1990, Risebrough et al. Reference Risebrough, Delappe and Younghanshaug1990, Kennicutt et al. Reference Kennicutt, Mcdonald, Sericano, Boothe, Oliver, Safe, Presley, Liu, Wolfe, Wade, Crockett and Bockus1995, Lenihan & Oliver Reference Lenihan and Oliver1995, Conlan et al. Reference Conlan, Kim, Lenihan and Oliver2004, Negri et al. Reference Negri, Burns, Boyle, Brinkman and Webster2006). Disturbances of these habitats are caused by contaminants from prior waste disposal practices (petroleum hydrocarbons, chlorinated hydrocarbons, and metals) (Lenihan et al. Reference Lenihan, Oliver, Oakden and Stephenson1990, Risebrough et al. Reference Risebrough, Delappe and Younghanshaug1990, Kennicutt et al. Reference Kennicutt, Mcdonald, Sericano, Boothe, Oliver, Safe, Presley, Liu, Wolfe, Wade, Crockett and Bockus1995, Negri et al. Reference Negri, Burns, Boyle, Brinkman and Webster2006) and organic enrichment from sewage disposal (McFeters et al. Reference McFeters, Barry and Howington1993, Crockett Reference Crockett1997, Crockett & White Reference Crockett and White2003, Conlan et al. Reference Conlan, Kim, Lenihan and Oliver2004). Monitoring these areas of known disturbance is necessary to quantify, mitigate, and minimize anthropogenic impacts and to inform management decisions about future station operations. Variability in the biological, chemical, and physical attributes of natural systems is a combination of natural and human induced change. In Antarctica, at continent-wide scales, variability is largely attributable to natural processes with the notable exceptions of ozone depletion, climate change (global warming), and long-range transport of persistent organic pollutants (POPs) that have at least a partial anthropogenic origin (Risebrough et al. Reference Risebrough, Delappe and Younghanshaug1990, Kennicutt et al. Reference Kennicutt, Mcdonald, Sericano, Boothe, Oliver, Safe, Presley, Liu, Wolfe, Wade, Crockett and Bockus1995). On a regional or local scale, human activities can be more important than natural variability in creating disturbed regions or zones. Examples include contaminated areas at McMurdo Station (Winter Quarters Bay), an old garbage tip at Casey Station (Stark Reference Stark2000), and a contaminated area from the 1989 petroleum spill at Palmer Station (Kennicutt et al. Reference Kennicutt, Mcdonald, Sericano, Boothe, Oliver, Safe, Presley, Liu, Wolfe, Wade, Crockett and Bockus1995). Spatial variability due to natural processes serves as a backdrop upon which human induced change is expressed. To recognize perturbations caused by humans, natural spatial variability must be understood and recognized when designing monitoring programmes. Marine ecosystem structure and function in Antarctica is highly variable as a result of the extreme conditions and variability of the physical environment (temperature, light conditions - including UV radiation, weather, climate, ice conditions, physical disturbance due to ice scouring, etc). This natural variability makes direct inferences about the effect of humans on natural systems difficult to discern and manage. In localized areas at McMurdo Station, however, the environment has clearly been altered by the humans in the area (Lenihan et al. Reference Lenihan, Oliver, Oakden and Stephenson1990, Risebrough et al. Reference Risebrough, Delappe and Younghanshaug1990, McFeters et al. Reference McFeters, Barry and Howington1993, Lenihan & Oliver Reference Lenihan and Oliver1995, Kennicutt et al. 1995, Crockett Reference Crockett1997, Conlan et al. Reference Conlan, Kim, Lenihan and Oliver2004, Negri et al. Reference Negri, Burns, Boyle, Brinkman and Webster2006).
The goal of this project was to develop a sampling design for Winter Quarters Bay (WQB) and the nearshore region adjacent to McMurdo Station to monitor human perturbations over the long-term. The long-term monitoring programme will be used to help manage these perturbations, which seeks to maintain or reduce environmental impact to acceptable levels. Spatial disturbance patterns occur at two scales. Regional scale sampling was tested with a probabilistic design at 50 m intervals. Local scale sampling was tested with the fixed-point design at sites of historic contamination or physical disturbance. Regional scale sampling defines the background and spatial extent of the impacted area in and around McMurdo Station. The sediment quality triad (SQT) approach was used to measure ecological integrity (Green & Montagna Reference Green and Montagna1996) with chemical contaminants to indicate the presence of toxic chemicals, sediment toxicity to indicate the potential for biological effects, and a benthic index of biotic integrity (B-IBI) to indicate altered in situ ecological patterns. The purpose was to compare the efficiency of the fixed-point and probabilistic sampling designs by quantifying the extent and intensity of human induced disturbance along known disturbance gradients.
Methods
Sampling designs
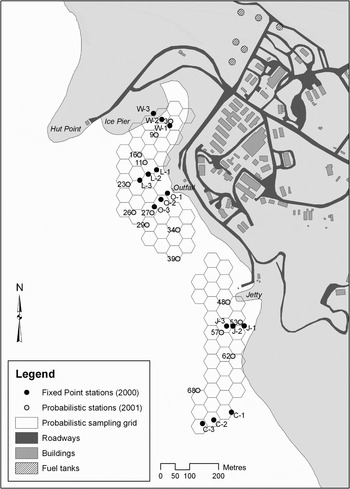
The study area was located in Winter Quarters Bay (WQB) and the nearshore region adjacent to McMurdo Station (Fig. 1). Samples were taken from mid-November to mid-December in 2000, 2001, 2003 and 2004 during periods of maximum annual human occupation in McMurdo Station. In 2000, a fixed-point transect design was aligned along known contaminant gradients in McMurdo Sound. Transects were located along gradients of chemical contamination (WQB and the former landfill), organic enrichment (sewage outfall), and physical disturbance (desalinization water intake jetty). A reference transect was located at Cape Armitage, c. 1 km south-east of Hut Point and WQB. The reference transect is an area of undisturbed ecological conditions (Lenihan et al. Reference Lenihan, Oliver, Oakden and Stephenson1990, Conlan et al. Reference Conlan, Kim, Lenihan and Oliver2004, Negri et al. Reference Negri, Burns, Boyle, Brinkman and Webster2006). The desalinization water intake jetty (hereon noted as the jetty) was chosen as a transect because this site has undergone light to moderate physical disturbance from the construction and maintenance of the jetty. In addition, the jetty represents a transition zone between the reference location at Cape Armitage and the transects disturbed by chemical contamination and organic enrichment. Three stations along the five transects were located at 12 m (shallow), 24 m (intermediate), and 34 m (deep) water depths. Station water depth was determined by dropping a weighted line through an ice hole. Once the correct depth was located, it was marked with a flag and the location was recorded with a hand held Global Positioning System. Station depths were chosen based on a combination of spatial orientation to natural ice disturbance zones, the outfall location, and SCUBA diving limitations. Shallow stations (12 m) fall within the range of depths (0–15 m) seasonally affected by intense ice scour and anchor ice formation (Dayton et al. Reference Dayton, Robilliard, Paine and Dayton1974). Intermediate stations (24 m) are within a zone of lesser ice scour and anchor ice formation (16–30 m) (Dayton et al. Reference Dayton, Robilliard, Paine and Dayton1974). A water depth of 24 m was also chosen for intermediate stations because of the presence of bathymetric and anthropogenic structures. A submarine valley at 24 m within WQB tends to accumulate contaminants (Lenihan et al. Reference Lenihan, Oliver, Oakden and Stephenson1990), and the wastewater outfall pipe/quay is located near the intermediate outfall station. Deep stations (34 m) experience little or no disturbance from ice, and are typically characterized by sponge spicule communities and high benthic species diversity (Dayton et al. Reference Dayton, Robilliard, Paine and Dayton1974, Dayton Reference Dayton1989). The depth of the deep stations is also the practical limit of diver operations.
Sampling locations for fixed point and probabilistic design. Stations for fixed-point design are indicated by transect and depth abbreviation. Stations for probabilistic design are indicated by hexagonal number. Abbreviations: W = WQB, L = landfill, O = outfall, J = jetty, C = Cape Armitage, 1 = shallow depth, 2 = intermediate depth, 3 = deep depth.

During 2001, a probabilistic sampling design was used to place sample locations (Fig. 1). The probabilistic design assumes random distribution of contaminant variables within the study area. The locations of structures such as the ice pier, ice runway, outfall quay hut, and desalinization hut were excluded from the sampling zone. The zone did not extend to water depths greater than 34 m. Station locations were randomly selected within the defined zone using a random number generator. A total of fifteen stations were sampled.
A fixed-point design was employed to test temporal change in 2003 and 2004 for macroinfauna at a limited number of stations. The design included stations at the WQB, outfall, and Cape Armitage transect.
Sediment samples
Sediments were collected by SCUBA with hand driven sediment cores. A 6.7 cm diameter core was chosen because it was a manageable size for divers, and it obtains a representative sample of small infaunal organisms. Sample size was also determined by processing time and cost because the purpose of the study was to develop an environmental monitoring programme. Triplicate samples were taken at each station for chemical contaminants, toxicity, and macroinfauna. A power analysis was performed to calculate the power to detect change with three replicates among 15 stations that were sampled in the first year (2000) and the following powers were found: abundance 0.999, biomass 0.907, and diversity 0.999, which are all greater than the convention of 0.8. Taking three samples per station also fits constraints for diver bottom time. Contaminants analysed were polycyclic aromatic hydrocarbons and chlorinated hydrocarbons (PCBs, pesticides), total carbon (TC), total organic carbon (TOC), total inorganic carbon (TIC), trace metals, and toxicity.
Samples for organic contaminants, TOC/TIC and trace metals were placed in U.S. Environmental Protection Agency (EPA) certified, pre-cleaned 4-oz glass jars with Teflon lid liners and returned to the Texas A&M University Geochemical and Environmental Research Group laboratory for analysis. Prior to analysis, samples were stored at -20°C. A Dionex accelerated solvent extractor (ASE 200) using extraction cells having 33 mL capacity and methylene chloride was used to extract sediment samples for organic analyses. Approximately 20 g wet sediment was mixed with sodium sulphate (a drying agent) and clean sand. Sediment extraction temperature was 100°C for 5 min, at a pressure of 1500 PSI, with a flush volume of 90% for two cycles. The extract was purified using alumina/silica column and the solvent exchanged to hexane. Surrogates were added to each of the samples prior to extraction. Extracts were analysed by high resolution, fused silica, capillary column gas chromatography with flame ionization (GC/FID), electron capture (GC/ECD), and mass spectrometric (GC/MS) detection. The analytical procedures have been described in detail elsewhere and provide accurate, precise, and reproducible results (Kennicutt et al. Reference Kennicutt, Sericano, Wade, Alcazar and Brooks1987, Reference Kennicutt, Sweet, Fraser, Stockton and Culver1991, Wade et al. Reference Wade, Atlas, Brooks, Kennicutt, Fox, Sericano, Garciaromero and Defreitas1988, Short et al. Reference Short, Jackson, Larsen and Wade1996). The methodology is the same as that used by the National Oceanic Atmospheric and Administration National Status and Trends Program. Carbon concentrations (TC, TOC, and TIC) were determined on dried sediment using a LECO Model 523–300 induction furnace with a Horiba PIR-2000 infrared (IR) detector, and quantified using an integrator (Sweet & Wade Reference Sweet, Wade, Lauenstein and Cantillo1998). TC was determined on an un-acidified dry sample, while TOC was determined after sample acidification. TIC is calculated as the difference between TC and TOC. Sediments were digested for trace metals using EPA Method 1620 that is based on a total recoverable procedure, in which extracted metals are removed by nitric acid treatment (USEPA 1989). Analyses for various metals were made by using either graphite furnace atomic absorption spectrophotometry or inductively-coupled plasma emission spectroscopy (USEPA 1989). Sediments for mercury (Hg) analysis were digested using a separate procedure and analysed by cold vapour atomic absorption spectroscopy (USEPA 1991).
The surface layer of sediment was sampled for bacterial toxicity analysis and refrigerated until analysis. Sediment toxicity was determined with the Microtox® method which uses the bioluminescent bacterium, Vibrio fischeri NRRL B-11177, to assess the toxicity of samples. Reductions in bioluminescent activity indicate corresponding increases in toxicity. The bioluminescence of V. fischeri is sensitive to most toxins; such as pesticides, phenolic compounds, and metals (Ramaiah & Chandramohan Reference Ramaiah and Chandramohan1993). The Microtox® method yields results comparable to standard amphipod and urchin toxicity tests for water and sediment samples (DeZwart & Slooff Reference Dezwart and Slooff1983, Schiewe et al. Reference Schiewe, Hawk, Actor and Krahn1985). Sediment samples were analysed with the Microtox® basic solid phase test procedure. This procedure tests solid sediment samples by using nine serial dilutions of the sample, with 99 000 mg L-1 being the highest concentration. Dilutions allow the bacteria to come in direct contact with the sample because it is within an aqueous suspension, allowing toxicity to be detected in insoluble solids. Natural background toxicity and natural sediment turbidity is accounted for be testing references samples at the Cape Armitage transect. Sediment results are reported as effect concentration 50 (EC50) values, the concentration of sediment required to elicit a 50% decrease of bioluminescence relative to a control sample. Therefore, low EC50 values denote toxic effects. EC50 values were calculated with Microtox® data reduction software.
Macroinfaunal sediment samples were preserved in equal volumes of 10% buffered formalin (final concentration was 5% formalin) and stained with Rose Bengal to aid in sorting. In the laboratory, sediments were washed and organisms were retained on a 0.5 mm sieve. After sieving, organisms were counted and identified to the lowest possible taxonomic level. In most cases, organisms were identified to species level. Organisms were weighed to the nearest 0.01 mg for wet weight biomass. Before weighing, organisms were separated into higher taxon categories (i.e. Polychaeta, Crustacea, Mollusca, and others). Specimens within designated categories were placed on Kimwipes® to remove excess water and transferred to a pre-weighed aluminum pan. Megafauna, (e.g. Laternula elliptica King & Broderip, 1831, Limatula hodgsoni Smith, 1907, seastars and large anemones) were excluded from biomass measurements because their weights skewed results relative to infauna.
Grain size was measured at each site in this study, but it did not vary among the samples and did not contribute to any community change, so it is not reported here.
Benthic Index of Biotic Integrity (B-IBI)
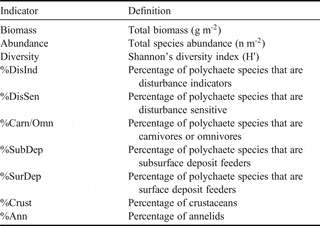
A Benthic Index of Biotic Integrity (B-IBI) combines ecological measurements into a single value that creates a univariate index from multivariate data. Ten biotic metrics were used to calculate a B-IBI (Table I). High values of biomass, abundance, diversity (H′), percentage of disturbance sensitive polychaetes (%DisSen), percentage of carnivore or omnivore polychaetes (%Carn/Omn), percentage of sub-surface deposit feeding polychaetes (%SubDep), and percentage of crustaceans (%Crust) indicate high environmental quality (McCall Reference McCall1977, Pearson & Rosenberg Reference Pearson and Rosenberg1978, Rhoads et al. Reference Rhoads, Mccall and Yingst1978, Weisberg et al. Reference Weisberg, Ranasinghe, Schaffner, Diaz, Dauer and Frithsen1997, Carr et al. Reference Carr, Montagna, Biedenbach, Kalke, Kennicutt, Hooten and Cripe2000). Low values of percentage of disturbance indicator polychaetes (%DisInd), percentage of surface deposit feeding polychaetes (%SurDep), and percentage of annelids (%Ann) also indicates high environmental quality.
Benthic community indicator names and their definitions for the B-IBI.

A modification of the B-IBI from Weisberg et al. (Reference Weisberg, Ranasinghe, Schaffner, Diaz, Dauer and Frithsen1997) was made to include %Ann and %Crust as metrics. Changes in community structure at the phylum level have been demonstrated to occur in response to anthropogenic disturbances (Warwick Reference Warwick1986, Peterson et al. Reference Peterson, Kennicutt, Green, Montagna, Harper, Powell and Roscigno1996). The annelid and crustacean phyla were chosen to depict this change in community structure because combined, annelids and crustaceans represent 81% of the total biomass and 90% of the total abundance from the fixed-point design and 42% of the total biomass and 78% of the total abundance from the probabilistic design. High percentages of annelids indicate poor environmental quality because they are less sensitive to contaminants than any other major macrobenthic phylum (Warwick & Clarke Reference Warwick and Clarke1993). High percentages of crustaceans, on the other hand, indicate good environmental quality because they are sensitive to contaminants and are often used in toxicity tests (Burton Reference Burton1992). Field experiments at McMurdo Station also reported that annelid abundance increased with organic enrichment and toxic contamination, while arthropod abundance decreased (Lenihan et al. Reference Lenihan, Peterson, Kim, Conlan, Fairey, Mcdonald, Grabowski and Oliver2003).
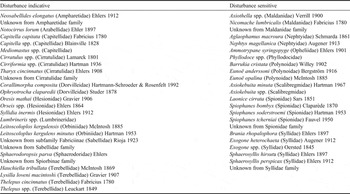
Polychaete species were classified as disturbance indicative or disturbance sensitive based on life history traits, characteristics, and family level (Table II). When little information was available for species level, family level life history traits were used to indicate sensitivity to disturbance. Anthropogenic impacts have different effects on community composition than do natural environmental impacts. Anthropogenic impacts tend to modify community composition at higher taxonomic levels, such as the phyla level, while natural environmental impacts tend to modify community composition at the species level (Warwick Reference Warwick1986). Therefore, classification based on family level would give a measure of sensitivity to anthropogenic disturbance. Species were classified as disturbance indicators if they have opportunistic life history traits such as rapid development, polytelic reproduction, high recruitment, high death rate, few eggs per female, brood protection, and lecthiotrophic larvae (McCall Reference McCall1977). Species were classified as disturbance sensitive if they have equilibrium life history traits such as large size, slow development, monotelic reproduction, low recruitment, low death rates, and planktonic larvae (McCall Reference McCall1977). Although it has been theorized that there is a decrease in pelagic larval stages from the equator to the poles (Mileikovsky Reference Mileikovsky1971), Bhaud et al. (Reference Bhaud, Koubbi, Razouls, Tachon and Accornero1999) review evidence of planktonic larval stages in polar benthos, and we therefore conclude that larval stages are still a useful indicator of life history traits for polar benthos.
Polychaete species (Genus species, Family, Authorship) occurring in McMurdo Sound classified as disturbance indicative or sensitive.

Syllidia inermis, Oresis mathai, Ophryotrocha claparedii, and Corallimorpha composita were classified as disturbance indicators because Hesionidae and Dorvilleidae families typically use brood protection (Wilson Reference Wilson1991) and have previously been found in disturbed areas of McMurdo Sound (Lenihan & Oliver Reference Lenihan and Oliver1995, Conlan et al. Reference Conlan, Kim, Lenihan and Oliver2004). Tharyx spp. and Leitoscolopus kerguelensis were found to be intermediately opportunistic (Lenihan & Oliver Reference Lenihan and Oliver1995, Conlan et al. Reference Conlan, Kim, Lenihan and Oliver2004) and therefore were classified as disturbance indicators. The genera Capitella and Mediomastus have long been known for their opportunistic life history traits (Grassle & Grassle Reference Grassle and Grassle1974) and were classified as disturbance indicators. Lumbrineris macquariensis has brood reproduction (Wilson Reference Wilson1991) and is found in disturbed environments (Pearson & Rosenberg Reference Pearson and Rosenberg1978). Cirratulus spp. and Cirriformia spp. typically use brood protection and are polytelic (Olive & Clark Reference Olive, Clark and Mill1978, Peterson Reference Peterson1999). Species from the subfamily Fabriciinae exhibit broodcare and produce lecthiotrophic larvae by direct development (Rouse & Fitzhugh Reference Rouse and Fitzhugh1994). Sphaerorodorpsis parva are typically small and produce few non-pelagic lecthiotrophic larvae by direct development (Christie Reference Christie1984). Species in the family Ampharetidae including Neosabellides elongatus Ehlers 1912 are polytelic (Olive & Clark Reference Olive, Clark and Mill1978). Terbellids such as Hauchiella tribullata, Lysilla loveni macintoshi, and Thelpus spp. undergo rapid growth and a shortened life span in summer months (Seitz & Schaffner Reference Seitz and Schaffner1995). Species from the Spiorbinae family use brood protection and are lecthioptrophic (Wilson Reference Wilson1991).
Polychaetes with free spawning and planktonic larvae such as Ammotrypane syringopyge, Laonice cirrata, Phyllodoce spp., neptyids, polynoids, spionids, and syllids were deemed disturbance sensitive (Day Reference Day1967, Wilson Reference Wilson1991). Spiophanes bombyx also has planktonic larvae (Wilson Reference Wilson1991) and has been found to be disturbance sensitive in other studies (Weisberg et al. Reference Weisberg, Ranasinghe, Schaffner, Diaz, Dauer and Frithsen1997, Carr et al. Reference Carr, Montagna, Biedenbach, Kalke, Kennicutt, Hooten and Cripe2000). Spiophanes tcherniai was found in uncontaminated and less contaminated sediments at McMurdo Station (Lenihan et al. Reference Lenihan, Peterson, Kim, Conlan, Fairey, Mcdonald, Grabowski and Oliver2003, Conlan et al. Reference Conlan, Kim, Lenihan and Oliver2004). Maldanids, such as Axiothella spp. and Nicomache lumbricalis, were classified as disturbance sensitive because of their longevity and deep dwelling feeding traits (Dauer Reference Dauer1993). Axiothella antarctica also showed a decrease in abundance at McMurdo Station from reference sites to contaminated sites in a study by Conlan et al. (Reference Conlan, Kim, Lenihan and Oliver2004). Axiokebuita spp. was classified as disturbance sensitive because of their deep dwelling feeding habits, and sedentary nature.
Polychaete feeding types were classified based on description of feeding behavior (Fauchald & Jumars Reference Fauchald and Jumars1979). Polychaetes that are surface deposit feeders were given lower metric scores because this feeding behaviour is typical of opportunistic species in disturbed sediments (McCall Reference McCall1977). In contrast, equilibrium species usually exhibit suspension or deep deposit feeding (McCall Reference McCall1977). Carnivore and omnivore feeding behaviours were found to be indicative of high quality sediments (Weisberg et al. Reference Weisberg, Ranasinghe, Schaffner, Diaz, Dauer and Frithsen1997, Carr et al. Reference Carr, Montagna, Biedenbach, Kalke, Kennicutt, Hooten and Cripe2000).
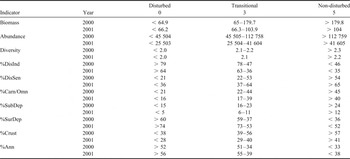
Station B-IBI rank was calculated by averaging the ranked values for each indicator. Assignment of rank to each indicator followed the same convention as devised by Llansó et al. (2003) and was dependent on established criteria (Table III). These indicator ranks were calculated with 90% confidence intervals according to the following equation:
Criteria used to assign indicator ranks for the McMurdo Station B-IBI. Definitions for indicators are described in Table I.


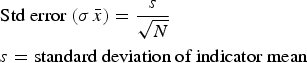
Low confidence interval values of biomass, abundance, H′, %DisSen, %Carn/Omn, %SubDep, and %Crust indicators received a rank of 0, which indicates a disturbed habitat. High confidence interval values of biomass, abundance, H′, %DisSen, %Carn/Omn, %SubDep, and %Crust indicators received a rank of 5, which indicates an undisturbed habitat. High confidence interval values of %DisInd, %SurDep, and %Ann indicators received a rank of 0, which indicates a disturbed habitat. Low confidence interval values of %DisInd, %SurDep, and %Ann indicators received a rank of 5, which indicates an undisturbed habitat. Interval values in between the low and high 90% confidence interval received a transitional rank of 3. Using biomass values from 2000 as an example:
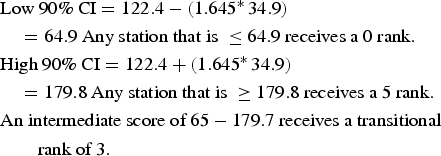
Station B-IBI ranks were defined by the same criteria. The 90% confidence interval of average station ranks was used to determine the state of disturbance.
Data analysis
Analysis of variance (ANOVA) was used to test for differences in response variables among stations or other strata in the design. This SQT study (i.e. sampling sediments for benthos, contaminants, and toxicity) produces a large multivariate dataset. The dataset has rows of observations (i.e. sample replicates at locations during specific periods) and columns of responses (i.e. contaminant concentrations, sediment characteristics, benthic community characteristics and toxic responses), thus multivariate statistical analyses, e.g. principal components analysis (PCA) was used to characterize environments and test hypotheses related to the distribution of patterns in space. Multivariate analysis is used in two different ways. The traditional approach is to characterize environmental patterns by grouping stations in a plot with the first and second principal components. However, PCA can also be used to create new independent variables that describe environmental quality so it can be related to biological or ecological responses, which has been used in other sediment quality triad studies (Carr et al. Reference Carr, Chapman, Presley, Biedenbach, Robertson, Boothe, Kilada, Wade and Montagna1996, Green & Montagna Reference Green and Montagna1996). The sampling locations chosen for study are surrogates for anticipated differences due to changes in contaminant and/or disturbance levels. Change is reflected in the values of the abiotic variables. A PCA of all the abiotic variables can be used to reduce this large number of variables to two new variables, which are uncorrelated and contain most of the variance in the dataset. These new variables are then used as independent variables to predict and explain biological responses (see method and programme in Long et al. Reference Long, Carr, Montagna, Carr and Nipper2003).
Statistical Analysis System (SAS Institute 1999) and Primer® (Clarke & Warwick Reference Clarke and Warwick2001) computer programs were used for data analyses. Macroinfaunal community characteristics included biomass and statistical terms of abundance, species richness, and species diversity. All replicate samples for stations were pooled prior to analysis of species richness and diversity, because this is a reliable way to homogenize variability among samples and more accurately assess differences between stations.
Chemical contaminant data for sediments were analysed using PCA and multi-dimensional scaling (MDS). PCA analysis included chemical contaminants that were above the effects range low or effects range high criteria, and any chemical contaminants that had PC coordinates not represented by other chemicals (Long et al. Reference Long, Macdonald, Smith and Calder1995). Unlike PCA, which presents outputs by two dimensions or principal components, MDS uses similarity indices to create multi-dimensional outputs directly from measurements. A similarity index is created by calculating the similarity value [n(n-1)/2] between every pair of stations. The normalized Euclidean distance was used to calculate the MDS for chemical contaminants, and the Bray-Curtis coefficient was used to calculate the similarity index for macroinfaunal abundance. Both macroinfaunal and chemical datasets were log transformed [log(x+ 1)] prior to calculation of the similarity indices. The RELATE Primer® procedure and a Spearman correlation was used to determine the similarity between the two MDS plots. The BEST Primer® (Bio-Env) procedure and a Spearman correlation was also used to determine which chemical contaminants explained best macroinfaunal community structure. The hierarchical cluster analysis was used to detect differences between macroinfaunal community structure for the temporal change. The SIMPER Primer® procedure was used to determine which species drove differences in community structure. Correlation analyses with linear regressions were conducted to examine the strength and direction of the association between biological, toxicological and chemical indicators.
Results
Sediment chemistry
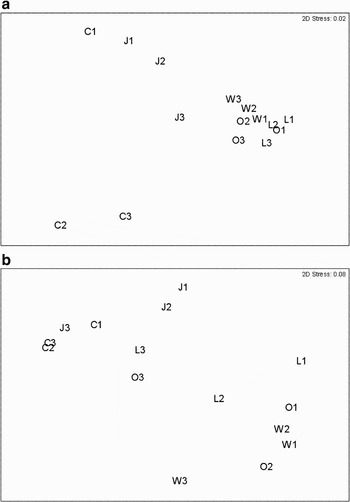
The ordination patterns for stations based on sediment chemical composition and macroinfaunal community structure matched (RELATE, rho = 0.437, p = 0.002) for the fixed-point design in 2000 (Fig. 2). In the fixed-point design, the variations in macroinfaunal community structure best matched the distribution pattern of the concentrations of four of the 22 chemicals (BIOENV, rho = 0.597): total inorganic carbon (TIC), total petroleum hydrocarbon (TPH), cadmium (Cd), and copper (Cu). These results are likely because of high concentrations of TPH, Cd, and Cu in landfill (L), outfall (O) and Winter Quarters Bay (W) sites.
Multi-dimensional scaling plots from the fixed-point design (2000). a. Sediment chemical contaminants, b. community structure of macroinfaunal species. Abbreviations for stations are described in Fig. 1.

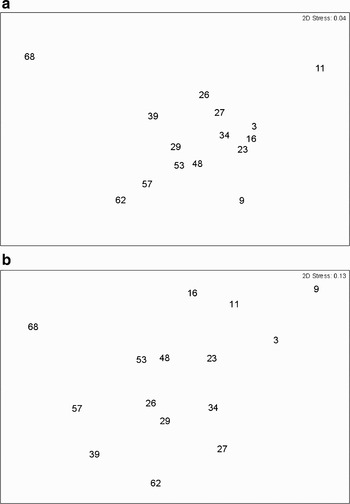
The ordination patterns for sediment chemistry and macroinfaunal community structure were similar (RELATE, rho = 0.574, p = 0.001) for the probabilistic design in 2001 (Fig. 3). Stations sampled in the probabilistic design had variations in macroinfaunal community structure that best fit (rho = 0.718) to the distribution of five of the 23 chemicals: TPH, barium (Ba), calcium (Ca), magnesium (Mg), and zinc (Zn). Except for TPH, these chemicals occur naturally in the environment and are not considered to be contaminants. In general the concentrations of the chemicals in the MDS plot increased from left (station 68) to right (station 11).
Multi-dimensional scaling plots from the probabilistic design (2001). a. Sediment chemical contaminants, b. community structure of macroinfaunal species.

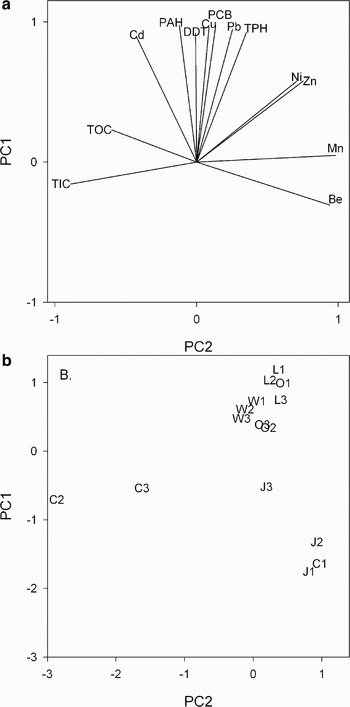
In the fixed-point design, the first two principal components combined to explain 90% of the variance in the dataset (Fig. 4). The first principal component (59.5% of the variance) was highly loaded for TPH, dichloro-diphenyl-trichloroethane (DDT), polyaromatic hydrocarbons (PAH), lead (Pb), Polychlorinated biphenyls (PCBs), Cu, Ni, and Zn. The second principal component (30.5% of the variance) was highly loaded for manganese (Mn) and beryllium (Be); and negatively loaded for TOC and TIC. The WQB, landfill, and outfall stations had high sediment concentrations of contaminants (TPH, Pb, PCB, Cu, DDT, and PAH). The shallow jetty, intermediate jetty, and shallow Cape Armitage stations, had high concentrations of Be and Mn. The intermediate and deep Cape Armitage stations had high concentrations of inorganic and organic carbon.
Principle components analysis of chemical contaminant concentration within sediments for fixed-point design (2000). a. Chemical loads, b. station scores. Abbreviations for stations are as in Fig. 1.

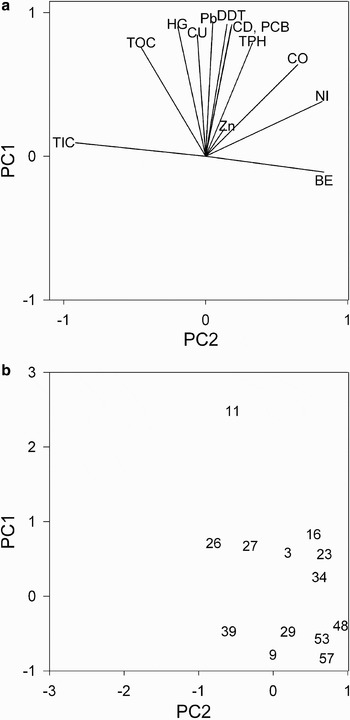
In the probabilistic design, the first two principal components combined to explain 81% of the variance (Fig. 5). The first principal component (57.5% of the variance) was highly loaded for TOC, Hg, Cu, Pb, DDT, Cd, PCBs, and TPH. The second principal component (23.8% of the variance) was highly loaded for Be; and negatively loaded for TIC. Only station 11, located near the landfill site, had high sediment concentrations of contaminants such as Hg, Cu, Pb, DDT, PCBs, and TPH. All other stations had high levels of Be and low levels of chemical contaminants.
Principle components analysis of chemical contaminant concentration within sediments for probabilistic design (2001). a. Chemical loads, b. station scores.

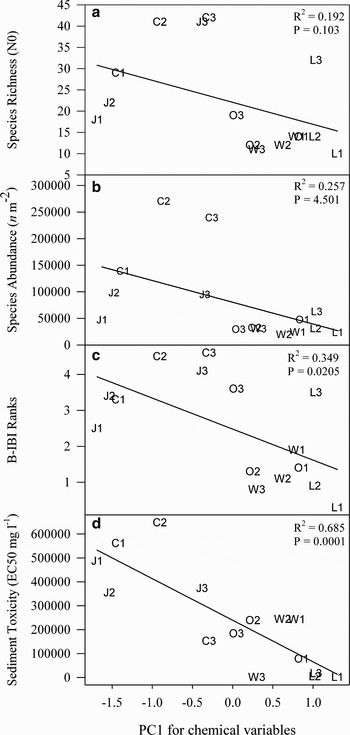
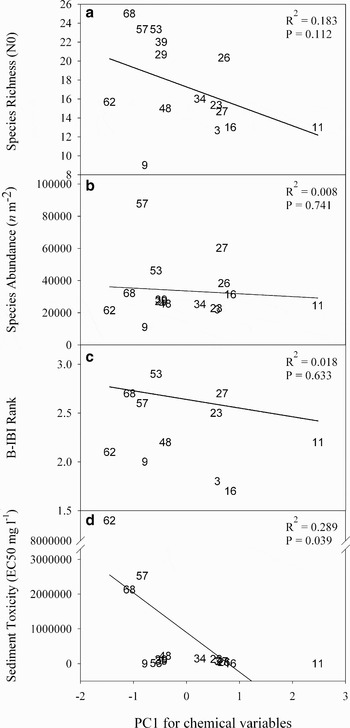
The chemical contaminant loads, which increased with increasing PC1 values (Figs 4 & 5), were used as independent variables to test for links with biological and toxicological responses (Figs 6 & 7). Species diversity and abundance decreased with increasing chemical contaminant load in both sampling designs (Figs 6 & 7). The B-IBI ranks and sediment toxicity significantly decreased with chemical contaminant load in the fixed-point design and sediment toxicity decreased significantly in the probabilistic design.
Linear regressions of biological and toxicological indicators from fixed-point design (2000) against the first PC axis score from the environmental log transformed PCA, which broadly represents an axis of increasing contaminant load. a. Species richness, b. species abundance, c. B-IBI rank, d. sediment toxicity. Abbreviations for stations are as in Fig. 1.

Linear regressions of biological and toxicological indicators probabilistic design (2001) against the first PC axis score from the environmental log transformed PCA, which broadly represents an axis of increasing contaminant load. a. Species richness, b. species abundance, c. B-IBI rank, d. sediment toxicity.

Sediment toxicity
Significant differences in sediment toxicity were found between stations (ANOVA, P < 0.0001) and transects (ANOVA, P < 0.0001) in the fixed-point design (Fig. 6). Transect differences reflect a pattern of decreasing toxicity with increasing distance from WQB and the landfill. In the probabilistic sampling design, sediment toxicity was high for stations located in WQB and up to the jetty (Fig. 7). Stations 57 and 62 (Cape Armitage) had significantly lower toxicity (i.e. high EC50 values) than any other station, and stations 9 and 11 (in WQB) had significantly higher toxicity than other stations (ANOVA, P < 0.0001). Sediments from stations 9 and 11 were also more toxic than the WQB transect sediments sampled in the fixed-point design, but sediments near Cape Armitage (station 57, 62, 68) that were sampled in the probabilistic design were less toxic than sediments sampled at Cape Armitage in the fixed-point design.
Marine benthos
In the fixed-point design, the Cape Armitage and jetty transect had significantly greater species abundance and richness values than all other transects (P < 0.0001). In the probabilistic design, stations outside of WQB also had significantly higher species abundance (ANOVA, P < 0.0001) and richness (ANOVA, P < 0.0037) than inside WQB.
With the exception of WQB, all the deep stations had higher B-IBI ranks than the shallow and intermediate depth stations in the fixed-point design (Fig. 6). The jetty and Cape Armitage transects also had higher ranks and better environmental quality then the WQB, landfill, or outfall transect. In the probabilistic design, stations within or near WQB had low B-IBI ranks.
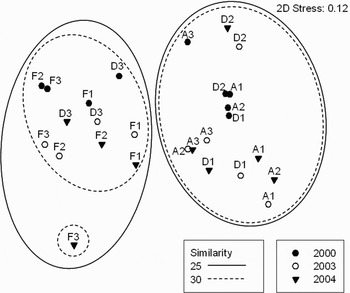
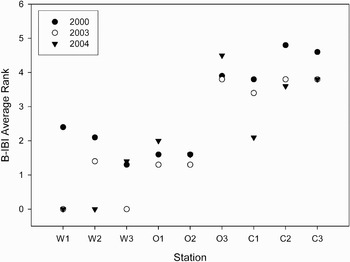
There was no significant temporal change (2000–2004) in community structure at the WQB, outfall, and Cape Armitage transects (Fig. 8). The deep outfall station and stations in the Cape Armitage transect had a similar community structure (25%). This community was characterized by a high abundance of the myodocopid ostracod Philomedes spp., the tanaid crustacean Nototanais dimorphus, oligochaetes, and podocopid ostracods. The dominant organisms in this community were N. dimorphus (9.87%), Philomedes spp. (9.01%), oligochates (7.93%), and the amphipod crustacean Heterophoxus videns (4.82%). The shallow and intermediate outfall stations and stations in the WQB transect had a similar community structure (30%). This community was characterized by a high abundance of the cirratulid polychaete Tharyx cincinnatus, and a moderate to low abundance of all other species. The dominant organisms in this community were T. cincinnatus (19.11%), H. videns (12.82%), the hesionid polychaete S. inermis (12.29%), and the isopod crustacean Austrosigum grande (11.6%). The B-IBI also showed a similar separation between stations (Fig. 9). The shallow and intermediate outfall stations and stations in the WQB transect had low biotic integrity ranks, while the deep outfall station and stations in the Cape Armitage transect had high biotic integrity ranks. One exception was at the shallow Cape Armitage station sampled in 2004, in which the sediment was frozen at time of sampling and had low species abundance.
Multi-dimensional scaling plot of macroinfaunal community structure for the fixed-point sampling design using nine stations from three transects (W, O, and C). Abbreviations for stations are as in Fig. 1.

B-IBI average ranks for stations sampled in the fixed-point sampling design using nine stations from three transects (W, O, and C). Abbreviations for stations are as in Fig. 1.

Discussion
Anthropogenic chemical contamination and organic enrichment are present in the marine system adjacent to McMurdo Station. Thus, the main goal of the current study was to collect information to design a cost effective and robust long-term monitoring programme. Fixed-point and probabilistic sampling designs were compared to determine which sampling design would be most effective in assessing the ecological integrity of the marine ecosystem over the long-term. Both sampling designs were compared based on SQT indicators that have proven to be sensitive indicators of disturbance in other marine settings world-wide.
Previous bioassay measurements using contaminated sediments from WQB found that biological effects observed in benthic communities were most probably caused by hydrocarbons, PCBs, and PCTs (Lenihan Reference Lenihan1992). In the current study, decreasing sediment toxicity and chemical contaminant concentrations were found with increasing distance from WQB and the landfill. This pattern correlates with decreasing hydrocarbon, metals, PCB, and PCT sediment concentrations with distance from WQB (Lenihan et al. Reference Lenihan, Oliver, Oakden and Stephenson1990, Risebrough et al. Reference Risebrough, Delappe and Younghanshaug1990). Sediment toxicity in WQB increased with increasing PCB, PCT, and hydrocarbon concentration (Crockett & White Reference Crockett and White2003).
The benthos at McMurdo Station increased in abundance and richness with increasing depth and distance from WQB. Increases in these benthic characteristics with distance from a contaminated area are common in environments disturbed by anthropogenic activities (Pearson & Rosenberg Reference Pearson and Rosenberg1978). Increases in species abundance and richness were also reported with increasing distance from WQB (Lenihan et al. Reference Lenihan, Oliver, Oakden and Stephenson1990, Lenihan & Oliver Reference Lenihan and Oliver1995, Conlan et al. Reference Conlan, Kim, Lenihan and Oliver2004). Low species abundance and richness values are also reported for Brown Bay, which is a repository for runoff contaminates from an old garbage tip of Casey Station in East Antarctica (Stark Reference Stark2000, Stark et al. Reference Stark, Riddle, Snape and Scouller2003, Reference Stark, Snape and Riddle2006). Trends in the B-IBI also indicated an increase in environmental quality with distance and depth from WQB. B-IBI's have been used in temperate marine and freshwater environments to assess environmental quality (Kerans & Karr Reference Kerans and Karr1994, Weisberg et al. Reference Weisberg, Ranasinghe, Schaffner, Diaz, Dauer and Frithsen1997, Van Dolah et al. Reference Van Dolah, Hyland, Holland, Rosen and Snoots1999, Carr et al. Reference Carr, Montagna, Biedenbach, Kalke, Kennicutt, Hooten and Cripe2000). The results of the B-IBI for McMurdo Station demonstrate that this indicator can effectively identify disturbed habitats in polar settings.
In some cases disturbance is uniformly distributed over an area with a linear or logarithmic decrease in intensity with distance from the disturbance source. However, based on the results of the present study, the marine ecosystem at McMurdo Station has a highly concentrated zone of disturbance with little transmittance of disturbance away from the source. This has ramifications for sampling design because random or probabilistic sampling assumes uniform distribution of disturbance and intensity over an area. At McMurdo Station the disturbance zone is well known, thus targeted fixed-point sampling is the preferred approach to monitor the disturbance over time.
The overall disturbance at high intensity at McMurdo Station is contained within a small spatial area (only a few km2) (Lenihan et al. Reference Lenihan, Oliver, Oakden and Stephenson1990, Kennicutt et al. Reference Kennicutt, Mcdonald, Sericano, Boothe, Oliver, Safe, Presley, Liu, Wolfe, Wade, Crockett and Bockus1995, Conlan et al. Reference Conlan, Kim, Lenihan and Oliver2004). Most disturbed areas at McMurdo, other than physical disturbance, occur over distances of less than a few metres. Few monitoring programmes are designed to detect change at the sub-metre scale, and there is no compelling reason to design the McMurdo Station programme to detect change at such fine detail.
Probabilistic and fixed-point sampling designs were used to assess the spatial variation in environmental quality at McMurdo Station. The fixed-point sampling design detected disturbances in the environment better than a probabilistic sampling design, because disturbance at McMurdo Station is a localized rather than a regional problem, i.e. patchy at a fine spatial scale (sub-metre). In order to detect localized contamination based on a probabilistic design a very large number of closely spaced stations would be required. A probabilistic sampling design with limited sampling stations could lead to a type two statistical error, in which one falsely accepts the null hypothesis (H0 = no disturbance at stations), although the alternative hypothesis is true (H1 = disturbance present at stations). The relative ability of the two designs to detect spatial variation is demonstrated with the regression values of chemical contaminants versus biological and toxicological variables (Figs 6 & 7). The fixed-point sampling design yielded regression values that were more significant than those found with the probabilistic design. The B-IBI also yielded different outcomes for the two sampling designs because it significantly (p = 0.0205) decreased with increasing contamination in the fixed design (Fig. 6), but was not significant (p = 0.633) for the probabilistic design (Fig. 7). The B-IBI ranks from the probabilistic design indicated that the area sampled was undisturbed, while the fixed-point design detected varying levels of disturbance. A fixed-point design will assess spatial variation in the marine ecosystem adjacent to McMurdo Station more effectively with fewer samples.
Annual variation (for the sampling season, November–December) can be a confounding factor when testing the efficacy of the two sampling designs because different stations were sampled between the two years. Species abundance values are comparable to values from the same general area as in previous studies (Lenihan & Oliver Reference Lenihan and Oliver1995, Conlan et al. Reference Conlan, Kim, Lenihan and Oliver2004). Stations sampled in the fixed-point design that were within hexagons sampled in the probabilistic design (W1–9, L2–11, O3–27, and J3–57) were analysed with nested ANOVAs for sediment toxicity and B-IBI station averages to test for annual differences. Log transformed EC50 values for sediment toxicity were significantly different between the years sampled (ANOVA, P < 0.0037), but B-IBI station averages were not significantly different between the two years sampled.
A fixed-point sampling design using nine stations from three transects (W, O, and C) was employed in 2003 and 2004. Combined with the 2000 sample, this allows us to assess temporal variation in macroinfauna over a 4-year period (Fig. 9). This fixed-point sampling design focused on the WQB, outfall and Cape Armitage transect. These three contrasting sites showed no significant change in macroinfaunal community structure over time (Fig. 8). The stations at Cape Armitage and the deep outfall station had a significantly different community structure from the stations at WQB and the shallow and intermediate outfall stations. The community structure at the Cape Armitage and the deep outfall station had similar species as those found at the Cape Armitage and jetty sites from a long-term study on the effects of organic enrichment by Conlan et al. (Reference Conlan, Kim, Lenihan and Oliver2004) sampled at 18 m depth. In the Conlan et al. (Reference Conlan, Kim, Lenihan and Oliver2004) study, the myocopid ostracod Philomedes spp. was also classified as a spatial dominant at the reference sites, and the tanaid crustacean N. dimorphus was also more abundant at the reference site, but present at the outfall site. The community structure at WQB and the shallow and intermediate outfall stations had similar species as those found at the outfall and WQB sites (Conlan et al. Reference Conlan, Kim, Lenihan and Oliver2004). Average species abundances for the isopod crustacean A. grande at the outfall station reported in Conlan et al. (Reference Conlan, Kim, Lenihan and Oliver2004) (~6600 m-2) was comparable to the abundance found at intermediate outfall station in this study (6700 m-2). In addition, the abundance of the hesionid polychaete Kefersteinia fauveli at the outfall station reported in Conlan et al. (Reference Conlan, Kim, Lenihan and Oliver2004) study (~1600 m-2) was comparable to the abundance of the hesionid polychaete S. inermis found at intermediate outfall station in this study (1702 m-2).
Contamination effects were localized in WQB and at the shallow and intermediate outfall station. The deep outfall station had a moderate B-IBI rank when sampled in the fixed-point design, but exhibited a community structure statistically similar (30%) to the reference at Cape Armitage when sampled over a four year period. This station is c. 50 m south-west of the outfall pipe, which indicates that the disturbance from organic enrichment is highly localized. The B-IBI ranks also exhibited the same pattern in biotic integrity and that there was little or no change over the four year period.
In the present study, the fixed-point sampling design was more effective at detecting the known contamination gradient than the probabilistic design (compare Figs 6 & 7 respectively). This conclusion is justified by the significant separation of macroinfaunal community structure between disturbed and undisturbed stations (Fig. 8), the localized pattern of contaminants (Figs 4 & 5), and the lack of interannual change over a 4-year period in the community structure (Figs 8 & 9). The fixed-point sampling design is also probably more efficient at detecting long-term change in the marine ecosystem adjacent to McMurdo Station because it requires fewer samples (and thus less cost) to identify the known contaminant gradient.
Acknowledgements
This research is supported by National Science Foundation grants OPP-9909445, OPP-0214473, OPP-0224550, OPP-0354573, and ANT-0354573 awarded to the Texas A&M Research Foundation with portions subcontracted to the University of Texas at Austin Marine Science Institute. We would like to acknowledge the help and work of Rick Kalke, Kristi Jones, and Dr Kathleen Conlan for sample identification; divers Rob Robbins, Kelly Hans, Christian McDonald, Doug Coons, Jack Baldelli, and Steve Rupp; field crew Dianna Gielstra, Steve Sweet, Dr Guy Denoux, Dr Andrew Klein, Kristi Jones, and Terry Palmer for sample collection. Chemical analyses were provided by the Geochemical and Environmental Research Group (GERG) of Texas A&M University. The authors would also like to acknowledge the help of the science support staff at McMurdo Station.