Introduction
Rutfard Ice Stream is a large glacier draining ice from the West Antarctic ice sheet into the Ronne Ice shelf (Fig. 1). It is bounded to the northeast by the slow-moving ice of Fletcher Promontory and to the southwest by the Ellsworth Mountains. Until recently, ground-based glaciological field work on Rutford Ice Stream concentrated mainly on the area upstream of the grounding line. Most of this work involved a combination of optical- and satellite-survey techniques and radio-echo sounding. Consequently, no measurements of sea-bed depths at the mouth of the ice stream have been made. Russian seabed- elevation data beneath the Ronne Ice Shelf do not extend far beyond 72° W Reference Pozdeyev and Kurinin(Pozdeyev and Kurinin, 1987)more than 250km from the grounding line ofRudard Ice Stream. Two field seasons of seismic surveys (1991–92 and 1992–93) investigating the bed of the ice stream have just been completed (Smith, in press). These surveys were also been completed (Smith, in press). These surveys were also concentrated above the grounding line but a number of seismic spot measurements of ice- and water-column thickness were made beyond where the ice begins to float. The aim of the measurements was to provide input data for both tidal modelling beneath the ice shelf and for modelling the dynamics of thicker ice (or lower sea level) in the ice stream.
Location map. The area covered by the maps in Figure 3 is indicated.

Seismic surveys
Depending on the available time and resources, one of three different seismic sources was used: 100 g explosive charges in back-filled 20 m holes; 150 g charges in back-filled 1m holes; or a number of hammer blows stacked together (usually 10–l5, but up to a maximum of 35). The data were recorded on a 24-channel seismograph from geophones at offsets between 30 and 260 m from the source. Data were recorded digitally and could be processed later, if necessary. A variety of record lcngths (0.8–2.5 s) and sample intervals (0.2 0.5 ms) were used. Site positions were determined by a combination of deadreckoning round closed loops, controlled by GPS and TRANSIT satellite-position fixes. Positions are generally accurate to within ± 200 m.
Identification of arrivals and possibleerrors
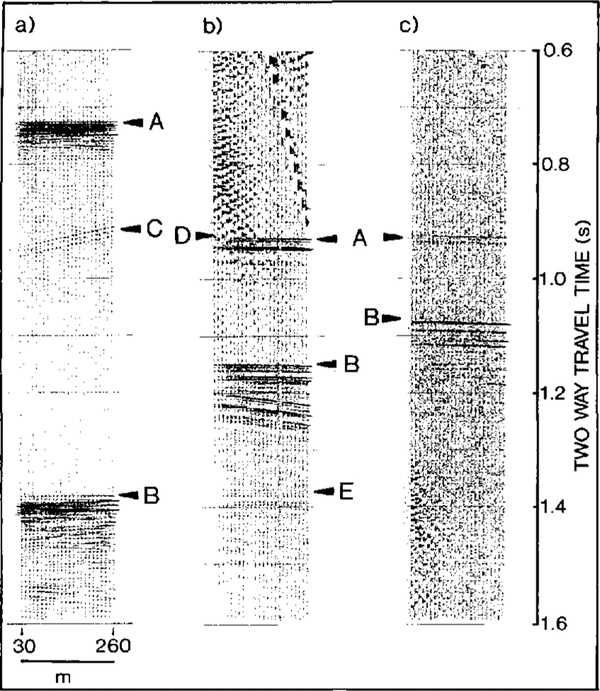
The seismic records are mostly of good quality. Examples of records from the three types of sources are shown in Figure 2. Ice- and water-bottom arrivals (called I1 and I1,W1, respectively, after Reference Crary, Robinson, Bennett and BoydCrary and others (1962)are clear on most of the records, although there are two sites, which could not be revisited, where the sea bed is almost certainly deeper than the hottom of the record. The deep explosive source produced the best records, whilst the hammer generally produced the worst. The shallow explosive source produced good quality ice-bottom and sea-bed reflections but, depending on the ice thickness, the ice bottom is sometimes ohscured hy surface waves on a few of the channels.
As the seismic wave velocity in the water will be less than half that in the ice, whilst the density is only slightly greater, the I1 arrival is expected to show a reversed polarity. Conversely, the increase in velocity and density across the water-bed interface means that a normal polarity reflection is expected forI1 W1 These polarities are seen c1ea rly on the records. Some confusion in interpreting the explosive-source records can come from natural acoustic energy caused by local fi'acturi ng (or settling) at relatively shallow depths within the icc stream itself These can usually be identified as short-period pulses travelling relatively slowly across the recording array, appearing as steep arrivals on the record. The hammer source is less susceptible to these arrivals, as they are unlikely to appear coherently on a number of separate records which arc thcn stacked together. Help in identifying arrivals correctly comes from the surface ghost on the deep explosive-source records. This is caused by energy which first travels upward from the shot and is then reflected downward from the free surface. Every arrival caused by the shot, rather than by natural acoustic energy, is therefore followed by an almost identical arrival around 20 ms later (slightly lcss on the example given in (Figure 2a)A further obstacle to identifying the sea bed appears to arise from reflectors (presumably) at the bottom of the ice, off to one side of the recording array. These appear as short sections of hyperbolic arrivals on the records and can usually be identified because they are steep, relatively weak and may cross one another (c.g. just below 0.9 s in (Figure 2a) Multiple reflections within the ice or water layers are much weaker than the primarv reflections (e.g. just above 1.4 s in Figure 2b).
Example records from each 0n the three source types. a. 20 m deep) exp)losive charge (100 g). b. 1m deep explosive charge (150 g). c. Fifteen stacked hammer blows. Tilf delays are different for the three records so the timescale is only absolute Jar c.A, ice bottom rejections; B, sea-bed reflections; C, (arrivals from reflectors off to one side ; D, surface waves obscuring nearer channels; E, weak multiple reflection from within the water layer (I1 w2 Reference Crary, Robinson, Bennett and Boydafter crary and others, 1962)

Conversion of travel times to depths
After discarding the arrivals which arc obviously artifacts, the ice bottom and sea bed can be confidently identified on virtually all the records. Travel times were then picked to an accuracy which depended on the sample interval and the quality of the record but were generally ±0.5 ms.
The mean velocity of compressional seismic waves in the icc column will be aHeeted by the ice temperature and by the relatively low velocity in the shallow snow and Ern. Data from a shallow refraction experiment were used to determine a correction for this low velocitv (see, for example,Reference Kirchner and BENTLEYKirchner and Bentley, 1990and an average velocity of 2839 m s ) was used for the top 100 m of the ice column. In the absence of direct observations of velocity in the rest of the ice column, the following approach was used. By analogy with data from the Ross Tee ShelfReference Robertson and BentleyRobertson and Bentley, 1990a velocity of 3811 ms-1 at a depth of 100m was assumed. A velocity value at the base of the icc of 3750ms 1 was calculated from a velocity/temperature relationship of 2.3 ms 1.c-1 Reference KohncnKohnen, 1974using the observed surface temperature of 28'C Uenkins andReference Jenkins and DOAKEDoake, 1991The temperature profile within the ice is unlikely to be linear, so it was assumed that the velocitv rcmains constant down to 300 m above the base, and that below this the reduction in velocity is linear. This results in an average velocit v value for the ice column belmv 100 m of 3805 ms-l
Thc velocity (V) in the sea water will depend on its temperature (T), salinity (s) and depth below sea ]eve1 (Z). A relationship of V = 1449 + 4.6T - 0.05T2+ 0.0003T3 + (1.39 – 0.012T)( 8 - 35) + 0.017 Z Reference McQuillan, Bacon and Barclay(McQuillan and others, 1979)was used with values of T = -2.2°C, S = 34.6 ppt (personal communication from Reference Smith and OerterA.Jenkins, 1993) and Z = 1800m. This gives a value of 1470ms-1.
uesing these veloci ty values, the measurcd rcflection times were corrected for normal move-out (NMO, the increased travel time caused by increasing rcceiver offset) and averaged to give the best values of ice- and watercolumn thickness at each site. The velocitv in the ice is probably accurate to better than 15 m s1 which, comhined with the accuracy of the travel-time picks :± 0.5 MS), gives an icc-thickness error of ± 7 m. The error in water-layer thickness will be less than this as the calculated velocity will be more accurate.
Since surface elevation was not measured directly, the sea-hed elevation was calculated assuming the ice is in hydrostatic equilibrium. This calculation ineluded values of sea-water density (1035 kg m 3; from Jenkins andReference Jenkins and DOAKEDoake (1991);average density of the top 100m of the ice column : 743 kg m-3 from the shallow relraction experiment; and average density of the rest of the ice column, assumed to be 917 kg m-3.Assumed errors 1ll these density values (between 5 and 10 kg m3 combine with the errors in thickness to give an esti ma ted error in the bedrock elcvation of ± 20 m. An independent surfaceelevation measurement (from Doppler satellite positioning combined with a kinematic GPS survey) is available [or only one o[the seismic sitf:s (personal communication fromReference Smith and OerterD. G. Vaughan, 1993)This observation and the elevation derived from the hydrostatic equilibrium consideration differ by less than 1 m. This gives some confidence in the choice of parameters and in the claimed accuracy.
Maps
Contoured maps of ice thickness, water-column thickness and sea-bed elevation are given in Figure: 3. The: iCe- thickness data (Fig. 3a)have been supplemented by ground-based radio-echo-sounding values from Stephenson andReference Vaughan, Doake and MantrippDoake (1982)Where points from the two data sets are near to one another, the values are reasonably close (maximum difference 56 m). However, the radioecho data were obtained 13 veal'S before the seismic data and icc-thickness variations with time are, in [act, likely on Rudord Ice Stream as the pattern of surface topography is seen to move downstream with the icc How (Reference Vaughan, Doake and MantrippVaughan and others, 1988)Airborne radio-echosounding data are also available over this area Reference Doake, Frolich, Mantripp, Smith and Vaughan(Doake and others, 1987)which agree with the seismic data when compared roughly, but errors in the navigation of the flight lines precludes a detailed comparison. An area of thin icc extends downstream from the gro.unding-line knoll. This is flanked by thicker ice, which thins again towards the iCe-stream edges. This variability continucs farther downstream with local thinner and thicker areas, ill agreement with the complicated ice-thickness pattern shown by Reference Doake, Frolich, Mantripp, Smith and VaughanDoake and others (1987).
Contour maps of (a) ice thickness (m), (b) water-column thickness (m) and (c) sea-bed elevation (metres helow sea LeveL). Solid circLes show seismic sites. Open circles show ice-thickness data points jrom StejJ/zenson and Doake (1982). Ice flow is from Left to right.

The water-column map (figure.3b) shows a smoother pattern. Compared with the icc-thickness map, this is based 011 largely the same data points so the smoothness is probably a real observation rather than an artefact of the contouring. A thin water column extends from the grounding-line knoll downstream towards the southeast. A thicker layer bounds the northeast and southwest sides of this. Thinning towards Fletcher Promontory and towards the Ellsworth mountains must be rapid as grounded ice is close to these two thicker water columns. The start of this thinning is just observed at the site closest to the mountains.
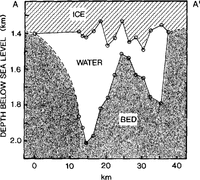
The sea-bed elevation map (Fig. 3c) is a combination of the ice- and water-column thickness data, with the added assumption of hydrostatic equilibrium. It shows a smooth ridge running southeast from the grounding-line knoll. roughly parallel to the trend of the ice stream. Deep troughs with similar trends bound the ridge to the northeast and southwest, and must rise rapidly towards the adjacent grounded ice. Cross-sections of the ice stream, both in the area o[ the seismic spot depths (Fig. 4) and Ii'om radio-echo sounding farther upstream IDoake and others. 1987), show a W-shaped profile.
Cross-section showing ice bottom, water column and sea bed along the line A-A'in(Figure 3a)Surface elevation and ice thickness at the two end points on the cross-section have been estimated from Reference Smith and OerterSievers and othen (1993)and from unpublished British Antarctic Survey data. The point .rhowing deepest bedrock in the .rhallower trough has been projected from 5km downstream. would be generated at the ice-bed

No attempt has been made to calculate sea-bed dips From the observed travel times at each site, as measurements were made in only one direction. However, dip components along these directions are indicated at some sites bv significant travel-time variations remaining between channels after the NMO correction. These agree qualitatively with the regional trends shown by the contouring.
Conclusions
Reference Doake, Frolich, Mantripp, Smith and VaughanDoake and others (1987)suggested that the icc in parts of this area could be lightly grounded. If this were the case, then it is possible that the acoustic impedances of the ice and the material beneath it could be very close (e.g.Reference Sievers Shabtaie and Bentley, 1987Tn this case, no reflectionwould be generated at the ice-bed interface. This does not appear to be the case at any of the seismic sites. Strong arrivals with reversed polarity (as expected from an icewater interface) are consistently the first main arrival on the records. There are only two sites where these are not followed by an arrival which can be identified with some confidence as the sea bed, and these occur in the area of thickest water column, adjacent to the mountains.
The thin water la yer (around 150m thick) extending from the grounding line must restrict any transfer of water between the adjacent deeper areas, and concentrate the ebb and flow of water with the tides to these two troughs. The trough adjacent to the mountains is particularly deep (more than 2 km below sea level) and continues upstream, shallowing only gently for at least 170kmReference Doake, Frolich, Mantripp, Smith and Vaughan(Doake and others, 1987)As has been noticed beforeReference maslanyj, Garretts, Johnson, Renner and Smith(Maslanyj and others, 1991)this deep trough represents a huge gash in the Earth's surface. A difference in bedrock elevation of around 7km exists between this trough and the summit of Vinson Massif 40 kin away.
Acknowledgements
We thank S. Abrahams, H. Corr, S. Redshaw, Alex Taylor and Asty Taylor for their help in the field.