Implications
Selection for heavy litters may deteriorate the sow’s condition at weaning that affects the following reproduction cycle in a negative way. The estimated genetic parameters indicate the importance of considering genetic relationships between litter weight, feed intake, appetite and body condition when developing breeding programmes to ensure sufficient production and reproduction of the sows.
Introduction
One of the goals in pig breeding is to wean large, heavy litters. These large, heavy litters require a sow that can meet the demands for high milk production. Moreover, a high performance is expected to be repeated through consecutive parities. The body resources available for production and reproduction are limited and there is a trade-off between different biological processes such as investment in maintenance, own growth, reproduction or growth, and survival of offspring (Rauw, Reference Rauw2009). Gilbert et al. (Reference Gilbert, Bidanel, Billon, Lagant, Guillouet, Sellier, Noblet and Hermesch2012) selected growing pigs for low or high residual feed intake and compared sows from the two lines. In generation 7, the low RFI-sows (i.e. more efficient animals) had higher litter weights at 3 weeks and lower feed intake during lactation, and larger weight loss during lactation. The sow’s milk production is reflected in the litter weight through the relationship of 1 kg piglet live weight corresponding to about 4 kg milk (e.g. Noblet and Etienne, Reference Noblet and Etienne1989). Sows increase their feed intake during lactation to reduce the negative energy balance caused by milk production, but usually not to a sufficient level. As a consequence there is a loss of body reserves during lactation. Grandinson et al. (Reference Grandinson, Rydhmer, Strandberg and Solanes2005) and Bergsma et al. (Reference Bergsma, Kanis, Verstegen and Knol2008) showed that there is genetic variation in sow weight change during lactation. It has been shown, both at the phenotypic and genetic levels, that sows with a higher ability to use their body reserves during lactation produce faster growing piglets with lower mortality risk compared with sows that mobilize less body reserves (Valros et al., Reference Valros, Rundgren, Spinka, Saloniemi, Rydhmer, Hulten, Uvnas-Moberg, Tomanek, Krejci and Algers2003; Grandinson et al., Reference Grandinson, Rydhmer, Strandberg and Solanes2005).
At the same time, as selection for large, heavy litters is progressing with depletion in sows’ body condition at weaning as a consequence, the selection for leanness adds to the dynamics of body condition and reproduction in at least two important ways. One is the genetic relationship between leanness and appetite resulting in leaner animals having lower appetite (Kanis, Reference Kanis1990). The other is leanness per se, where leaner sows have less body reserves already from the start of lactation. Poor body condition is related to reproduction problems (Whittemore, Reference Whittemore1996; Prunier et al., Reference Prunier, Soede, Quesnel and Kemp2003). Reproduction problems is the main culling reason for sows and a large proportion of this culling takes place in low parity numbers (Engblom et al., Reference Engblom, Lundeheim, Dalin and Andersson2007). For economic reasons, it is of great importance to have sows with high annual productivity, achieved by sows that reproduce and produce well and have the ability to delay involuntary culling. As described by Knap (Reference Knap2009), during the last few decades there has been a concern expressing the sow’s voluntary feed intake during lactation, increased demands on sow’s ability to build up and allocate body resources, and the possible consequences on reproduction.
The aim of this paper was to investigate the genetic relationship between the investments the sow makes by raising her 1st litter and the reproductive performance of the sow in her 2nd parity. We estimated genetic parameters for feed intake, litter weight, sow body condition and five reproduction traits.
Material and methods
‘Animal care and use approval’ was not needed for this study because the data were obtained from an existing database. Field data recorded on young Norwegian Landrace sows and their purebred litters between January 2008 and April 2010 were extracted from a litter recording scheme and provided by the breeding company, Norsvin.
Management
The study included data from 39 herds. The sows were loose housed in individual farrowing pens during the entire lactation period. Feeding regime during lactation differed between herds; the sows were given dry feed, wet feed or wet feed with dry feed as a complement. On farms using wet feed, the feed pellets were mixed with water or whey. In general, sows were fed restrictively in the beginning of the lactation period. The recommendation was 17.6 MJ net energy/day on the day of farrowing, and thereafter increasing the amount of feed by 8.8 MJ per day according to appetite. In the 3rd week of lactation, the recommendation was to feed the sows ad libitum, approximately between 70 and 110 MJ net energy/day. The sow feed contained ~10 MJ net energy/kg dry matter. The number of feedings per day varied from two to five between herds (Kongsrud, personal communication, 2011, Norsvin).
Trait definitions and data editing
In total, nine sow traits were considered in this study. Sows’ appetite (APP) was the farmer’s perception of the primiparous sow’s appetite during the first 3 weeks of lactation. APP was recorded 3 weeks after the 1st farrowing on a scale from 1 to 3 (1=reduced, 2=normal and 3=very good). The amount of feed was weighed and feed intake (FEED) was recorded in feed units consumed during a single day 3 weeks after the 1st farrowing. Feed intake during that day was converted to MJ, where 1 feed unit corresponds to 8.8 MJ net energy. Data on APP and FEED were collected specifically for this study. Litter weight at 3 weeks in the 1st litter (LW) was calculated as the sum of individual weights of the sow’s own and cross-fostered piglets, using routinely collected data. Sow body condition at 1st weaning (BC) was recorded on a scale from very thin (1) to very fat (9) (Hamar, Norway www.norsvin.no). BC was recorded specifically for this study, but most farmers had previously used the scale when deciding on feeding norms. Routinely collected data were used to determine weaning-to-service interval after 1st weaning, which was analysed as two traits; the 1- to 7-day interval (WSI7) where intervals larger than 7 days were regarded as missing and the 1- to 50-day interval (WSI50) where intervals larger than 50 days were regarded as missing and intervals larger than 5 days were transformed using the logarithmic transformation following ten Napel et al. (Reference ten Napel, de Vries, Buiting, Luiting, Merks and Brascamp1995) to adjust for the skewed distribution of the interval:
 $$\eqalignno{ {\rm WSI5}0 =\ & \left( {{\rm ln}\left( {{\rm weaning{\hbox-}to}{\rm {\hbox-}service}\,{\rm interval}} \right)/\left( {{\rm ln(6)}{{\hbox-}}{\rm ln(5)}} \right)} \right) \cr & -\left( {\left( {{\rm ln(6)}/\left( {{\rm ln(6)}{{\hbox-}}{\rm ln(5)}} \right)} \right){\hbox-}{\rm 6}} \right). $$
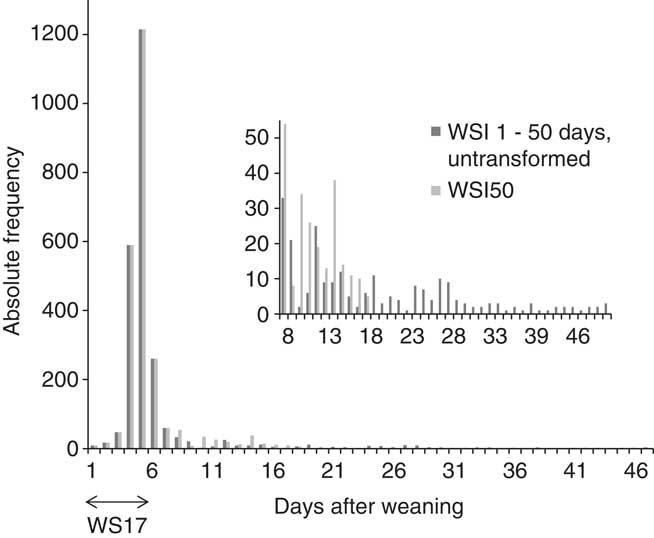
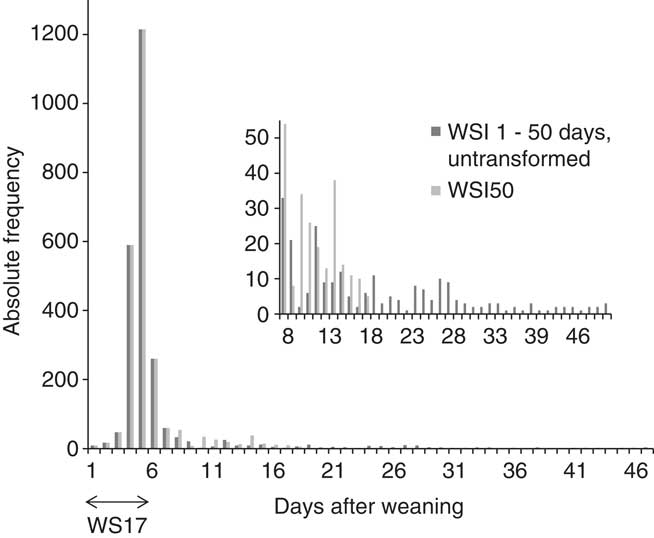
After this transformation, the interval of WSI50 ranged between 1 and 18 days. The distributions of weaning-to-service interval (from 1 to 50 days) and WSI50 are presented in Figure 1.
Distribution of weaning-to-service interval recorded during the first 50 days after weaning, and the analysed traits weaning-to-service interval of 1 to 7 days (WSI7) and transformed weaning-to-service interval (WSI50). Data from 2198 to 2430 sows in 39 herds registered from January 2008 to April 2010.
The trait DELAYED was defined as whether the sow was inseminated within the first 7 days after 1st weaning (1) or later (2), and the trait PREGNANT was defined as whether the sow got pregnant and delivered a 2nd litter <126 days after the 1st insemination (2) or not (1). Litter size in the 2nd litter was recorded as number of piglets born in total (NBT2), including stillborn piglets. Of the nine studied traits APP, FEED and LW were recorded during 1st lactation; BC at 1st weaning; WSI7, WSI50, DELAYED and PREGNANT after 1st weaning; and NBT2 at 2nd farrowing.
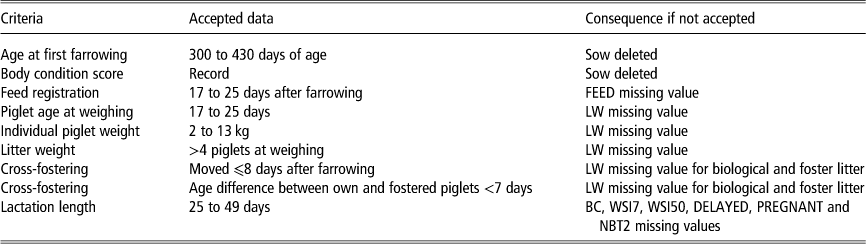
Data from herds with fewer than 30 litters during the time of data collection as well as data from six herds with no information on the trait DELAYED were excluded from the analyses. Of the 39 herds, 36 were nucleus herds (n=4435 sows) and three were commercial herds with purebred sows (n=171 sows). For sows to be included in the study, age at 1st farrowing was limited to an interval from 300 to 430 days (Table 1) and the mean age at 1st farrowing was 333 days (s.d.=24). The number of piglets born alive in 1st parity was on average 12.0 (s.d.=3.1) and 10.2 (s.d.=2.4) piglets were weighed on average. Individual piglets were weighed between 17 and 25 days of age, an interval recommended by the breeding company. Mean individual piglet weight was 6.9 kg (s.d.=1.8). The feed registration was done 21.6 days (s.d.=1.8) after farrowing on average.
Criteria used for editing the sow data set before genetic analyses
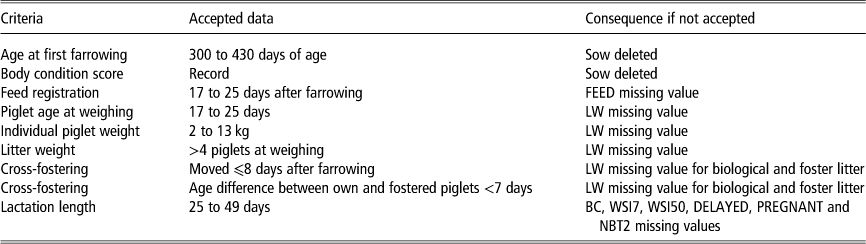
FEED=feed intake measured 3 weeks after farrowing; LW=litter weight at 3 weeks; BC=body condition at weaning; WSI7=weaning-to-service interval of 1 to 7 days; WSI50=weaning-to-service interval of 1 to 50 days, transformed; DELAYED=inseminated within 7 days after weaning or later; PREGNANT=pregnant after the first insemination or not; NBT2=total number of piglets born in 2nd parity.
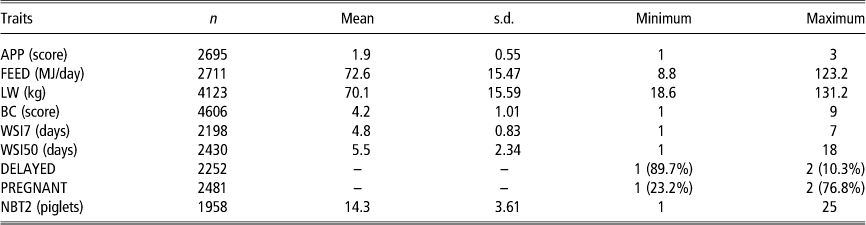
In nucleus herds, ~10% of the piglets were cross-fostered (Kongsrud, personal communication, 2011, Norsvin). In this study, weights of piglets moved from their original litter within 8 days after birth were included in the litter weight of the nursing sow (Table 1). Piglet weights outside the interval of the mean±3 s.d. (rounded upwards, i.e. 2 to 13 kg) were regarded as missing values. The average lactation length was 35.7 days (s.d.=5.7), which corresponds well to the lactation length of an average herd in Norway (Hamar, Norway www.norsvin.no). After data editing, the final data set contained information on 4606 Norwegian Landrace sows with purebred 1st parity litters. Around 90% of these sows had records on LW and 60% had records on FEED and APP. In nucleus herds, the aim is to keep a short generation interval. Thus, many sows were culled already after 1st litter, as reflected by the number of sows inseminated after 1st parity (2481 of 4606 sows). Around 20% of the sows inseminated after the 1st parity had no record from the 2nd parity (NBT2). Descriptive statistics for the traits included in the analyses are presented in Table 2.
Descriptive statistics for the traits in the genetic analyses made on 4606 Norwegian Landrace sows
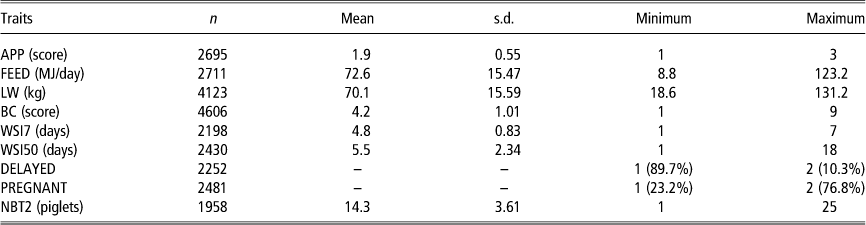
APP=appetite recorded at 3 weeks after farrowing (1=reduced, 2=normal and 3=very good); FEED=feed intake of 1 day (in MJ) measured 3 weeks after farrowing; LW=litter weight at 3 weeks calculated from the individual weights of the piglets in the litter; BC=body condition at weaning scored on a scale from very thin (1) to very fat (9); WSI7=weaning-to-service interval of 1 to 7 days; WSI50=weaning-to-service interval of 1 to 50 days transformed using a logarithmic transformation; DELAYED=the sow was inseminated within the first 7 days after weaning (1) or later (2); PREGNANT=the sow got pregnant and delivered a 2nd litter <126 days after the 1st insemination (2) or not (1); NBT2=the total number of piglets born in 2nd parity.
Statistical analyses
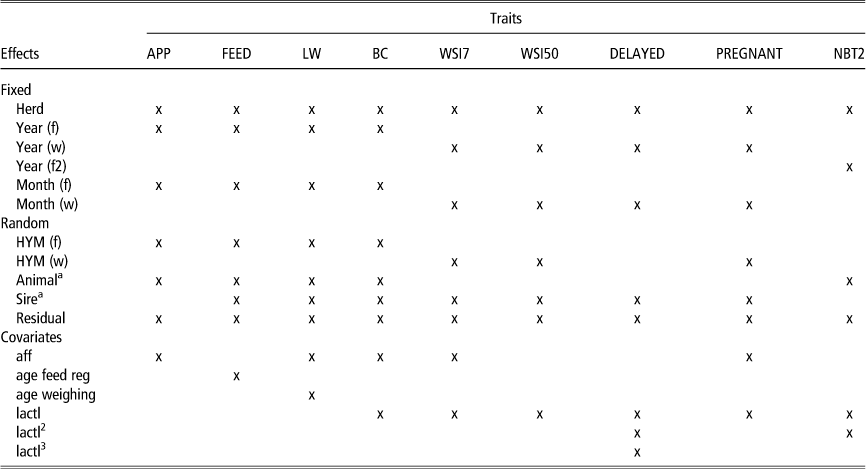
The traits APP, FEED, LW, BC, WSI7, WSI50 and NBT2 were analysed as normally distributed traits. DELAYED and PREGNANT were analysed as binary traits (Gianola, Reference Gianola1982). The choice of environmental effects in the genetic models was based on the significance of different fixed effects in preliminary phenotypic analyses. Fixed effects of herd and year were included in all models to handle environmental trends and systematic management differences between herds. The interaction herd×year×month (HYM) was included as a random effect to avoid extreme category problems. Extreme category problems arise when there is no variation in the analysed trait within a subclass of effects (Misztal and Gianola, Reference Misztal and Gianola1989). The genetic models are shown in Table 3.
Models used for genetic analyses of sow traits
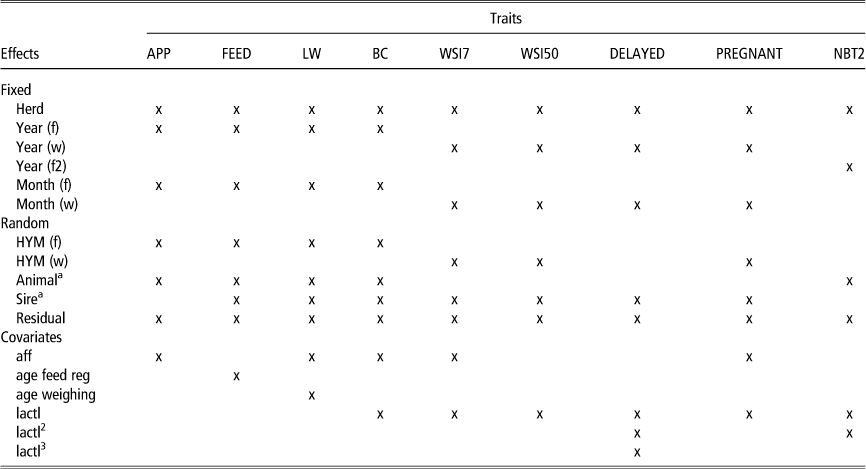
APP=appetite recorded at 3 weeks after farrowing (1=reduced, 2=normal and 3=very good); FEED=feed intake of 1 day (in MJ) measured 3 weeks after farrowing; LW=litter weight at 3 weeks calculated from the individual weights of the piglets in the litter; BC=body condition at weaning scored on a scale from very thin (1) to very fat (9); WSI7=weaning-to-service interval of 1 to 7 days; WSI50=weaning-to-service interval of 1 to 50 days transformed using a logarithmic transformation; DELAYED=the sow was inseminated within the first 7 days after weaning (1) or later (2); PREGNANT=the sow got pregnant and delivered a 2nd litter <126 days after the 1st insemination (2) or not (1); NBT2=the total number of piglets born in 2nd parity; f=farrowing 1st parity; w=weaning 1st litter; f2=farrowing 2nd parity; HYM=herd×year×month combination; aff=age at 1st farrowing; age feed reg=days from farrowing to feed registration; age weighing=mean age of piglets at weighing; lactl=lactation length; lactl2=quadratic lactation length; lactl3=cubic lactation length.
Included traits are marked with x.
a The models for APP and NBT2 included an animal effect, the models for FEED, LW and BC included an animal or a sire effect and the models for WSI7, WSI50, DELAYED and PREGNANT included a sire effect.
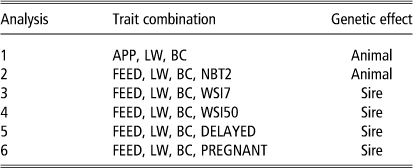
For the genetic analyses, six multi-trait combinations were formed. Two of the trait combinations were analysed using an animal model (Table 4). Trait combinations including the binary traits DELAYED and PREGNANT were analysed with a sire model. Owing to the small size of many herds in this data set, a sire model was also applied for trait combinations, including WSI7 and WSI50, to avoid extreme category problems in some HYM levels.
Trait combinations and the genetic effect included in the models used for each combination in the genetic analyses on data from 4606 Norwegian Landrace sows
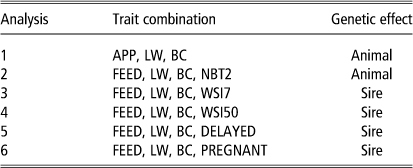
APP=appetite recorded at 3 weeks after farrowing (1=reduced, 2=normal and 3=very good); FEED=feed intake of 1 day (in MJ) measured 3 weeks after farrowing; LW=litter weight at 3 weeks calculated from the individual weights of the piglets in the litter; BC=body condition at weaning scored on a scale from very thin (1) to very fat (9); NBT2=the total number of piglets born in 2nd parity; WSI7=weaning-to-service interval of 1 to 7 days; WSI50=weaning-to-service interval of 1 to 50 days transformed using a logarithmic transformation; DELAYED=the sow was inseminated within the first 7 days after weaning (1) or later (2); PREGNANT=the sow got pregnant and delivered a 2nd litter <126 days after the first insemination (2) or not (1).
The 4606 sows were offspring of 213 sires. The pedigree for sows with records was traced five generations back. The pedigree files used for animal and sire model analyses included 10 887 and 1379 animals, respectively. In the studied herds, there was a 100% use of artificial insemination and the herds were genetically connected through the use of the same artificial inseminated boars.
APP was included in the study as a potential alternative to FEED. A preliminary analysis showed that APP had equally low heritability as FEED, but more iterations were needed to reach convergence for APP than for FEED. Thus, FEED was chosen for the final analyses of genetic correlations with reproduction traits.
The genetic analyses were performed using Gibbs sampling with the programs GIBBS2F90 and THRGIBBS1F90 developed by Tsuruta and Misztal (Reference Tsuruta and Misztal2006). The total number of iterations was set to 2 000 000. The post-Gibbs analysis was performed using the program Gibanal version 2.8 (van Kaam, Reference van Kaam1998). When a sire model was used, the additive genetic variance was defined as: σ
2
a=4×σ
2
s where σ
2
s denotes the variance of the sire effect. The phenotypic variance was calculated from each of the saved samples as: σ
2
p=σ
2
a+σ
2
e for animal model analyses and as σ
2
p=σ
2
s+σ
2
ε for sire model analysis, where σ
2
e and σ
2
ε denote the variance of residuals in the animal and sire model, respectively. The heritability was calculated as h
2=σ
2
a/σ
2
p. Genetic, residual and phenotypic correlations between two traits (X and
 ${\tilde{\rm X}}$
) were computed as
 $r_{{\rm g}} =\sigma _{{\rm a}{\tilde {\rm a}}} /\left[ {\sigma _{{\rm a}} {\times}\sigma _{{{\tilde{\rm a}}}} } \right],\,r_{{\rm e}} =\sigma _{{{\rm e}{\tilde{\rm e}}}} /\left[ {\sigma _{{\rm e}} {\times}\sigma _{{{\tilde{\rm e}}}} } \right]$
and
 $r_{{\rm p}} =\sigma _{{{\rm p}{\tilde{\rm p}}}} /\left[ {\sigma _{{\rm p}} {\times}\sigma _{{\tilde{\rm p}}} } \right]$
, where
 $\sigma _{{{\rm a}{\tilde{\rm a}}}} $
,
 $\sigma _{{{\rm e}\tilde{\rm e}}}} $
and
 $\sigma _{{{\rm p}{\tilde{\rm p}}}} $
denote the genetic, residual and phenotypic covariance between X and
 ${\tilde{\rm X}}$
and
 $\sigma _{{{\rm p}{\tilde{\rm p}}}} =\sigma _{{{\rm a}{\tilde{\rm a}}}} {\plus}\sigma _{{{\rm e}{\tilde{\rm e}}}} $
. For the sire model analysis
 $\sigma _{{{\rm a}{\tilde{\rm a}}}} =4{\times}\sigma _{{{\rm s}{\tilde{\rm s}}}} $
and
 $\sigma _{{{\rm e}{\tilde{\rm e}}}} =\sigma _{{{\rm {\varepsilon}}{\tilde{{\varepsilon}}}}} {\minus}3{\times}\sigma _{{{\rm s}{\tilde{\rm s}}}} $
.
Point estimates of parameters were obtained as the mean of the marginal posterior distribution. Posterior standard deviations (PSD) are presented as a measure of precision of the estimates. Parameters for FEED, LW and BC were estimated in five to six analyses (see Table 4). In one of them, the sire variance for FEED and the genetic covariance between FEED and LW were much lower than in the other analyses of these traits, resulting in a genetic correlation of 0.01 v. 0.22 to 0.39 in the other analyses of the same correlation. The variance components and heritability for FEED and the correlations for FEED–LW from this analysis were therefore not presented in Tables 5 and 6. For FEED, LW and BC, an average over four to six analyses of the point estimates are presented together with the largest PSD. The number of samples used as burn-in ranged from 6 to 5384, and the skip parameter for the different component estimates ranged from 3 to 13 578. The serial correlations between samples (after thinning) ranged from −0.0339 to 0.3291. The effective sample size (N e; number of samples left after burn-in and thinning) ranged from 148 to 51 282 for the variance components and from 24 to 38 460 for the correlations.
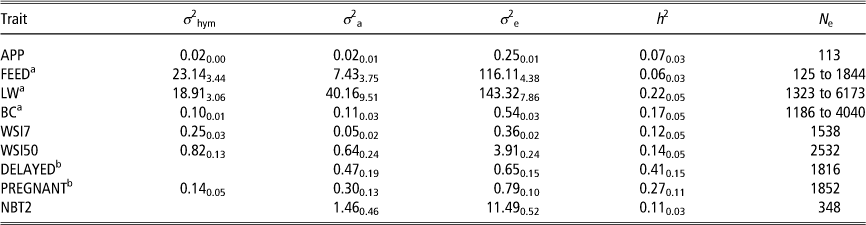
Variance components and heritability (h 2) estimates from Norwegian Landrace sows, PSD (as subscripts) and the effective sample size (N e) of the heritability estimate
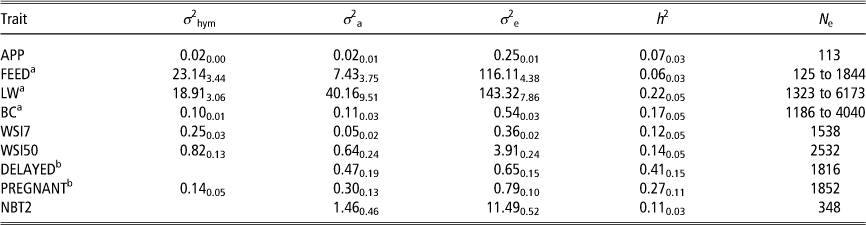
PSD=posterior standard deviation; σ 2 hym=herd×year×month environmental variance; σ 2 a=additive genetic variance; σ 2 e=residual variance; APP=appetite recorded at 3 weeks after farrowing (1=reduced, 2=normal and 3=very good); FEED=feed intake of 1 day (in MJ) measured 3 weeks after farrowing; LW=litter weight at 3 weeks calculated from the individual weights of the piglets in the litter; BC=body condition at weaning scored on a scale from very thin (1) to very fat (9); WSI7=weaning-to-service interval of 1 to 7 days; WSI50=weaning-to-service interval of 1 to 50 days transformed using a logarithmic transformation; DELAYED=the sow was inseminated within the first 7 days after weaning (1) or later (2); PREGNANT=the sow got pregnant and delivered a 2nd litter <126 days after the first insemination (2) or not (1); NBT2=the total number of piglets born in 2nd parity.
a The estimates of FEED, LW and BC are mean of estimates, their PSD are the highest value, and their N e are the lowest and the highest number from four to six multi-trait analyses.
b DELAYED and PREGNANT were analysed as threshold traits.
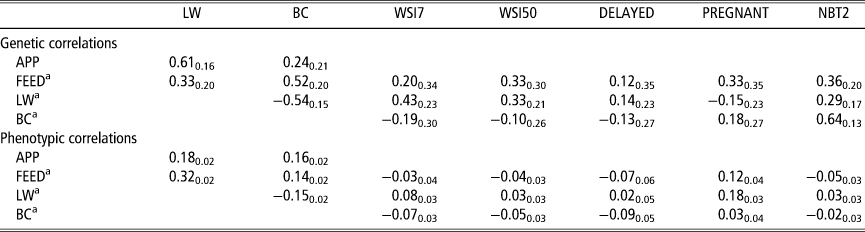
Genetic and phenotypic correlations between traits and their PSD (as subscript) estimated from Norwegian Landrace sows
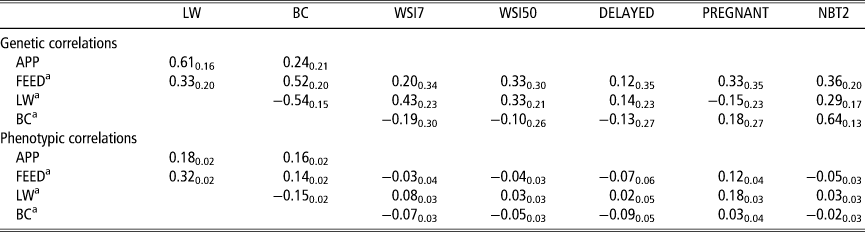
PSD=posterior standard deviation; LW=litter weight at 3 weeks calculated from the individual weights of the piglets in the litter; BC=body condition at weaning scored on a scale from very thin (1) to very fat (9); WSI7=weaning-to-service interval of 1 to 7 days; WSI50=weaning-to-service interval of 1 to 50 days transformed using a logarithmic transformation; DELAYED=the sow was inseminated within the first 7 days after weaning (1) or later (2); PREGNANT=the sow got pregnant and delivered a 2nd litter <126 days after the 1st insemination (2) or not (1); NBT2=the total number of piglets born in 2nd parity; APP=appetite recorded at 3 weeks after farrowing (1=reduced, 2=normal and 3=very good); FEED=feed intake of 1 day (in MJ) measured 3 weeks after farrowing.
a The correlation estimates between FEED, LW and BC are the means and their PSD are the highest values from four to six multi-trait analyses.
Results
The heritability estimates for the new traits APP and FEED were both low (<0.1) and of similar size. The heritability estimate for BC, a new trait subjectively recorded by the farmer, was around 0.2, which was similar to the heritability estimate for the routinely recorded LW (Table 5). The reproduction traits DELAYED and PREGNANT had higher heritability estimates than WSI7 and WSI50, but large PSD show that the precision of the estimates for DELAYED and PREGNANT was low.
The absolute values of the genetic correlations estimated between APP and LW (high appetite–high litter weight), FEED and BC (high feed intake–high body condition), LW and BC (high litter weight–low body condition), and BC and NBT2 (high body condition–large 2nd litter) were all higher than 0.5 and the estimates were more than twice their PSD (Table 6). The genetic correlations estimated between FEED and LW (high feed intake–high litter weight), FEED and NBT2 (high feed intake–large 2nd litter), LW and WSI7 and WSI50 (high litter weight–long intervals), and LW and NBT2 (high litter weight–large 2nd litter) were more than 1.5 times higher than their PSD. The correlations between BC and WSI7, WSI50 and DELAYED were negative, but these estimates were all weak; the PSD were larger than the corresponding estimate.
The estimates of the phenotypic correlations between APP and LW (high appetite–high litter weight), APP and BC (high appetite–high body condition), FEED and LW (high feed intake–high litter weight), FEED and BC (high feed intake–high body condition), LW and BC (high litter weight–low body condition), FEED and PREGNANT (high feed intake–more often pregnant), LW and WSI7 (high litter weight–long interval), LW and PREGNANT (high litter weight–more often pregnant), and BC and WSI7 (high body condition–short interval) were all higher than twice their PSD (Table 6).
Discussion
Heritabilities
The present study shows that it is possible to detect genetic variation in sow appetite through simplified measures in the field, which is promising. The estimated heritabilities for appetite during the first 3 weeks (APP; h 2=0.07, PSD=0.03) and for feed intake at 3 weeks (FEED; h 2=0.06, PSD=0.03) were, however, lower than estimates previously presented in the literature. Bergsma et al. (Reference Bergsma, Kanis, Verstegen and Knol2008) estimated the heritability for voluntary feed intake during the whole lactation period at 0.30, Gilbert et al. (Reference Gilbert, Bidanel, Billon, Lagant, Guillouet, Sellier, Noblet and Hermesch2012) at 0.26 and Bergsma et al. (Reference Bergsma, Mathur, Kanis, Verstegen, Knol and Van Arendonk2013) at 0.23. Bunter et al. (Reference Bunter, Lewis, Hermesch, Smits and Luxford2010) reported a heritability of average lactation feed intake at 0.15, and Hermesch et al. (Reference Hermesch, Jones, Bunter and Gilbert2010) estimated the heritability at 0.10 during early lactation (5 to 14 days). The low heritability in this study (compared with other studies) is probably explained by the simple way of recording. The trait APP was the farmer’s perception of the sow’s appetite during the first 3 weeks of lactation and even in small herds it can be difficult to observe and evaluate individual sows’ behaviour and performance. The other trait, FEED, was an objective measurement but from only one single day and may thus be affected by occasional, non-systematic factors. This is reflected in the minimum value (8.8 MJ), which corresponds to 1 kg sow feed. The development of techniques for electronic monitoring of feeding, for example, automatic feeder wagons, opens new possibilities to get repeated measurements of this important trait over several weeks in nucleus herds.
In this study, the assumption was that the sow’s feed intake was unrestricted and thus an expression of its genetic abilities. The feed was either given two to five times during the day or through self-feeders that were filled up manually or by the feeding system. In the study by Bergsma et al. (Reference Bergsma, Kanis, Verstegen and Knol2008), self-feeders were filled up twice a day, and in the study by Bunter et al. (Reference Bunter, Lewis, Hermesch, Smits and Luxford2010) feed was given three times a day ‘on demand’. Standal and Vangen (Reference Standal and Vangen1985) concluded that there is a difference in feed intake between feeding the animals according to appetite using a limited number of times per day and ad libitum feeding by using self-feeders. The database did not include data on feeding system, and although most of the effect of feeding system should be included in the herd effect, this could have influenced the FEED heritability estimate. If field data from, for example, automatic feeder wagons are used in the future, data on the feeding norm should also be collected.
The heritability estimated for LW in the present study (h 2=0.22, PSD=0.05) is comparable to previously published reports about preweaning growth traits in other populations (Högberg and Rydhmer, Reference Högberg and Rydhmer2000; Bergsma et al., Reference Bergsma, Kanis, Verstegen and Knol2008) and previous estimates from the studied Norwegian Landrace population (Canario et al., Reference Canario, Lundgren, Haandlykken and Rydhmer2010; Lundgren et al., Reference Lundgren, Zumbach, Lundeheim, Grandinson, Vangen, Olsen and Rydhmer2012), but higher than the heritability for litter weight at 3 weeks (h 2=0.09), recently estimated by Gilbert et al. (Reference Gilbert, Bidanel, Billon, Lagant, Guillouet, Sellier, Noblet and Hermesch2012).
The heritability estimate of BC in this study was 0.17 (PSD=0.05) and is comparable to a previous estimate in the same population at 0.14 (Lundgren et al., Reference Lundgren, Zumbach, Lundeheim, Grandinson, Vangen, Olsen and Rydhmer2012). In a study by ten Napel et al. (Reference ten Napel, Meuwissen, Johnson and Brascamp1998), body condition at weaning was measured by trained technicians using a similar scale as in the present study. The heritability was estimated at 0.33. In lactating Holstein-Friesian cows, Berry et al. (Reference Berry, Buckley, Dillon, Evans, Rath and Veerkamp2003) estimated heritabilities for body condition score (scale 1 to 5, increments of 0.25) at different stages of lactation, and for average body condition score. The estimates ranged from 0.29 to 0.43 for the different lactation stages, and heritability for average body condition score was estimated at 0.58. Other measures of body condition in sows, such as sow weight and back fat at weaning, show higher heritabilities than sow body condition score. Bunter et al. (Reference Bunter, Lewis, Hermesch, Smits and Luxford2010) estimated heritabilities of weight at weaning at 0.33 in the 1st parity and 0.27 in the 2nd parity. For fatness, the corresponding estimates were 0.35 and 0.26. Hermesch et al. (Reference Hermesch, Jones, Bunter and Gilbert2010) used data from several parities and reported similar estimates for sow weight (0.26) and back fat (0.40) at weaning. Bergsma et al. (Reference Bergsma, Kanis, Verstegen and Knol2008) estimated the heritability for BW loss during lactation at 0.20 and Bergsma et al. (Reference Bergsma, Mathur, Kanis, Verstegen, Knol and Van Arendonk2013) at 0.14.
Inspired by the discussion by ten Napel et al. (Reference ten Napel, de Vries, Buiting, Luiting, Merks and Brascamp1995) concerning normal (⩽7 days) and prolonged intervals, both WSI7 and WSI50 as well as delayed service (DELAYED) were studied. Despite the transformation, the distribution of WSI50 was still skewed (Figure 1). The estimated heritabilities in this study for WSI7 (h 2=0.12, PSD=0.05) and WSI50 (h 2=0.14, PSD=0.05) were slightly higher than earlier reported estimates (0.03 to 0.08) from the same population (Holm et al., Reference Holm, Bakken, Klemetsdal and Vangen2004; Lundgren et al., Reference Lundgren, Canario, Grandinson, Lundeheim, Zumbach, Vangen and Rydhmer2010). Adamec and Johnson (Reference Adamec and Johnson1997) reported a heritability of 0.14 for weaning-to-service interval analysed with no upper limit of days. Imboonta et al. (Reference Imboonta, Rydhmer and Tumwasorn2007) reported, from a tropical environment, heritabilities of 0.16 for WSI50 in the first two parities. The estimated heritability for DELAYED (h 2=0.41, PSD=0.15), an alternative way of distinguishing between normal and prolonged intervals, was higher than the estimate at 0.3 presented in a review by Rydhmer (Reference Rydhmer2000) and the estimate at 0.09 reported by Bergsma et al. (Reference Bergsma, Kanis, Verstegen and Knol2008). The estimate for DELAYED was, however, imprecise. The estimated heritability for becoming pregnant at first service (PREGNANT) was lower (h 2=0.27, PSD=0.11) than for DELAYED, but still high for being a reproduction trait. When comparing the heritability estimates for PREGNANT and DELAYED with estimates from the literature, it should be remembered that a threshold model was used in our study.
Correlations
The nine traits included in this study represent some of the different biological processes important for piglet production. As resource intake is a limiting factor during lactation, different priorities in resource allocation between the different processes involved result in some favourable and some unfavourable relationships (Rauw, Reference Rauw2009).
Phenotypic correlations between APP and LW, and between FEED and LW, were positive (r p=0.18, PSD=0.02 and r p=0.32, PSD=0.02) in this study. Under outdoor conditions, Wallenbeck et al. (Reference Wallenbeck, Rydhmer and Thodberg2008) reported phenotypic correlations around 0.4 between feed intake in early lactation (1 to 14 days) and piglet growth rate during the first 2 weeks and from 2 weeks until weaning. Bergsma et al. (Reference Bergsma, Kanis, Verstegen and Knol2008) also found a positive correlation between feed intake during lactation and litter weight gain (r p=0.37). The genetic correlation between APP and LW was positive (r g=0.61, PSD=0.16) in this study. The genetic correlation between FEED and LW was also positive but imprecise (r g=0.33, PSD=0.20). Bergsma et al. (Reference Bergsma, Kanis, Verstegen and Knol2008) and Bergsma et al. (Reference Bergsma, Mathur, Kanis, Verstegen, Knol and Van Arendonk2013) estimated similar genetic correlations between feed intake during lactation and litter weight gain (0.48 and 0.58). Sows with good appetite have a genetic potential for producing heavy litters. However, one can expect a certain amount of autocorrelation between FEED and LW. Despite the recommendation of ad libitum feeding, a farmer is probably less motivated to follow this recommendation when a sow is raising a litter of six to seven piglets than if the sow raises a larger litter. The phenotypic correlation between LW and BC was estimated at −0.15 (PSD=0.02), which is in accordance with the phenotypic correlation between litter weight gain and sow weight loss found by Bergsma et al. (Reference Bergsma, Kanis, Verstegen and Knol2008), showing that higher litter weight gain results in larger sow weight loss.
In the present study, FEED was genetically correlated with BC (r g=0.52, PSD=0.20), indicating that sows with a higher feed intake are able to maintain a better body condition. It seems that sows can meet part of the needs required for a high milk production when raising heavy litters through a high feed intake. However, the genetic correlation between LW and BC was negative and unfavourable (r g=−0.54, PSD=0.15). The genetic capacity for raising heavy litters is related to a lower body condition at weaning. Bunter et al. (Reference Bunter, Lewis, Hermesch, Smits and Luxford2010) reported an estimate of −0.38 for the genetic correlation between litter weight gain from 1 to 10 days of age and sow weight at weaning. Grandinson et al. (Reference Grandinson, Rydhmer, Strandberg and Solanes2005) estimated the genetic correlation between sow weight loss during lactation and piglet growth to −0.85 (high piglet growth rate–large sow weight loss) on data from a research herd. The genetic correlation between litter weight gain and sow weight loss during lactation found by Bergsma et al. (Reference Bergsma, Kanis, Verstegen and Knol2008) indicated a similar relationship, but the estimate was not significant. The high correlation in this study may be related to the fact that only 1st lactation was studied. Especially primiparous sows are not able to fully compensate for the high energy requirements during lactation (Eissen et al., Reference Eissen, Kanis and Kemp2000). Thus, there is a conflict concerning nutrient allocation between the requirements of a sow’s current litter v. her own requirements. Besides resources needed for milk production, the young sow is still growing.
As reviewed by Whittemore (Reference Whittemore1996), a negative energy balance has a negative influence on reproduction hormones such as the luteinizing hormone that is important for the development of follicles in the next reproduction cycle. When producing large and heavy litters, the depletion of body reserves increases the risk for a delay in return to oestrus after weaning (Sterning et al., Reference Sterning, Rydhmer, Eliasson, Einarsson and Andersson1990). Our hypothesis was that the genetic correlation between LW and weaning-to-service interval would be unfavourable. In this study, there was some support for such a relationship, but the estimates were imprecise (r g LW–WSI7=0.43, PSD=0.23; r g LW–WSI50=0.33, PSD=0.21). Tholen et al. (Reference Tholen, Bunter, Hermesch and Graser1996) estimated the genetic correlation between litter weight at 21 days and weaning-to-conception interval for 1st-parity sows to −0.09. Bergsma et al. (Reference Bergsma, Kanis, Verstegen and Knol2008) found an unfavourable but not significant genetic correlation (0.15) and a phenotypic correlation close to zero between litter weight gain and prolonged interval. The phenotypic correlations estimated between LW and weaning-to-service interval traits in this study were low (0.03 to 0.08), whereas Sterning et al. (Reference Sterning, Rydhmer, Eliasson, Einarsson and Andersson1990) presented significant unfavourable phenotypic correlations between piglet production traits and reproduction traits. For ovulating sows that showed standing oestrus, the phenotypic correlation between litter weight gain (0 to 3 weeks) and the interval weaning to 1st oestrus (IWO) was 0.18. The correlation between weight loss of the sow during lactation and IWO was 0.21. Differences in the phenotypic correlations between these traits in different studies can be explained by management factors such as feeding strategies and lactation length. Average lactation length in the studied data set was longer (35.7 days) than in many other populations; however, according to preliminary phenotypic analyses, lactation length between 32 and 43 days showed no differences in odds ratio for DELAYED compared with the mean lactation length. Wallenbeck et al. (Reference Wallenbeck, Rydhmer and Thodberg2008) showed that sows in outdoor production with 7 weeks’ lactation in average only decreased 1 kg from lactation day 14 to 49. Most sows in this study were able to recover from their investment in piglet growth during lactation to produce enough hormones for the onset of oestrus; 90% of the sows with records on weaning-to-service interval were able to show oestrus within 7 days after weaning.
In contradiction to other studies, the genetic ability of producing a heavy litter showed a positive relationship with the total number of piglets born in the following litter, but the estimate was imprecise (r g=0.29, PSD=0.17). Tholen et al. (Reference Tholen, Bunter, Hermesch and Graser1996) estimated an unfavourable genetic correlation between litter weight at 21 days in the 1st litter and number born alive in the 2nd litter (r g=−0.45) and the correlation was similar to the 2nd and 3rd parity (r g=−0.38). Hermesch et al. (Reference Hermesch, Luxford and Graser2000) also obtained a negative genetic correlation between the litter weight at 21 days in the 1st parity and number born alive in the 2nd parity. Quesnel et al. (Reference Quesnel, Etienne and Père2007) found that sows with high milk production owing to large litters mobilized more body reserves, which affected the development of follicles after weaning. The average volume of the 14 largest follicles 3 days after weaning was lower in sows nursing large litters (13 to 14 piglets) as compared with sows nursing small litters (7 piglets).
Sows with genetic potential for good body condition when weaning the 1st litter will produce a larger 2nd litter than other sows, as indicated by the positive and favourable genetic correlation between BC and NBT2 (r g=0.64, PSD=0.13). The estimated phenotypic correlation between these traits was around zero. Schenkel et al. (Reference Schenkel, Bernardi, Bortolozzo and Wentz2010) reported LS means for the size of the 2nd litter of sows with different body condition scores at weaning of the 1st litter. Body condition score was recorded on a scale from 1 to 5, and sows with a body condition score ⩾3.0 had a larger 2nd litter (10.2±0.21) than sows with a body condition score ⩽2.0 (9.4±0.18). For BW, sows in the lowest weight category (151.0 to 177.9 kg) had a litter size of up to about one piglet less (9.1±0.19) than sows weighing 178 kg and above (9.7±0.13 and 10.2±0.19). Sows with ⩾16 mm back fat had a larger 2nd litter (10.2±0.18) compared with sows with back fat measures ⩽15 mm (9.4±0.18 and 9.6±0.14). On the basis of the high genetic correlation between BC and NBT2 in our study, it can be assumed that those associations observed by Schenkel et al. (Reference Schenkel, Bernardi, Bortolozzo and Wentz2010) had a genetic background.
The genetic correlation estimates between BC and the traits WSI7 and DELAYED were negative but not significantly different from 0, owing to a large PSD (r g=−0.19, PSD=0.30 and r g=−0.13, PSD=0.27). Estimates between these traits reported by ten Napel et al. (Reference ten Napel, Meuwissen, Johnson and Brascamp1998) were close to zero, −0.09 and 0.08, respectively. The genetic correlation between BC and PREGNANT was positive but with large PSD (r g=0.18, PSD=0.27). In the previously mentioned study on dairy cows, Berry et al. (Reference Berry, Buckley, Dillon, Evans, Rath and Veerkamp2003) reported negative genetic correlations between body condition score at different stages of lactation and interval to first service. Correlations between body condition score and the trait ‘pregnant 63 days after the start of the breeding season’ were all positive and significant. Thus, although lower BC was genetically associated with heavier litters, results of this and other studies tend to show that a low body condition is related to inferior reproductive performance. The sows in this study were breeding sows from herds with a short generation interval, and therefore we focused on reproductive performance of 1st parity sows and their next pregnancy. Commercial sows are expected to produce many large and heavy litters during their life time. The consequences of the ongoing selection for high litter weight on lifetime reproduction should thus be further studied on commercial herds.
Conclusion
To breed for sows with a high lifetime production, it is necessary to include both production and reproduction traits in the breeding goal and to consider the genetic relationships between these traits over successive parities. Sows with a genetic ability for high appetite raise heavy litters and high feed intake during lactation is an important sow trait in piglet production. A heavy litter is related to a poor body condition of the sow at weaning. Poor body condition affects reproduction and can lead to early culling, whereas a better appetite, resulting in higher feed intake, would decrease that risk. This field study shows that it is possible to detect genetic variation in body condition at weaning through simple measures, but for sow feed intake the heritability was low as it was recorded here. Further studies on accurate recording of feed intake in a large scale and the effect of feed intake on sow longevity are needed. The results underline the complexity of sow performance and indicate the importance of considering genetic relationships between litter weight, feed intake and body condition when developing breeding programmes.
Acknowledgements
This study was financed by the Swedish Farmers’ Foundation for Agricultural Research (SLF). Data were provided by The Norwegian Pig Breeders Association (Norsvin). Last but not least, the authors thank the Norwegian pig farmers for their contribution through the work by weighing piglets and recording additional traits.