INTRODUCTION
The inclusion of white clover (Trifolium repens L.; hereafter referred to as WC) into perennial ryegrass (Lolium perenne L.; hereafter referred to as PRG) swards in temperate pasture-based dairy production systems can potentially increase dairy cow milk production and offer an alternative nitrogen (N) source to chemical fertilizer (Phillips & James Reference Phillips and James1998). However, swards which are solely reliant on N fixed by WC are often considered to be N deficient (Clark & Harris Reference Clark, Harris and Woodfield1996). Poor WC growth at low temperatures, especially in the spring period (Frame & Newbould Reference Frame and Newbould1986; Humphreys et al. Reference Humphreys, Casey and Laidlaw2009), can leave mixed PRG/WC pastures at a competitive disadvantage compared with PRG swards receiving high N fertilizer input. The use of N fertilizer on mixed PRG/WC swards can help overcome N deficiency (Ball & Field Reference Ball, Field and Lynch1982; Frame & Newbould Reference Frame and Newbould1986) and low spring herbage availability (Humphreys et al. Reference Humphreys, Casey and Laidlaw2009). Laidlaw (Reference Laidlaw1980) and Ryan (Reference Ryan1986) reported that 50–70 kg N fertilizer per hectare (ha) can be applied in spring to improve spring herbage production without affecting annual WC production, while later N applications are detrimental to WC content (Ryan Reference Ryan1986). Applying N fertilizer to PRG/WC swards across the full year can be advantageous as it can increase total dry matter (DM) production compared with swards reliant on N from WC (Ledgard et al. Reference Ledgard, Sprosen, Steele and West1995; Clark & Harris Reference Clark, Harris and Woodfield1996), but it can result in a decrease in sward WC content (Harris & Clark Reference Harris and Clark1996; Schils et al. Reference Schils, Vellinga and Kraak1999). Grazing management can be used to minimize the effects of fast PRG growth in spring and the objective of grazing management at this time should be to reduce shading by PRG to promote stolon branching and WC growth (McKenzie et al. Reference McKenzie, Jacobs and Kearney2003).
The value of WC in terms of milk production has previously been shown by Thomson et al. (Reference Thomson, Beever, Haines, Cammell, Evans, Dhanoa and Austin1985), Harris et al. (Reference Harris, Clark, Auldist, Waugh and Laboyrie1997a ), Harris et al. (Reference Harris, Auldist, Clark and Jansen1998) and Riberio Filho et al. (Reference Riberio Filho, Delagarde and Peyruad2003) in short-term component and indoor feeding trials. Increased milk production observed in those studies was due to a combination of both feed quality and intake factors (Clark & Harris Reference Clark, Harris and Woodfield1996; Harris et al. Reference Harris, Auldist, Clark and Jansen1998). In grazing swards, maintaining the required 500 g/kg DM WC in the sward for increased milk production (Harris et al. Reference Harris, Clark and Jansen1997b ) can be difficult to achieve and often sward WC content rarely exceeds 300 g/kg DM in New Zealand pastures (Chapman et al. Reference Chapman, Parsons, Schwinning and Woodfield1996), and 50 g/kg DM in Irish pastures (Nolan et al. Reference Nolan, Connolly and Wachendorf2001).
The objective of intensive dairy production in Ireland is to maximize milk production from grazed pasture (Humphreys et al. Reference Humphreys, O'Connell and Casey2008). Humphreys et al. (Reference Humphreys, Casey and Laidlaw2009) found that well-established PRG/WC swards with an annual fertilizer application rate of 90 kg N/ha can support low stocking densities (<2·2 cows/ha) and support similar performance per cow to PRG high N (226 kg N/ha) swards. However, increased herbage DM production on the high N swards indicates that a higher stocking rate and output per ha was possible compared with the low N WC-based system (Humphreys et al. Reference Humphreys, Casey and Laidlaw2009). Clark & Harris (Reference Clark, Harris and Woodfield1996) reported a benefit of using N fertilizer to increase DM production in mixed PRG/WC swards and also advantages of including WC in grass swards in terms of improved animal performance. The additional feed grown from the N fertilizer must be fully and efficiently utilized to maintain sward WC content (Harris & Clark Reference Harris and Clark1996). The effect of including WC in intensively managed Irish grass based milk production systems is relatively unknown.
The objective of the present study was to investigate the effect of including WC in N-fertilized PRG swards on milk production, milk fat and protein concentration, milk solids production and herbage DM intake (DMI) in an intensive grass-based spring calving dairy production scenario.
MATERIALS AND METHODS
Experimental site
The experiment was conducted at the Dairygold Research Farm, Teagasc, Animal & Grassland Research and Innovation Centre, Moorepark, Fermoy, Co. Cork, Ireland (52°10′N; 8°14′W; 68 m a.s.l) on an acid brown earth/brown podzolic soil of loam texture (0–20 cm texture: 500 g/kg DM sand, 320 g/kg DM silt, 180 g/kg DM clay and 130 g/kg DM organic matter concentration). Soils had a pH of 6·4 and were Index 3 and 4 (scale 1–4, 1 = deficient, 4 = no response to application of nutrient; Alexander et al. Reference Alexander, Black, Boland, Burke, Carton, Coulter, Culleton, Dillon, Hackett, Humphreys, Keady, Lalor, McHoul, Merfield, Murphy, O'Kiely, O'Riordan, Orlovius, Plunkett, Schulte, Tunney, Coulter and Lalor2008) for phosphorus and potassium.
Meteorological data
Meteorological data for the experimental period were collected at Teagasc, Animal and Grassland Research and Innovation Centre, Moorepark, Fermoy, Co. Cork, approximately 1 km from the experimental site. Over the course of the experimental period daily rainfall (mm), air temperature (°C) and soil temperature at a depth of 100 mm (°C) were recorded.
Experimental design
The experiment was undertaken from 6 February 2012 to 31 October 2012 (39 weeks). A total of 9 ha of permanent grassland were used for the experiment. In May 2010, 6 ha were reseeded, 3 ha with a 50 : 50 mixture of Astonenergy (tetraploid) and Tyrella (diploid) PRG cultivars sown at a rate of 27·2 kg/ha and 3 ha with the same PRG mixture plus a 50 : 50 medium leaf clover mixture of Chieftain and Crusader cultivars sown at a rate of 5 kg/ha. Prior to reseeding, the area was divided into three blocks of two paddocks and each treatment was randomly assigned to a paddock within each block. The remaining 3 ha (older sward) consisted of existing PRG, cultivar Tyrella, (1·5 ha) sown at a rate of 29 kg/ha and PRG (Tyrella, 29 kg/ha)/clover (Chieftain and Crusader, 50 : 50 mix at 5 kg/ha) (1·5 ha) established between 2008 and 2010. The older sward was divided into two blocks with each treatment present in each block. Separate farmlets of five paddocks were created and permanently fenced for each of the two sward types. Total farmlet area per treatment was 4·5 ha for the experimental period. The 2010 reseeded paddocks were used to measure DMI and cumulative herbage production. Other sward measurements, as outlined later, were conducted on all paddocks within each farmlet. Previous sward management is described by Enriquez-Hidalgo et al. (Reference Enriquez-Hidalgo, Gilliland, Deighton, O'Donovan and Hennessy2014) and was similar to the current experiment.
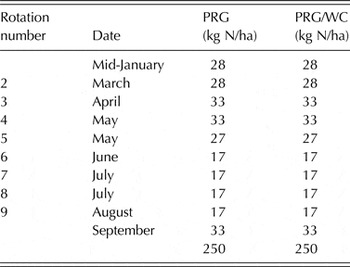
Swards received 250 kg N/ha. Nitrogen was applied in mid-January, mid-March and subsequently after each grazing rotation until September as described in Table 1. Urea (46% N) was applied until April (56 kg N/ha) and calcium ammonium nitrate (27% N) was applied thereafter (194 kg N/ha). Nitrogen fertilizer was broadcast using an Abbey fertilizer applicator (Nenagh, Co. Tipperary, Ireland).
Nitrogen fertilizer application strategy

PRG, perennial ryegrass – only sward; PRG/WC, perennial ryegrass and white clover sward.
In February 2012, 40 (six primiparous and 34 multiparous) spring-calving dairy cows were selected and balanced on breed (Holstein Friesian, Norwegian Red, Norwegian Red × Holstein Friesian, Jersey and Jersey × Holstein Friesian), calving date (4 February, standard deviation (s.d.) = 8·34 days), lactation number (3·1, s.d. = 1·04), pre-experimental daily milk yield (22·22 kg, s.d. = 4·11) and pre-experimental daily milk solids yield (fat plus protein) (1·87 kg, s.d. = 0·36), and then randomly assigned to one of two herds (n = 20). One 20-cow group rotationally grazed the PRG sward and the other group rotationally grazed the PRG/WC sward for the duration of the experiment.
Animal and grazing management
There were ten grazing rotations (6 February 2012 to 31 October 2012). Herbage production and sward clover content were measured in each paddock prior to each grazing event and results are presented as the average of each rotation. Milk production was measured weekly throughout the experiment (39 weeks) and DMI measured on three occasions (mid-May, mid-July and mid-September).
The target pre-grazing herbage mass (HM) was 1400–1600 kg DM/ha (4 cm above ground level) for the duration of the experiment, and the target post-grazing sward height (PostGSH) was ⩽4 cm for rotations 1–3 and 4 cm for the remainder of the experimental period. Cows received a daily herbage allowance of 17 kg DM/cow/day (>4 cm). Paddocks were rotationally grazed. The use of break fences allowed a fresh allocation of pasture to be offered after each morning and evening milking for the first rotation and every 24 h for the remainder of the experiment, when fresh herbage was offered daily following morning milking. If a PostGSH >4 cm was measured, cows returned to that area until the target 4 cm PostGSH was achieved. Fresh water was continuously available to the cows. Grass supply from each sward type was managed independently using the farm cover technique (O'Donovan Reference O'Donovan2000). A visual assessment (O'Donovan et al. Reference O'Donovan, Connolly, Dillon, Rath and Stakelum2002) of pasture cover was undertaken weekly and grazing management decisions were made as described by Wims et al. (Reference Wims, Delaby, Boland and O'Donovan2014). Pasture surplus to grazing requirements was conserved as bale silage on the older swards. Concentrate supplementation was used on both treatments when a herbage deficit occurred: both treatments received similar concentrate supplementation. Concentrates were fed from 6 February to 14 May (average 3 kg/cow/day), 9 July to 22 July (average 2·3 kg/cow/day) and 17 September to 31 October (average 1·9 kg/cow/day). In total, 507 kg DM of concentrate were fed to each cow over the duration of the experiment. The concentrate composition was 154·1 g/kg crude protein (CP), 40·9 g/kg neutral detergent fibre (NDF) and 102·8 g/kg ash. Concentrate supplementation was removed for herbage DMI measurements 1 and 3. However, for DMI measurement 2, 2 kg of concentrate DM/cow were fed to cows grazing each sward type. Swards were not mechanically conditioned during the experiment.
Sward measurements
Herbage mass
Pre-grazing HM (>4 cm) was calculated twice weekly for each sward type by cutting three strips 1·2 m wide and a known length with a lawn mower (Etesia UK. Ltd., Warwick, UK) in the area due to be grazed next. The harvested material was collected and weighed, and a sub-sample removed for DM and chemical analysis, of which 100 g was dried at 95 °C for 16 h to determine DM concentration. Sward height measurements were recorded before and after harvesting on each cut strip taking ten measurements per strip using a rising plate meter with a steel plate (diameter 355 mm and 3·2 kg/m2; Jenquip Ltd. (Feilding, New Zealand), to determine sward density (kg of DM/cm/ha) using the following equation:
 $$\eqalign{&{\rm Sward}\;{\rm density}\;({\rm kg}\;{\rm DM/cm/ha}) \cr &= \displaystyle{{{\rm herbage}\;{\rm mass}\;({\rm kg}\;{\rm DM/ha})} \over \hbox{pre-cutting}\,\hbox{height} - \hbox{post-cutting}\,\hbox{height}}}$$
The average paddock pre-grazing HM above 4 cm was then calculated according to the following equation:
 $$\eqalign{&\hbox{Pre-grazing}\,\hbox{herbage}\,\hbox{mass} (\hbox{kg}\,\hbox{DM/ha}) \cr &= (\hbox{pre-cutting}\,\hbox{height}\,\hbox{(cm)} - 4\,\hbox{cm}) \cr & \quad \times \hbox{sward}\,\hbox{density}\,\hbox{kg}\,\hbox{DM/cm/ha})} $$
Pre- and post-grazing sward heights
Pre-grazing sward height (PreGSH) above ground level was recorded daily for each sward type by taking a minimum of 50 measurements across the area about to be grazed following a ‘W’ shape using the rising plate meter described above. After grazing, a similar procedure was carried out to determine PostGSH above ground level.
Grass and clover content
The PRG/WC sward WC content was determined twice a week. Herbage was sampled >4 cm using Gardena hand shears (Accu 60, Gardena International GmbH, Ulm, Germany). Grab samples of herbage were taken in a ‘W’ shape at random locations in the area due to be grazed next. The sample was mixed, and two 70 g sub-samples were removed and separated into grass (sown PRG and weed grasses) and WC fractions. The fractions were dried at 40 °C for 48 h in a forced convection oven (Hope Valley, S33 6RB, UK) to determine the DM proportions.
Herbage chemical analysis
A composite sample of the three strips harvested to estimate pre-grazing HM in each sward type (150 g in total) was dried at 40 °C for 48 h, milled through a 1 mm screen using a Cyclotech 1093 Sample Mill (Foss, DK-3400 Hillerød, Denmark) and stored for chemical analysis.
The chemical composition of the harvested herbage was analysed by wet chemistry for organic matter digestibility (OMD), CP, NDF, acid detergent fibre (ADF) and ash concentrations. The OMD was estimated using the in vitro neutral detergent cellulase method (Fibretec™ Systems; Foss, Ballymount, Dublin, Ireland) described by Morgan et al. (Reference Morgan, Stakelum and Dwyer1989). Crude protein concentration was determined using a N analyser (FP-428; Leco Australia Pty Ltd., Castle Hill, New South Wales, Australia) based on the AOAC method 990-03 (AOAC 1990). The NDF and ADF concentrations were determined using a fibre analyser (Ankom Technology, Macedon, NY) based on the method described by Van Soest et al. (Reference Van Soest, Robertson and Lewis1991). Amylase and a sodium sulphite solution were used in the NDF concentration determination process. The NDF and ADF values do not include ash values. Ash concentration was estimated by burning a sub-sample in a muffle furnace at 500 °C for 12 h.
Animal measurements
All sampling procedures described as part of this experiment were executed in accordance with guidelines set by the Irish Minister for Health and Children under Section 8 of the Cruelty to Animals Act, 1876.
Milk production
Cows were milked twice daily, at 07:30 and 15:30 h, with an average of 3 h spent off the paddocks in the collecting yard and the milking parlour per day. Individual daily milk yield (kg) was recorded at each milking (Dairymaster, Causeway, Co. Kerry, Ireland). Milk fat and protein concentrations were determined weekly from one successive evening and morning milking. The concentrations of these constituents were determined using Milkoscan 203 (Foss Electric DK – 3400, Hillerød, Denmark). Milk solids yield (kg) was calculated as the yield of milk fat plus the yield of milk protein.
Herbage intake estimations
Individual DMI (n = 40) was estimated three times during the experiment, mid-May, mid-July and mid-September, using the n-alkane technique (Mayes et al. Reference Mayes, Lamb and Colgrove1986) as modified by Dillon & Stakelum (Reference Dillon and Stakelum1989). Intake measurements were carried out on the paddocks reseeded in 2010 only, so that all swards were of a similar age since reseeding. All cows were dosed twice daily, after milking, for 12 consecutive days with a paper bullet (Carl Roth GmbH, Karlesruhe, Germany) containing 500 mg of dotriacontane (C32 – alkane). From days 7–12 of dosing, faecal samples were collected from each cow twice daily before morning and evening milking, either in the paddock during the hour before milking by observing the cows and collecting the sample when voided, or by rectal grab sampling after milking. Faecal samples were stored at −18 °C until the end of the collection period. Faecal samples from each cow were thawed and bulked together (12 g from each sample), dried at 60 °C for 48 h, milled through a 1 mm screen and analysed for alkane concentration.
In conjunction, with the faecal collection, two herbage samples of approximately 15 individual grass snips were manually collected using Gardena hand shears (as described above) mimicking the grazing defoliation pattern observed on previously grazed swards, on days 6–11. The daily samples were stored at −18 °C. Frozen herbage samples were bowl-chopped (Muller, Type MKT 204 Special, Saabrücken, Germany), freeze-dried at −50 °C for 72 h, milled through a 1 mm screen and analysed for alkane concentration. The concentration of C31 and C32 in the faeces and the herbage samples and the amount of the C32 dosed were used to estimate DMI using the equation described by Mayes et al. (Reference Mayes, Lamb and Colgrove1986) as follows:
 $${\rm DMI}\;({\rm kg}\;{\rm of}\;{\rm DM}) = \displaystyle{{(F_i /F_j ) \times D_j} \over {H_i - ((F_i /F_j ) \times H_j )}}$$
where DMI is dry matter intake; H is the alkane concentration of herbage (mg/kg of DM); F is the alkane concentration of faeces (mg/kg of DM); i is the natural or internal marker odd number of carbon atoms alkane (C31); j is the synthetic or external marker even number of carbon atoms alkane (C32); and D j is the daily dose of even number of carbons atom alkane (C32) (mg/day).
Statistical analyses
All data were analysed using SAS 9.1.3 software (SAS Institute Inc., Cary, NC) (SAS Institute 2003). Pre-grazing HM, sward WC content, PreGSH and PostGSH were analysed using PROC MIXED in SAS, with sward type, rotation and the associated interaction included in the model. Sward type was included as the fixed effect. Paddock was the experimental unit, and was introduced as the random factor and the rotation was the repeated measure. Data are presented as means ± standard error (s.e.). Average cumulative herbage production is presented ±s.e.
Animal measurements were analysed using individual cow as the experimental unit. Although previous work has found that cows show synchronized grazing behaviour activities within the herd (Rook & Huckle Reference Rook and Huckle1995), no evidence exists that the production of isolated animals and groups are different. Additionally, the synchronization of grazing behaviour does not imply that the behaviour of individual cows is interdependent, as their behaviour may be affected by external factors that influence all animals equally (i.e. environmental and husbandry influences; Phillips Reference Phillips1998; Phillips Reference Phillips2002). Daily milk yield, daily fat concentration, daily protein concentration, and daily milk solids yield were analysed using PROC MIXED with week as the repeated measure. The 2-week pre-experimental average data for milk yield and milk composition were included as covariates in the model. These variables were analysed using the following model:
 $$Y_{ijkl} = \mu + C_{i} (S_{k} ) + P_{\,j} + S_{k} + Wk_{l} + P_{\,j} \times S_{k} + Wk_{l} \times S_{k} + b_{1 _{Xijk}} + e_{ijkl} $$
where Y
ijkl
is the response of the i cow in the k sward at l week; μ is the mean; C
i
(S
k
) the random effect of the cow within sward type; P
j
is the lactation (j = 1 to 5); S
k
is the sward type (k = PRG or PRG/WC); Wk
l
is the week of the experiment (1–39); Pj × S
k
is the interaction of P × S; Wk
l
× S
k
is the interaction of Wk × S;
 $b_{1_{Xijk}} $
the respective pre-experimental variable and e
ijkl
is the residual error term. Cumulative milk yield and milk solids yield was analysed using PROC GLM in SAS.
Herbage DMI estimations were analysed using PROC MIXED, including sward type, estimation period and the associated interaction, which were included in the model. Sward type was included as the fixed effect and animal as the random. Individual cow was the experimental unit and estimation period (May, July or September) was the repeated measure.
RESULTS
Meteorological data
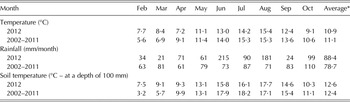
Meteorological data are shown in Table 2. Total rainfall was 12·6% greater for the 2012 experimental period compared with the average of the previous 10-year period (2002–11) (795 and 706 mm, respectively). June and August had 195 and 155%, respectively, greater rainfall than the previous 10-year average. Mean daily temperatures during the experimental period were similar to the 10-year average (10·9 and 11·3 °C, respectively). Average soil temperature at a soil depth of 100 mm for the 2012 experimental period was similar to the pervious 10-year average. In 2012, the soil temperature in February and March was +4·3 and +3·4 °C, respectively, greater than the previous 10-year average, while in June and July soil temperature was 2·1 °C lower in 2012 than the 10-year average.
Meteorological data during the experimental period (February to October 2012) compared with the previous 10-year average (2002–2011)

* Average = average February to October.
Sward measurements
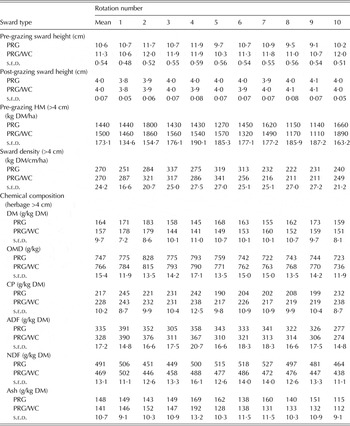
Pre-grazing HM (1467 ± 173 kg DM/ha), PreGSH (10·9 ± 0·54 cm) and PostGSH (4·0 ± 0·7 cm) were similar for both sward types (Table 3). The NDF concentration was greater for the PRG sward type (491 ± 13·1 g/kg DM) than the PRG/WC (469 ± 13·1 g/kg DM) sward type.
Effect of sward type and rotation on pre- and post-grazing sward height, sward density, pre-grazing herbage mass (HM) and herbage chemical composition during the experiment (6 February to 31 October) (N = 5)

Data are presented as least-squares means.
PRG, perennial ryegrass-only sward; PRG/WC, perennial ryegrass and white clover sward; s.e.d., standard error of the difference between means; OMD, organic matter digestibility; CP, crude protein; ADF, acid detergent fibre; NDF, neutral detergent fibre.
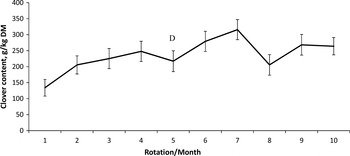
Average WC content in the PRG/WC sward (>4 cm) was 236 ± 30 g/kg DM (Fig. 1), which increased from 134 ± 25 g/kg DM in rotation 1 (February) to 316 ± 31 g/kg DM in rotation 7 (July/August).
Least-squares means of white clover content in the pre-grazing herbage mass (>4 cm) of the perennial ryegrass + clover swards during the experimental period (6 February–31 October). Error bars represent s.e. of the difference between means.

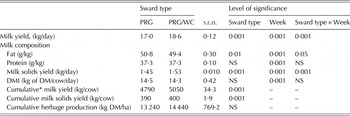
Total herbage production for the experimental period from paddocks reseeded in 2010 was 13 240 ± 769·2 kg DM/ha for the PRG only swards and 14 440 ± 769 kg DM/ha for the PRG/WC swards.
Effect of sward type and measurement occasion (6 February to 31 October) on total herbage production, milk production and composition and herbage dry matter intake (N =20)

Data are presented as least-squares means.
PRG, perennial ryegrass only sward; PRG/WC, perennial ryegrass and white clover sward; s.e.d., standard error of the difference between means; NS, not significant.
* Cumulative = total for experimental period (6 February to 31 October).
Animal performance
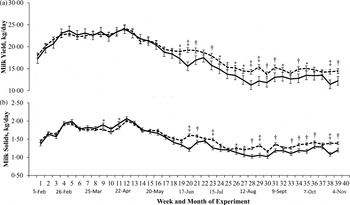
There was an effect of the interaction between sward type and week of experiment (P < 0·001) on daily milk yield (Table 4). Cows grazing the PRG and PRG/WC sward types had similar daily milk yield until week 19 (June) of the experiment (Fig. 2(a)). For the remainder of the experiment, milk yield was greater for cows grazing the PRG/WC sward type than for the cows grazing the PRG sward type, excluding weeks 22 (June), 36 and 37 (October) when cows on both sward types had similar daily milk yield.
Least-squares means of the effect of sward type (perennial ryegrass only (solid black line); perennial ryegrass + white clover (broken black line)) on dairy cow (a) daily milk yield and (b) daily milk solids across the experimental period (6 February–31 October). Error bars represent s.e. of the difference between means. *P < 0·05; †P < 0·01; ‡P < 0·001.

The sward type × week of experiment interaction had an effect (P < 0·05) on daily milk fat concentration (Table 4). Milk fat concentration was higher for cows on the PRG sward type than cows on the PRG/WC sward type in week 8 (March), weeks 9–13 (April) and week 25 (July) (data not shown). Cows grazing PRG/WC swards produced milk with significantly lower (P < 0·01) fat concentration (Table 4) than cows grazing PRG swards.
Week of experiment had a significant effect (P < 0·001) on milk protein concentration, which increased for cows on both sward types as the experiment progressed and reached a maximum in week 39 of the experiment (data not shown).
There was an effect of the interaction between sward type and week of experiment (P < 0·001) on daily milk solids yield (Table 4). Cows on both sward types had similar average daily milk solids yield until week 20 of the experiment (June), excluding weeks 9 and 11 (April) when the cows grazing the PRG sward type had greater daily milk solids yield (Fig. 2(b)). For the remainder of the experiment, daily milk solids yield was greater for cows on the PRG/WC sward type than for cows on the PRG sward type, excluding weeks 22, 24, 25 (July), 32 (August) and 37 (October) when cows on both sward type had similar milk solids yield (Fig. 2(b)).
Cumulative milk yield (5048 and 4789 ± 34·3 kg/cow, respectively) and milk solids yield (400 and 388 ± 1·87 kg/cow, respectively) were significantly greater (P < 0·001) for cows grazing PRG/WC swards compared with PRG swards (Table 4).
There was no significant difference in DMI between cows grazing the two sward types on any of the herbage DMI measurement occasions (Table 4; May (week 15 of the experiment), 14·4 ± 0·44 kg DM/cow/day; July (week 24 of the experiment), 13·1 ± 0·45 kg DM/cow/day; September (week 32 of the experiment), 15·8 ± 0·45 kg DM/cow/day).
DISCUSSION
The PRG/WC swards produced an extra 1200 kg DM/ha compared with the PRG-only swards on the paddocks reseeded in 2010. Within a farm system, this extra 1200 kg DM/ha is a valuable asset and provides additional forage either for grazing or for silage conservation. There was no difference in pre-grazing HM between sward types, and importantly, for spring calving pasture based milk production systems, in the first three rotations. During the first three rotations, the PRG/WC swards had an average sward WC content of 188 g/kg DM, higher than previously reported by Humphreys et al. (Reference Humphreys, O'Connell and Casey2008), who, during the same period, reported a WC content of 18 g/kg DM at a similar N fertilizer application rate (90 kg N/ha).
In the present study there was no difference in OMD or CP content between sward types, similar to that reported by Humphreys et al. (Reference Humphreys, Casey and Laidlaw2009) and Enriquez-Hidalgo et al. (Reference Enriquez-Hidalgo, Gilliland, Deighton, O'Donovan and Hennessy2014). The high N application rate (Whitehead Reference Whitehead1995; McKenzie et al. Reference McKenzie, Jacobs and Kearney2003) along with the relativity low pre-grazing HM and the grazing pressure implemented probably minimized the effect of sward type on herbage digestibility in the present study (Wims et al. Reference Wims, Delaby, Boland and O'Donovan2014).
Sward WC content can have a large impact on the quality of mixed swards. Harris et al. (Reference Harris, Clark, Auldist, Waugh and Laboyrie1997a ) and Harris et al. (Reference Harris, Auldist, Clark and Jansen1998) found a 15% decrease in NDF in swards with a WC content of 250 g/kg DM compared with PRG-only swards. In the current experiment, despite the high N fertilizer application rate, the PRG/WC swards had a 5% lower NDF concentration compared with the PRG only swards. The differences in NDF occurred in June and July when sward WC content was at its greatest, 217 and 316 g/kg DM, respectively.
Similar to the current experiment, Harris et al. (Reference Harris, Clark and Jansen1997b ) and Riberio Filho et al. (Reference Riberio Filho, Delagarde and Peyruad2003) have shown milk production benefits of mixed PRG/WC swards compared with pure PRG swards in short-term experiments. The main reason for increased milk yield in the above studies was increased DMI. Full grazing season studies similar to the current experiment (Humphreys et al. Reference Humphreys, Casey and Laidlaw2009; Enriquez-Hidalgo et al. Reference Enriquez-Hidalgo, Gilliland, Deighton, O'Donovan and Hennessy2014) found no difference in milk yield from cows grazing mixed PRG/WC swards compared with PRG swards. Humphreys et al. (Reference Humphreys, Casey and Laidlaw2009) attributed the lack of difference in milk production to the low sward WC content (<200 g/kg DM). Andrews et al. (Reference Andrews, Scholefield, Abberton, McKenzie, Hodge and Raven2007) previously reported that a sward WC content >200 g/kg DM is required to observe a milk production benefit. In contrast, in the current experiment WC inclusion in the sward had a positive effect on dairy cow milk production. Cows grazing the PRG/WC swards had greater average daily milk yield and milk solids yield compared with the PRG cows from mid-June onwards, which coincided with the increase in sward WC content, similar to Schils et al. (Reference Schils, Boxem, Jagtenberg and Verboon2000). The increased milk solids yield was due to increased milk yield rather than an increase in milk constituents similar to Harris et al. (Reference Harris, Auldist, Clark and Jansen1998) and Woodward et al. (Reference Woodward, MacDonald, Carter, Eerens and Crush2001). Ulyatt (Reference Ulyatt and Morley1981) and Caradus et al. (Reference Caradus, Woodfield, Stewart and Woodfield1996) found that an increase in animal performance due to the inclusion of WC in the diet was due to a combination of both feed quality and quantity. In the current experiment, herbage DMI was similar for cows on both sward types for all of the three DMI measurement occasions as cows were offered a fixed daily herbage allowance of 17 kg DM/cow/day, similar to Harris et al. (Reference Harris, Clark, Auldist, Waugh and Laboyrie1997a ), Wales et al. (Reference Wales, Doyle, Stockdale and Dellow1999) and Enriquez-Hidalgo et al. (Reference Enriquez-Hidalgo, Gilliland, Deighton, O'Donovan and Hennessy2014). Herbage allowance is directly related to DMI and milk production (Combellas & Hodgson Reference Combellas and Hodgson1979; Wales et al. Reference Wales, Doyle, Stockdale and Dellow1999). Thomson (Reference Thomson and Thomson1984) found that at similar levels of DMI, milk production can be about 10% greater from WC compared with PRG, which was similar to the findings of the current experiment. Although DMI and herbage OMD were similar, milk production was greater on the PRG/WC swards; this could be due to the lower NDF concentration of the PRG/WC swards. The cows grazing the PRG sward had a greater total NDF intake compared with the cows grazing the PRG/WC sward, as a result of the increased NDF concentration at similar levels of DMI. Additionally, Aitchison et al. (Reference Aitchison, Gill, Dhanoa and Osbourn1986) found that the rate of digestion of NDF is greater for clover compared with PRG. Beauchemin (Reference Beauchemin1991) reported that as the NDF concentration of the diet increased, it resulted in a linear decrease in daily milk production and an increase in milk fat concentration. The combination of the lower NDF intake and increased rate of digestion of NDF for WC could have accounted for the difference in milk fat concentration observed between the cows grazing the PRG/WC swards and the PRG swards.
The lower milk fat concentration observed on occasions during the current experiment for cows on the PRG/WC sward type is probably related to the relatively high WC content and reduced NDF concentration in the WC swards. Previous authors have found similar results (Thomson et al. Reference Thomson, Beever, Haines, Cammell, Evans, Dhanoa and Austin1985; Harris et al. Reference Harris, Clark, Auldist, Waugh and Laboyrie1997a ; Woodfield & Clark Reference Woodfield and Clark2009). The reduction in milk fat concentration for cows on WC swards is generally associated with a faster rate of passage of feed (Ulyatt Reference Ulyatt and Morley1981; Thomson et al. Reference Thomson, Beever, Haines, Cammell, Evans, Dhanoa and Austin1985) as a result of lower levels of structural carbohydrates (Davies Reference Davies1992), which are broken down more rapidly in the rumen, reducing retention in the rumen (Thomson et al. Reference Thomson, Beever, Haines, Cammell, Evans, Dhanoa and Austin1985). Large particles break down to small particles more quickly and small particles leave the rumen more rapidly with WC compared with PRG (Moseley Reference Moseley1981).
There was no difference in milk protein concentration between treatments, similar to Phillips & James (Reference Phillips and James1998) and Enriquez-Hidalgo et al. (Reference Enriquez-Hidalgo, Gilliland, Deighton, O'Donovan and Hennessy2014). This is not uncommon in a mixed PRG/WC sward. The CP concentration of both swards was similar (223 g/kg DM) and both met the protein requirements (>170 g/kg DM) of lactating dairy cows (Butler Reference Butler1998).
CONCLUSION
The average sward WC content in the present study was high, relative to other studies, at 236 g/kg DM despite the high level of N fertilizer applied (250 kg N/ha). Herbage production on the PRG/WC sward was similar to the PRG sward; however, herbage quality was generally higher for the PRG/WC swards compared with the PRG sward later in the season as the proportion of WC in the sward increased. Milk production was greater in mid- to late lactation for cows grazing the PRG/WC sward compared with the PRG sward, coinciding with the time when WC content was greatest in the PRG/WC sward. It is important to evaluate mixed PRG/WC based swards over a number of years to evaluate the persistence of the WC under high N fertilizer application with frequent and tight grazing management imposed and its influence on animal performance.
The authors wish to acknowledge the support received from Dairy Research Ireland and the Teagasc Walsh Fellowship Scheme. The authors also wish to thank S. Fitzgerald, N. Galvin and M. Feeney for their technical assistance and the staff of the Dairygold and Moorepark Research Farms for their care of the animals and assistance with measurements during the experiment.