The phase transformation behavior of silicon under contact loading has been the focus of research for many years. During nanoindentation, crystalline silicon (c-Si), that is the diamond cubic Si-I phase, transforms to a metallic β-Sn phase at a pressure of ~11 GPa, involving a 22% increase in density.[Reference Minomura and Drickamer1] During unloading, Si-II undergoes further phase transformation (depending on unloading conditions) to amorphous silicon (a-Si) and/or to the high-pressure crystalline phases Si-III and Si-XII.[Reference Domnich and Gogotsi2] Details of load–unload curves can be directly correlated with the induced structural changes. A change in slope of the unloading curve may involve either an “elbow” or a “pop-out”. The former is predominant when an amorphous phase is observed during rapid unloading while a pop-out corresponds to the formation of high-pressure phases.[Reference Domnich, Gogotsi and Dub3] Some recent work on ion-implanted a-Si suggests that it behaves in a similar way provided it is in a relaxed state, which is achieved by annealing at 450 °C following implantation but prior to indentation.[Reference Haberl, Bradby, Ruffell, Williams and Munroe4]
To date, very little work has been reported on the phase transformation behavior of Si during nanoindentation at elevated temperature. Previous elevated temperature indentation studies have been exclusively used to measure the temperature dependence of the mechanical properties of materials,[Reference Suzuki and Ohmura5–Reference Lund, Hodge and Schuh8] whereas few attempts have been made to understand phase transformation pathways.[Reference Domnich, Aratyn, Kriven and Gogotsi7, Reference Singh, Munroe and Hoffman9] Previous work showed that nucleation of Si-III/Si-XII on unloading is enhanced with increasing temperature but the final composition of the phase-transformed zone is also dependent on the thermal stability of phases in their respective matrices.[Reference Ruffell, Bradby, Williams, Munoz-Paniagua, Tadayyon, Coatsworth and Norton10] However, the situation is not clear and the current paper has focused on following the phase transformation pathways in both c-Si and a-Si matrices at an elevated temperature during indentation. A range of new and intriguing transformation behaviors has been found. In particular, the enhanced thermal stability of our instrumentation system provides evidence of progressive phase transformation from Si-II to Si-I even during indentation loading.
All samples were cleaved from a Czochralski-grown single crystal Si (100) wafer, boron doped to a resistivity of 10–20 Ω cm. The a-Si samples were created by self-ion implantation using the ANU 1.7 MV NEC tandem high-energy ion implanter. A range of energies (80 keV–2 MeV), each to a fluence of 1 × 1015 cm−2, was used to form a continuous surface layer of 2 µm thickness. Some a-Si samples were relaxed by annealing at 450 °C in a nitrogen ambient for 30 min. Indentation was performed using a Hysitron TriboIndenter fitted with a diamond Berkovich tip. To be able to perform tests at elevated temperature, this instrument was fitted with a custom-built heating stage that enables temperature stability to be better than 0.1 °C up to 400 °C. The design is based on that of a system built at the University of Western Ontario.[Reference Ruffell, Bradby, Williams, Munoz-Paniagua, Tadayyon, Coatsworth and Norton10, Reference Trenkle, Packard and Schuh11] It should be noted that only the sample is heated in this design and the tip is not independently heated. The indentations were performed at 25 °C (“room temperature”) and at temperatures up to 200 °C. Loads up to 10,000 µN were applied using a loading time of 1 s and an unloading time of 50 s, corresponding to an unloading rate of 200 µN/s. These indentation conditions resulted in a maximum penetration depth of ~220 nm and a residual indent of ~1 µm across and ~75 nm deep in c-Si. The residual indents were analyzed by Raman spectroscopy and cross-sectional transmission electron microscopy (XTEM). Raman spectroscopy was conducted with a Horiba T64000 Raman imaging microscope using the 632.8 nm excitation line of a helium–neon laser with an incident power of up to 12 mW focused to a spot of ~1 µm radius. A Philips CM 300 instrument operating at an accelerating voltage of 300 kV was used for the conventional bright-field transmission electron microscopy imaging of samples prepared using a focused ion beam milling and the “pluck-out” method.[Reference Saka12] Selected area diffraction (SAD) was taken using an ~300 nm aperture directly beneath the residual indent impression.
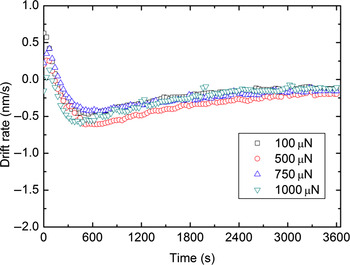
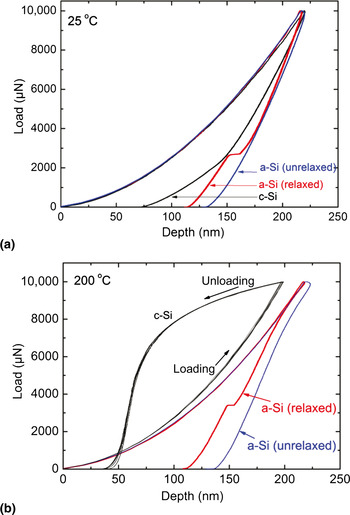
In a previous study by the current authors,[Reference Ruffell, Bradby, Williams, Munoz-Paniagua, Tadayyon, Coatsworth and Norton10] it was difficult to observe the true load–unload curves for slow loading rates due to the significant thermal drift occurring at the elevated temperatures. This is in fact the case in all other previous elevated temperature studies of phase transformations in Si.[Reference Domnich, Aratyn, Kriven and Gogotsi7, Reference Singh, Munroe and Hoffman9] Thus, it was essential in the current study to reduce this drift to a negligible level. Figure 1 shows the drift rate at 200 °C (the worst case in this study) obtained by holding the tip under load control on the sample surface at fixed low loads and measuring the tip displacement required to maintain this load. Irrespective of tip–sample contact area (different loads) the drift rate shows a transient period and reaches a near-constant (~−0.2 nm/s) rate after ~1 h. The drift data are similar for tests at 25 °C and are repeatable from day to day. Thus, by maintaining tip–sample contact for 1 h before proceeding with the indentation tests and continuing to maintain contact between each of the indents, the small thermal drift component can be corrected for in the load–unload data. Altogether, 25 indents were performed at each temperature. Indeed, there is little evidence for thermal drift in load–unload curves from indentation tests made in unrelaxed a-Si (where no phase transformations occur), as shown, for example, in Fig. 2.
Plot of the instantaneous drift rate as a function of time at 200 °C for different holding loads for a diamond Berkovich tip brought into contact with c-Si.

Loading–unloading curves of c-Si and ion-implanted unrelaxed and relaxed a-Si at (a) 25 °C and (b) 200 °C with an unloading rate of 200 µN/s. At 200 °C, the c-Si load–unload curve shows unusual “bowing” behavior whereas “pop-out” can be clearly seen in a-Si.

Figure 2 shows load–unload data for tests made in c-Si and both relaxed and unrelaxed a-Si at 25 and 200 °C. A pop-out event on each of the unloading segments of relaxed a-Si was observed, which is indicative of a sudden increase in volume of material directly under the indenter tip and is suggestive of the sudden formation of Si-III/Si-XII during unloading.[Reference Domnich and Gogotsi2] Indeed, a pop-out was consistently observed in most indents for a relaxed a-Si matrix. Additionally, no pop-outs are observed in unrelaxed a-Si. On the other hand, the room temperature (25 °C) data for c-Si showed an elbow in the unloading segment, which indicates an a-Si end phase.[Reference Haberl, Bradby, Ruffell, Williams and Munroe4] For the unloading rate used in this case, the probability of a pop-out during unloading at room temperature is low (<10%),[Reference Ruffell, Bradby, Williams, Munoz-Paniagua, Tadayyon, Coatsworth and Norton10] and therefore most room temperature indents into c-Si result in an a-Si end phase in the residual indent volume. However, at 200 °C, the unloading curves of indentations made in c-Si are starkly different from what is observed at room temperature. (This behavior is observed for temperatures above ~125 °C.) As soon as unloading begins, a significant increase in volume of material beneath the tip is observed, with the tip penetration much decreased for a small decrease in load [Fig. 2(b)]. Note that five load–unload curves in c-Si at 200 °C are shown to illustrate the reproducibility of the “bowing” phenomena. This “bowing” observation will be discussed below. It can also be noted that the residual depths of the indents made in relaxed a-Si are similar for both temperatures (consistent with Si-III/Si-XII end phases) and are greater than those made in c-Si. In unrelaxed a-Si, the load–unload curve does not indicate any phase transformations at either 25 or 200 °C and the material appears to deform plastically, leading to the largest penetration depths on complete unloading. In c-Si, the residual penetration depths are smallest at both temperatures, an observation that is consistent with an a-Si end phase at 25 °C and, as we show below, a Si-I end phase at 200 °C. The depths of the final indent impressions were measured using the standard in situ scanning probe technique incorporated into the Hysitron TriboIndenter. The depth was found to be consistent with the final depth indicated by the load–unload curves.
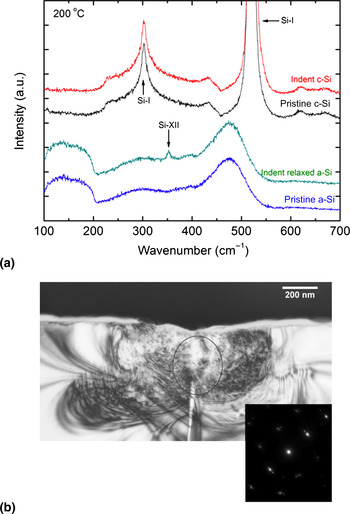
The associated Raman spectra for the indents at 200 °C in c-Si and relaxed a-Si are shown in Fig. 3(a). In c-Si, the end phase appears to be predominantly Si-I. On the other hand, indents in relaxed a-Si contain the high-pressure phase of Si-XII, as indicated by the extra peak at 350 cm−1. The low intensity of this peak is due to the Raman instrument, which has low detection sensitivity such that small volumes of high-pressure phases are difficult to detect. The bright-field XTEM micrograph of the indent at 175 °C in c-Si is shown in Fig. 3(b). A slightly lower temperature was chosen for examination by XTEM as it is known that the high-pressure phases Si-XII and Si-III are stable for only ~50 min at 200 °C but for over 100 min at 175 °C.[Reference Ruffell, Haberl, Koenig, Bradby and Williams13] The figure shows the morphology and microstructure of the transformation zone after indentation experiments, and the corresponding SAD pattern shows only Si-I spots (and associated streaking), suggesting transformation from Si-II to a Si-I end phase on unloading. No additional spots from either Si-III or Si-XII in the region directly under the residual indent impression are observed. Note that the SAD pattern indicates substantial alignment of Si-I in the transformed region with the underlying c-Si substrate. A noticeable median crack can also be seen in the figure, which could be due to large shear stresses.
(a) Raman spectra of indents at 200 °C in c-Si and a-Si compared with pristine (unindented) spectra. (b) XTEM image and the corresponding SAD pattern (taken from the circled region) of a c-Si indent at 175 °C.

Under indentation, it is well known that Si-I transforms into Si-II upon loading and that Si-II becomes unstable during pressure release and transforms to either a-Si or a mixture of Si-III/Si-XII.[Reference Domnich and Gogotsi2] The formation of Si-III/Si-XII is thought to proceed through a nucleation and growth mechanism, and the current authors found previously that, in general, the nucleation of these high-pressure phases is enhanced with increasing temperature.[Reference Bradby, Williams, Wong-Leung, Swain and Munroe14] However, for the case of c-Si, the Si-I end phase that occurs at temperatures above 125 °C suggests that either Si-III/Si-XII phases are unstable at elevated temperature in a c-Si matrix or Si-II transforms directly to Si-I. The behavior in relaxed a-Si at 200 °C is entirely different, where the end phase is always Si-III/Si-XII, which suggests that these high-pressure phases are relatively stable at temperatures up to 200 °C when formed in an a-Si matrix.
To assist in understanding the c-Si behavior at temperatures between 175 and 200 °C, we note that the Si-II phase, which is formed at around 11 GPa, is stable at room temperature down to around 8 GPa.[Reference Domnich, Gogotsi and Dub3] Unloading to below 8 GPa is required before Si-II transforms to either a-Si or Si-III/Si-XII. However, in the current study, a phase transformation is clearly occurring at 200 °C even at the onset of unloading in c-Si, as shown in Fig. 2, whereby Si-II is transforming to a significantly less dense phase immediately on unloading. This may suggest a direct phase transformation from Si-II to Si-I during the entire unloading cycle since (i) the end phase is Si-I and the continuity of the unload curve suggests a single phase transformation, and (ii) the onset appears to occur immediately on unloading, suggesting that Si-II is unstable at 200 °C even at pressures above 8 GPa. It is interesting to ask why this c-Si behavior is so different from that in a-Si. We propose the following explanation. In c-Si, Si-II is in contact with the surrounding c-Si matrix, and it may be that, at 175–200 °C, it is energetically favorable for the unstable Si-II to directly transform to c-Si (Si-I) at nucleation sites on the underlying crystal. The largely aligned Si-I crystallites in the indented zone [see Fig. 3(b)] are consistent with such a direct transformation from Si-II: Si-I nucleating from the underlying substrate and propagating to the surface on unloading. Conversely, in an a-Si matrix, there is no seed for direct transformation to Si-I and, as unloading reduces the pressure in Si-II, it is energetically favorable (in the absence of a c-Si-I seed) for a transformation to the high-pressure Si-III/Si-XII phases below 8 GPa. A more detailed study is currently underway to investigate this proposal further.
In conclusion, our high thermal stability indentation study at elevated temperatures has revealed intriguing differences between the transformation pathways in c-Si compared with those in relaxed a-Si. In the former case, an unusual “bowing” was observed in the load–unload curve above about 125 °C as a result of rapid volume expansion of the material under indentation. This behavior is suggested to be a result of a direct Si-II to Si-I transformation, with nucleation occurring from the boundary of the Si-II volume at the underlying c-Si interface and proceeding towards the surface with decreasing load. On the other hand, relaxed a-Si does not undergo such behavior; rather, it transforms suddenly to high-pressure Si-III/Si-XII phases during the unloading cycle similar to room temperature behavior.
Acknowledgments
This work has been funded by the Australian Research Council. JEB is the grateful recipient of an Australian Research Council QEII award. The authors would like to acknowledge the assistance of David Munoz-Paniagua with the hot-stage design.