I. INTRODUCTION
Magnesium-based alloys have attracted considerable interest in the biomedical field primarily due to their dissolution in physiological environment and absorption by the human body, in addition to their good fracture toughness and unique antibacterial properties.Reference Robinson, Griffith, Shechtman, Evans and Conzemius1,Reference Zhang, Hou, Ye, Bin Xu, Bai and Shang2 In the case of bone fractures, the fixation plates made of Ti-based alloys or stainless steels are often left inside the body even after complete healing of the bone. Previous studies have reported on the importance of removing these implants through a second surgery to avoid long-term complications.Reference Zhang, Hou, Ye, Bin Xu, Bai and Shang2 Moreover, the conventional nondegradable alloys exhibit much higher stiffness than that of the human bone leading to stress shielding and associated implant loosening.Reference Seal, Vince and Hodgson3 Therefore, biodegradable materials are currently being proposed in the field of temporary implant applications. In this context, magnesium (Mg) is an attractive choice due to its biological activity, mechanical properties, such as its elastic modulus (E = 40–45 GPa) and density (1.738–2 g/cm3) that are close to that of human bone, and its natural degradation in physiological environments.Reference Wu, Ibrahim and Chu4 In addition, Mg constitutes the cations that are present in the human body and it works as a cofactor for many enzymes.Reference Staiger, Pietak, Huadmai and Dias5 However, several problems such as inadequate strength and rapid degradation (causing subcutaneous gas bubbles) must be solved before Mg can be used as bone implants. To address the strength and corrosion limitations, Mg is generally alloyed with different elements. During Mg alloy development particularly for biomedical applications, care must be exercised to ensure that the alloying elements are nontoxic and are absorbable by the surrounding tissues upon degradation of the alloy. Furthermore, the microstructural uniformity and elimination of high concentration of intermetallic/secondary phases of these new alloys are important to achieve controllable degradation of the alloys in the physiological environment.
It has been reported that alloying elements such as zinc (Zn), calcium (Ca), zirconium (Zr), and rare earth elements (REEs) can effectively improve the mechanical and corrosion properties of Mg.Reference Seal, Vince and Hodgson3 As a result, several binary alloys such as Mg–Ca,Reference Li, Gu, Lou and Zheng6 Mg–Zn,Reference Zhang, Wang, Geng and Pignatello7 Mg–Si,Reference Gao, Chen and Han8 Mg–Zr,Reference Mushahary, Sravanthi, Li, Kumar, Harishankar, Hodgson, Wen and Pande9 and Mg–YReference Peng, Huang, Zhou, Hort and Kainer10 have been developed and investigated, in vitro and in vivo conditions, for biomedical applications. However, these binary alloys were found to have poor yield strength (YS) and too high corrosion rates.Reference Li, Gu, Lou and Zheng6,Reference Peng, Huang, Zhou, Hort and Kainer10 Few Mg alloys, containing Zn and Ca such as Mg–3Zn, Mg–1Zn–1Ca, and Mg–5Ca, have been proposed for biodegradable implant applications.Reference Li, Gu, Lou and Zheng6,Reference Wan, Xiong, Luo, He, Huang and Zhou11 Zr is a powerful grain refiner for Mg alloys combined with its high solubility limit of 3.8 wt% in Mg. It enables significant improvement in mechanical and corrosion properties of these alloys.Reference Yang, Li, Zhang, Lorimer and Robson12 Li et al.Reference Li, Wen, Mushahary, Sravanthi, Harishankar, Pande and Hodgson13 reported that Mg–Zr (1–5 wt%)–Sr (2–5 wt%) alloy exhibits enhanced strength and ductility due to the formation of the Mg17Sr2 intermetallic phase. However this intermetallic phase leads to lower corrosion resistance. The addition of Si to Mg reduced the ductility of Mg–Si alloys due to the formation of a coarse Mg2Si intermetallic.Reference Zhang, Yang, Xu and Chen14 However, the addition of Ca to Mg–Si alloy can refine the intermetallic phase but no improvement in the strength or ductility has been observed.Reference Zhang, Yang, Xu and Chen14,Reference Hu, Wu, Zheng, Gan and Wang15 Among the different binary alloys, the Mg–Zn system is well renowned as the second strongest ductile alloy system in Mg-based alloys.Reference Xu, Yang, Suen, Wu, Li and Chu16,Reference Song and Atrens17 Moreover, mechanical and corrosion properties of various percentages of Zn (ranging from 1 to 6 wt%) in addition to Mg are studied, and it is concluded that the addition of 1 wt% Zn improves the corrosion resistance significantly and further addition of Zn decreases the corrosion resistance. But when calcium is added as a third alloying element to Mg–xZn alloys, Mg–4Zn–0.2Ca shows better corrosion resistance due to the effective transformation of coarse precipitate in Mg–4Zn to fine ternary precipitates in Mg–4Zn–0.2Ca.Reference Zhang, Wang, Geng and Pignatello7 Zhang et al.Reference Zhang, Zhang, Zhao, Li, Song, Xie, Tao, Zhang, He, Jiang and Bian18 studied that Mg–6 (wt%) Zn alloys were for implant applications. In vitro degradation results reported that zinc could elevate the corrosion potential to the nobler side of Mg in simulated body fluid and thereby reduce the degradation rate. In these alloys, Zn is generally used in combination with aluminum (Al) (AZ91, AZ31, AE21, and AZ63), but high concentrations of Al can lead to an excessive release of Al ions that are harmful to the human body.Reference Kannan and Raman19,Reference Ganrot20 As a result, recently, Mg–Zn-REE alloys are being considered as potential alternative alloys for biomedical applications.Reference Dai, Li, Li, Yu, Dai, Hu, Yuan and Wen21 These alloys with small amounts of REE addition typically exhibit high strength and good elongation.Reference Chen, Xu, Smith and Sankar22 The strength and ductility are significantly improved by long period stacking ordered (LPSO) strengthening when Zn or yttrium (Y) is added as a third alloying element.Reference Leng, Zhang, Zhang, Liu, Zhan and Wu23 Various REE (Gd, Dy, Y, Nd) added Mg alloys such as WE43 [4 wt% (Y), 3 wt% (Nd, Ce, Dy)], Mg–Y (4 wt%), Mg–Gd (5 wt%), and LAE442 [2 wt% (Ce, La, Nd, Pr)] have been studied in terms of their degradability, mechanical properties, and cytotoxicity.Reference Witte, Kaese, Haferkamp, Switzer, Meyer-Lindenberg, Wirth and Windhagen24 Among them, the WE43 alloy is extensively investigated as a result of its excellent mechanical properties (∼195 MPa) and corrosion resistance.Reference Feyerabend, Fischer, Holtz, Witte, Willumeit, Drücker, Vogt and Hort25 Recently, another new alloy Mg–Nd–Zn–Zr has been reported to outperform WE43 in terms of mechanical properties and corrosion resistance.Reference Mao, Yuan, Wang, Niu, Wu and Ding26 In addition to bone implants, these Mg-REE alloys are also being investigated for cardiovascular applications.Reference Witte and Eliezer27 However, the biosafety of REE is still under evaluation. Feyerabend et al.Reference Feyerabend, Fischer, Holtz, Witte, Willumeit, Drücker, Vogt and Hort25,Reference Baboian and Dean28 studied the short-term effect of REE [gadolinium (Gd), dysprosium (Dy), neodymium (Nd), yttrium (Y), lanthanum (La), cerium (Ce)] added Mg alloys on primary human cells. They reported that Gd and Dy have a relatively lower inflammatory reaction than Y.
To date, systematic studies on the effect of REE addition on mechanical, corrosion, and biological properties of Mg–Zn alloys appear to be very limited. It is understandable that for effective strengthening while reducing the detrimental effect of secondary phases on corrosion, the selected REE must have good solid solubility in Mg. Based on the solubility of REE in Mg and also the reported results of their biocompatibility, we have selected Gd (solubility of 23.49 wt%Reference Yang, Wang, Wang and Zhang29 in Mg), Dy (solubility of 25.3 wt% in Mg),Reference Bi, Li, Zang, Zhang, Ma and Hao30 and Nd (solubility of 3.6 wt% in Mg) as potential alloying additions to the Mg–Zn system. In the present study, we investigated the individual effects of Gd (2 wt%), Dy (2 wt%), and Nd (2 wt%) additions to the Mg–Zn (1, 3 wt%) alloy on its microstructure, mechanical properties, in vitro corrosion, and cytotoxicity. A small amount of Zr (0.7 wt%) is added for grain refinement.
II. MATERIALS AND METHODS
A. Alloy preparation
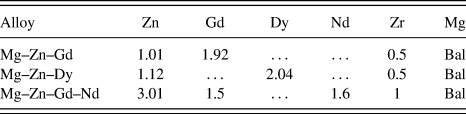
The rare earth alloying elements (99.9 wt% purity) namely Dy, Gd, and Nd were procured from Metal Industries, Mumbai, India. Three alloys namely Mg–Zn–Gd, Mg–Zn–Dy, and Mg–Zn–Gd–Nd were prepared in a mild steel crucible under a protective atmosphere (Ar + 2% SF6). Mg and Zn melts were prepared and pure Gd, Dy, or Nd were added to the melt at 750 °C to the compositions shown in Table I. In addition to the REE, 0.7 wt% of Zr was also added to the molten alloy as a grain refiner. After holding for 20 min, the melt was stirred for 20 min for compositional uniformity/homogenization followed by pouring into a preheated (250 °C) cast iron mold (200 × 110 × 20 mm). The composition of the cast alloys was determined using inductively coupled plasma atomic emission spectroscopy (ICP-AES: IRIS INTREPID II XSP DUO, Thermo Electron, Waltham, Massachusetts).
Chemical composition (wt%) of the as-cast Mg alloys.

B. Microstructures and mechanical properties
Small sections of the alloys were extracted from the cast ingots and were polished using a series of silicon carbide (SiC) papers up to 2000 grit followed by fine polishing on velvet cloth using superfine diamond paste (0.25 µm). The polished samples were etched with a solution of 97 mL alcohol and 3 mL HNO3. The microstructures and local composition of the alloys were analyzed using an optical microscope and a scanning electron microscope (SEM) equipped with an energy-dispersive X-ray spectrometer (EDX) (SEM: JSM-6380LA, JEOL USA Ltd., Peabody, Massachusetts). TEM examination was carried out using a JEM-2100, JEOL model operating at 200 kV, equipped with an energy-dispersive spectrometer. For the TEM analysis, the samples were initially prepared in the form of a coupon (thin slice of 1 mm) using a slow speed precision cutting machine. The samples were then subjected to mechanical thinning from base metal plate side till the thickness reached 100 μm. Furthermore, 3 mm discs were punched and dimpled to a thickness of about 4 μm at the center. The samples were then thinned to electron transparency by the ion milling technique using a GATAN (PIPS) ion milling machine (PIPS System, GATAN, Pleasanton, California). Milling was carried out using an accelerating voltage of 5 kV and 5° gun angle. The alloys were also analyzed using an X-ray diffractometer (XRD: DX-GE-2P, JEOL, Tokyo, Japan) with Cu Kα (λ = 1.54 Å) radiation and with a 2θ range of 0°–110°.
The tensile strength of the alloys was determined using a 20 kN tensile test machine (Electronic Tensometer: PC-2000, Kudale Instruments (P) Ltd., Pune, India) at room temperature. The test specimens of 30 mm gauge length and 6 mm diameter were machined according to the ASTM-E8/E8M standard. At least three samples from each alloy were tested and average properties are reported. The fracture surfaces of the tensile test samples were examined using SEM to understand the fracture behavior of the alloys.
C. In vitro degradation
The in vitro corrosion rates of the developed alloys were determined using immersion and electrochemical methods.Reference Atrens, Song, Liu, Shi, Cao and Dargusch31 Shi et al.Reference Shi, Liu and Atrens32 reported that immersion studies can be used to understand the corrosion in Mg alloys in three different ways: (i) rate of weight loss, (ii) rate of hydrogen evolution, and (iii) Mg2+ ion release. For the immersion study, a standard inverted funnel and burette set-up as proposed by Song et al.Reference Song, Atrens, StJohn and Hryn33 was used. The exposed surfaces of the alloys were fine polished and cleaned by ultrasonicating in ethanol. The initial weight of the sample was recorded by using a high-precision (0.0001) digital balance. The polished samples were encapsulated in resin with the polished surface (1 cm2) exposed to the solution and kept in a static condition. A solution of 300 mL of Hanks balanced salt solution (HBSS: HIMEDIA Labs, Bangalore, India) (HIMEDIA) with an initial pH of 7.4 was used as the electrolyte. The immersion tests lasted for 180 h.
The hydrogen evolution was suitably measured by reading the test solution level in the burette every 12 h by using the standard inverted funnel and burette arrangement.Reference Song, Atrens, StJohn and Hryn33 During the corrosion of the sample, each mole of Mg (24.306 gm) liberates one mole of hydrogen (22.4 L). Therefore, in long-term immersion corrosion tests, the hydrogen emission during magnesium corrosion gives direct and real time corrosion rates at any instant of immersion. The average corrosion rate through the hydrogen evolution was estimated by the following relationReference Shi, Liu and Atrens32,Reference Zainal Abidin, Rolfe, Owen, Malisano, Martin, Hofstetter, Uggowitzer and Atrens34,Reference Atrens, Liu and Zainal Abidin35 :
 $${P_{\rm{w}}} = 3.65{{\Delta W} / \rho }\quad ,$$
where P w is the average corrosion rate in mm/year, ∆W is the weight loss rate of the sample in mg/cm2 day, and ρ is the density of the alloy (1.768 g/cm3).
The hydrogen emission rate V H [mL/(cm2 day)] is related to ∆W [mg/(cm2 day)] using the following relation:
 $$\Delta W = 1.085\;{V_{\rm{H}}}\quad .$$
Corrosion rate (mm/year) was calculated by substitution of W obtained from Eq. (2) in Eq. (1).
During the immersion period, 10 mL of HBSS was collected every 12 h and the amount of Mg2+ ions released from the alloy were determined using atomic absorption spectroscopy (AAS: 932 Plus, GBC Scientific Equipment Ltd., Braeside, Victoria, Australia). The temperature and the pH of the solution are also recorded every 12 h using a digital thermometer with a resolution of 0.1 °C and a pH meter (μC–pH system 361, Ahmedabad, India) with a resolution of 0.01 pH.
After the immersion test, the samples were removed from the solution and cleaned with a solution, containing 200 g/L chromic acid and 10 g/L silver nitrate, to remove the surface degradation products. The samples were rinsed with distilled water then ethanol and finally dried in warm flowing air. The dried samples were weighed and the degradation rate was calculated using the following relation, according to ASTM-G31-72Reference Atrens, Song, Cao, Shi and Bowen36,Reference Cor37 :
 $${\rm{CR}} = {{K \cdot W} \over {D \cdot A \cdot T}}\quad ,$$
where CR is the corrosion rate in mm/year (mmpy), K is a constant (8.76 × 10⁴ in millimeter per year), W is the difference between the initial and the final mass of the sample, A is the exposed area in cm2, D is the density of the material in g/cm3, and T is the immersion time in hours. The surface morphology of the immersed specimen was examined using SEM and the composition of the degradation products was analyzed using EDX and XRD.
Metallographically polished samples were used for standard electrochemical corrosion studies at room temperature. Electrochemical measurements were performed using an electrochemical workstation (SP-150, EC Lab-Biologic, Claix, France). The construction has a three electrode test setup where a saturated calomel electrode (SCE) is used as the reference electrode, a platinum wire is used as the counter electrode, and the test sample is the working electrode. An area of 1 cm2 of the test sample was exposed to freshly prepared HBSS. The open circuit potential (OCP) of the cell was obtained after allowing the cell to stabilize for 1 h. The polarization tests were conducted between 100 mV below the OCP and 100 mV above the OCP at a scan rate of 0.5 mV/s. The polarization experiments lasted for 15 min and it is repeated three times for each alloy. The corrosion current density (i corr) of the alloy was determined from Tafel extrapolation, which was used to estimate the corrosion rate of the alloy as follows:
 $${\rm{CR}} = {{K1 \cdot {i_{{\rm{corr}}}} \cdot {\rm{EW}}} \over \rho }\quad ,$$
where i corr is the corrosion current density in µA/cm2, EW is the equivalent weight of metal being tested, and ρ is the density of the alloy in g/cm3. The constant K1 is of 3.27 × 10⁻³ mm g (µA)−1 cm−1 year−1.
D. In vitro cell–materials interactions
A mouse embryo fibroblast cell line (NIH 3T3) was used to evaluate the cytotoxicity and cell–materials interactions of developed Mg alloys for culture durations of 1, 3, and 5 days. Calorimetric assay, namely, the MTT [3-(4, 5-dimethylthiazol-2-yl)-2, 5-diphenyl tetrazolium bromide] assay, was carried out to quantitatively understand the cell viability of these alloys. Before culture, the samples were cleaned and sterilized at 121 °C for 20 min in an autoclave (15 psi). The sterilized samples were then placed in a 24-well plate and seeded with NIH 3T3 cells (1 × 10⁴ cells/well). The cell culture media (DMEM, Dulbecco’s modification of Eagle’s Medium) was supplemented with 10% v/v fetal bovine serum and the well plates were incubated at 37 °C and 5% CO2 in an incubator. After each culture period, the MTT assay was performed following an established procedure.Reference Das, Bhattacharya, Dittrick, Mandal, Krishna, Kumar and Bandyopadhyay38 SEM analysis followed to determine how the cells adhere and proliferate on the different sample surfaces.
III. RESULTS AND DISCUSSION
A. Microstructural and phase analysis
The as-cast alloys were initially checked for elemental composition using ICP-AES and the results are presented in Table I. It appears that a small wt% loss in the alloying elements during casting.
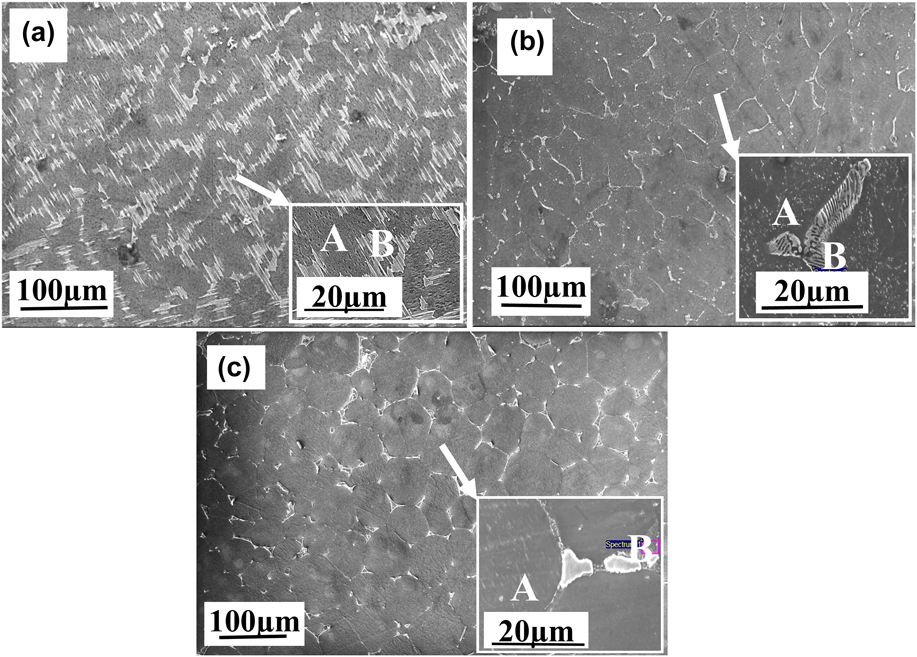
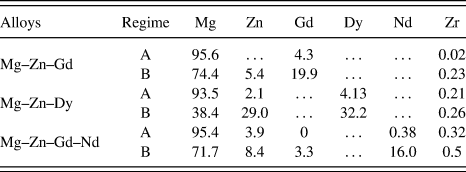
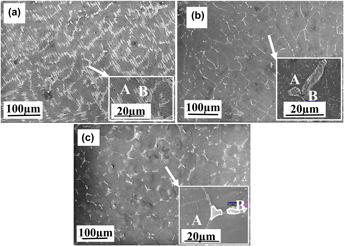
The SEM micrographs of the as-cast alloys presented in Fig. 1 reveal α-Mg grains as the major phase with eutectic structures distributed along the grain boundaries. The addition of REE (Gd, Dy, and Nd) and Zr changes the eutectic phase morphology to small-sized particles and small network-like structure, which are distributed along the grain boundaries.Reference Srinivasan, Huang, Mendis, Blawert, Kainer and Hort39,Reference Zhang, Zhang, Bian, Cheng, Niu, Xu and Wu40 To identify the morphology and composition of the secondary phases at the grain boundary, the microstructures of these alloys were observed by using SEM. Micrographs of these alloys obtained using SEM are shown in Fig. 1. The Mg–Zn–Gd alloy [Fig. 1(a)] consists of the α-Mg phase, the MgZn2 intermetallic phase, and a fine lamellar/acicular structure, known as LPSO,Reference Zheng, Liu, Wan, Yang and Shu41 that has grown towards the grain interior.Reference Morishita, Yamamoto, Shikada, Kusumoto and Matsumoto42 The inset of Fig. 1(a), and Fig. S1(b) show a magnified view of such a LPSO phase structure. This phase with similar morphology was reported as (Mg, Zn)3 Gd [Fig. S1(a)] in the Mg–Zn–Gd alloy.Reference Yamasaki, Sasaki, Nishijima, Hiraga and Kawamura43 This eutectic phase with a similar morphology has been reported as a LPSO phase, which forms a quasi-continuous honeycomb-like network phase at the matrix grain boundaries of Mg–Zn–Y or lamellar phase in Mg–Zn–Gd alloys.Reference Xu, Han and Xu44,Reference Li, Xu, Zeng, Wang, Sheng, Chen and Han45 However in our case, there is no peak, i.e., related to the Gd-rich LPSO phase in XRD spectra, presumably due to its low concentration. The summary of the EDX analysis of the different phases of these alloys is presented in Table II. The primary phase, marked as A in Fig. 1(a), is rich in Mg (95.6 wt%) with a small amount of dissolved Gd (4.33 wt%). The grain boundary secondary phase, marked B (LPSO phase), reveals a high concentration of Gd up to 19.9 wt% with a small amount of Zn (5.4 wt%). A similar composition range has been reported by Zhang et al.Reference Zhang, Zhang, Bian, Cheng, Niu, Xu and Wu40 for the LPSO phase in this alloy.
SEM microstructures of Mg–Zn-REE alloys showing morphology of α-Mg grains and secondary phases (a) Mg–Zn–Gd, (b) Mg–Zn–Dy, and (c) Mg–Zn–Gd–Nd.

EDX compositional analysis (wt%) of different phases observed in the Mg–Zn-REE alloys (Fig. 1).

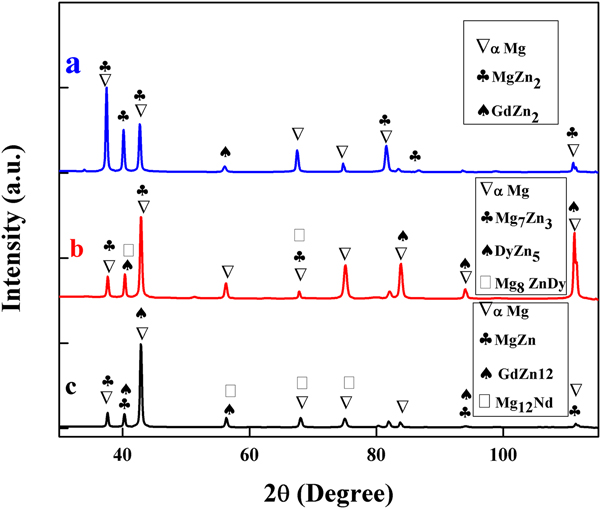
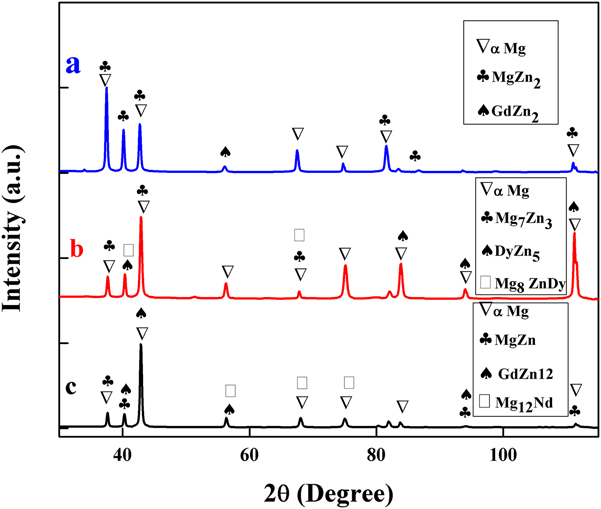
The Mg–Zn–Dy alloy exhibits a two-phase microstructure [Fig. 1(b)] consisting of α-Mg grains with a majority of isolated or island-like compounds along the grain triple points. These island-like structures contain Mg–Zn intermetallic compound and a eutectic phase. This intermetallic phase has been reported as Mg8ZnDy.Reference Zhang, Xin, Nie, Cheng, Wang and Xu46 The analysis of the secondary eutectic phase at higher magnification [the inset of Fig. 1(b)] reveals a lamellar structure that forms a semicontinuous network structure within α-Mg. The XRD analysis [Fig. 2(b)] confirms the major intermetallic phase in the Mg–Zn–Dy alloy is Mg7Zn3 as in Ref. Reference Peng, Wang and Wu47. The compositional analysis shows that the eutectic compound [labeled B in Fig. 1(b)] is rich with Dy (32.2 wt%) and Zn (29 wt%) compared to their concentration in the Mg matrix which revealed 93.5 (wt%) Mg, 4.1 (wt%) Dy, and 2.1 (wt%) Zn. The compositional analysis also indicates a good amount of dissolved alloying elements in the Mg matrix, which can potentially improve mechanical properties of the alloy via solid solution strengthening.
X-ray diffraction analysis of different phases in the (a) Mg–Zn–Gd, (b) Mg–Zn–Dy, and (c) Mg–Zn–Gd–Nd alloys.
The microstructure of the Mg–Zn–Gd–Nd alloy is shown in Fig. 1(c), which is very close to the microstructure of the Mg–Zn–Dy alloy. However, the Mg–Zn–Gd–Nd alloy exhibits a secondary eutectic phase along the grain boundary and grain triple points. The secondary phase has been identified as Mg12Nd, through XRD.Reference Ding, Chung, Chiu and Lyon48 It is observed from the EDX analysis (Table II) that these phases [labeled B in Fig. 1(c)] are enriched with up to 16 wt% Nd with a small amount of Gd (3.3 wt%). The primary phase of α-Mg constituted 95.4 wt% of Mg. Overall, the formation of secondary phases along the grain boundaries in the present alloys indicates that they are formed in the later stages of solidification due to the rejection of alloying elements from the solidifying matrix as a result of their decreased solubility with decreasing the temperature.
Figure 2 shows the XRD patterns of the as-cast alloys; all three alloys exhibit α-Mg as the major phase. However, depending on the type of REE addition, the alloys showed peaks corresponding to different secondary phases such as Mg–Zn, MgZnDy, and MgNd. The Mg–Zn–Gd alloy [Fig. 2(a)] shows two distinct peaks corresponding to MgZn2Reference Gao and Nie49 and GdZn2. The alloy with Dy [Fig. 2(b)] presents Mg7Zn3, DyZn5, and Mg8ZnDy phases. The EDX composition analysis of these phases matches with earlier reports.Reference Zhang, Xin, Nie, Cheng, Wang and Xu46 The Mg–Zn–Gd–Nd [Fig. 2(c)] spectra reveal the presence of Mg12Nd and MgZn phases.Reference Zhang, Yuan, Niu, Fu and Ding50
B. In vitro degradation
1. Degradation during immersion studies
It is well known that Mg alloys interact with HBSS and produce magnesium hydroxide, Mg2+ ion, and hydrogen gas as per the following reactionsReference Yang and Zhang51:
 $${\rm{Mg}} \to {\rm{M}}{{\rm{g}}^{2 + }} + 2{{\rm{e}}^ - }\;\left( {{\rm{anodic}}\;{\rm{reaction}}} \right)\quad ,$$
 $$2{{\rm{H}}_2}{\rm{O}} + 2{{\rm{e}}^ - } \to {{\rm{H}}_2} + 2{\left( {{\rm{OH}}} \right)^ - }\;\left( {{\rm{cathodic}}\;{\rm{reaction}}} \right)\quad ,$$
 $${\rm{M}}{{\rm{g}}^{2 + }} + 2{\left( {{\rm{OH}}} \right)^ - } \to {\rm{Mg}}{\left( {{\rm{OH}}} \right)_2}\;\left( {{\rm{total}}\;{\rm{reaction}}} \right)\quad .$$
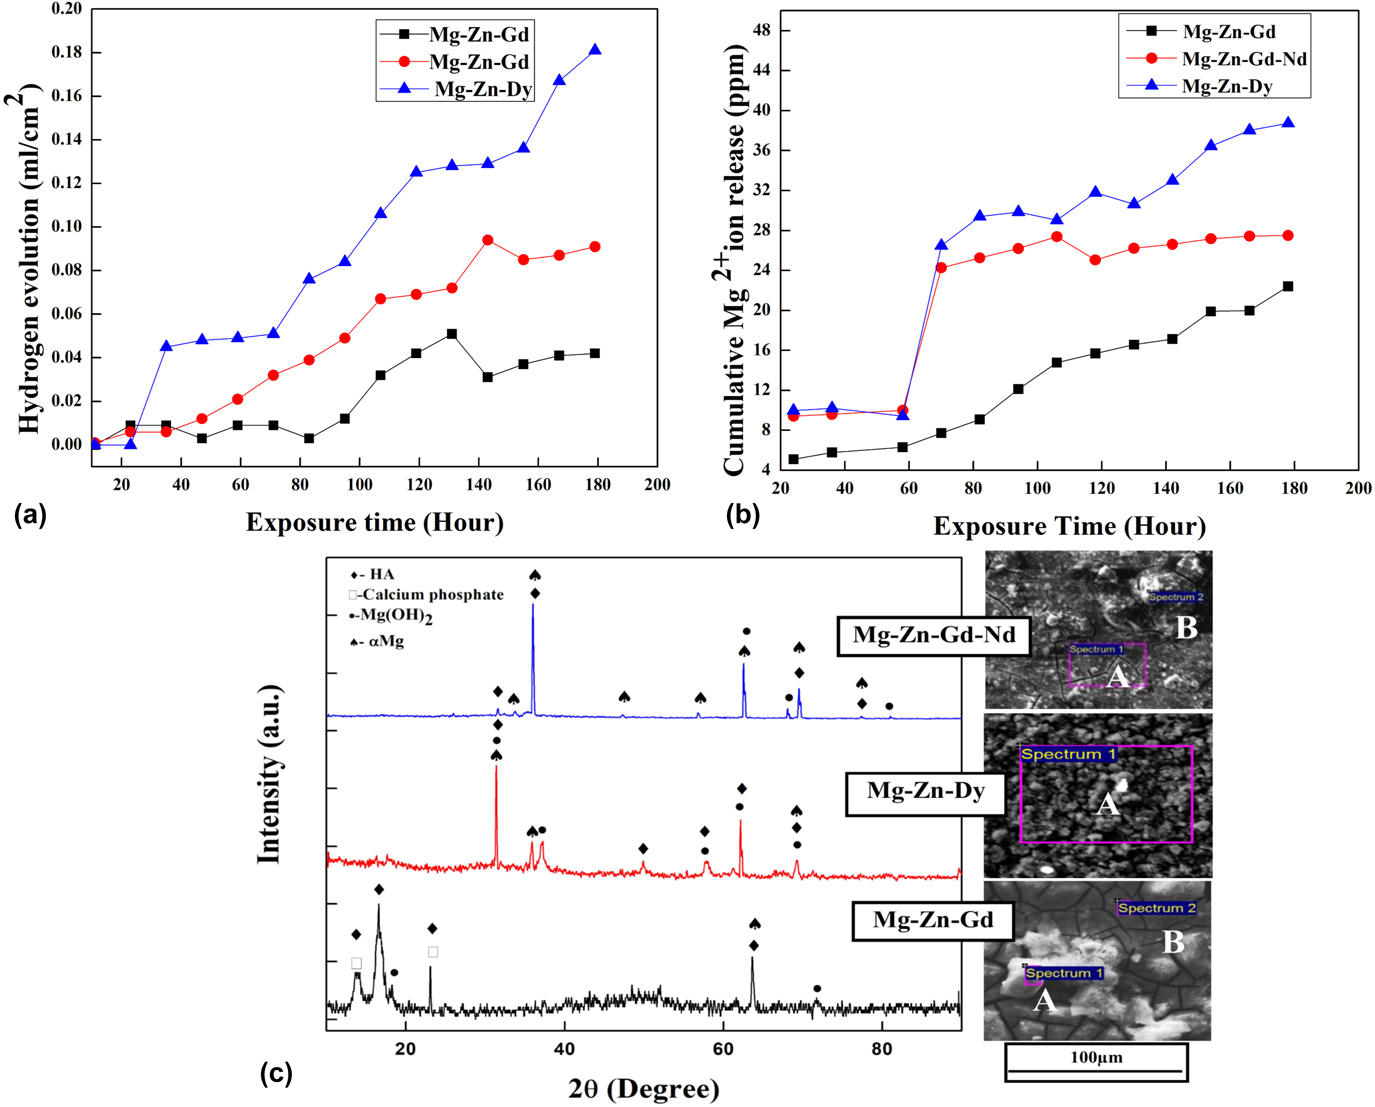
The measurement of hydrogen and Mg2+ ion release thus provides a good understanding of the overall degradation kinetics of these alloys.Reference Zhao, Liu, Song and Atrens52 The volume of hydrogen produced by the present Mg alloys during immersion in HBBS is presented in Fig. 3(a). During the initial period of immersion up to 24 h, the rate of hydrogen evolution appears to be small in all three alloys. The hydrogen production rates were observed to vary between 0.84 mL/cm2, 0.37 mL/cm2, and 0.29 mL/cm2 for Mg–Zn–Dy, Mg–Zn–Gd–Nd, and Mg–Zn–Gd, respectively. As the immersion period increases, the corrosion rate also increases gradually. After about 35 h, the Mg–Zn–Dy alloy degraded rapidly as evidenced by its high rate of hydrogen emission (0.84 mL/cm2) higher than the other two alloys, which exhibit hydrogen emission at 0.37 and 0.29 mL/cm2, respectively. Moreover, the volume of hydrogen emitted by Mg–Zn–Gd and Mg–Zn–Gd–Nd alloys was significantly lower than that of the Mg–Zn–Dy alloy at all time periods of immersion tests, suggesting a relatively poor in vitro corrosion resistance. Moreover, the rate of increase in the hydrogen evolution rate [slope of hydrogen production versus time in Fig. 3(a)] of Mg–Zn–Dy was also higher than for the other two alloys indicating its high corrosion rate possibly due to an unstable passive film on its surfaces. The final corrosion rates calculated by the hydrogen emission are presented in the Table III. Among all alloys, the Mg–Zn–Gd alloy exhibits the lowest hydrogen evolution, indicating a superior corrosion resistance. Interestingly, the hydrogen emission of this alloy was very stable up to ∼85 h of immersion, followed by a gradual increase with immersion time.
(a) The rate of hydrogen evolution, (b) amount of Mg2+ released during immersion tests of Mg–Zn-REE alloys as a function of immersion time in HBSS, and (c) XRD analysis and SEM surface morphology of alloy samples after 180 h of immersion.

Electrochemical properties and corrosion rate of Mg–Zn-REE alloys derived from Tafel extrapolation and weight loss measurements.

The amount of Mg2+ ions released from different alloys, after 180 h of immersion in HBSS, is shown in Fig. 3(b). As expected and in line with the hydrogen evolution, the amount of Mg2+ ions released from these alloys also increases with the immersion time. Among all alloys studied, the Mg–Zn–Gd alloy shows a gradual increase in the Mg2+ ion release, while the other two alloys reveal a sharp increase in the release at about 70 h of immersion. The maximum concentration of Mg2+ in the HBSS was determined to be 13.3 ppm for Mg–Zn–Gd alloy which is almost 71% lower than that of Mg–Zn–Gd–Nd (22.8 ppm) alloy and 103% lower than that of the Mg–Zn–Dy (27.1 ppm) alloy. The abrupt increase in the Mg2+ ion release, between 60 and 70 h, of Mg–Zn–Dy and Mg–Zn–Gd–Nd alloys is not clearly understood, yet but we presume that the local disturbance in the surface passive film of these alloys could be one of the reasons. Another potential reason could be the size, shape, and composition of the secondary phases formed in these alloys. The corrosion rate calculated by Mg2+ ion release was also found and is represented in Table III. The maximum corrosion rate was observed for Mg–Zn–Dy and the lower corrosion rate was observed for Mg–Zn–Gd. The secondary phases distributed along the grain boundaries in Mg–Zn–Dy and Mg–Zn–Gd–Nd can form a galvanic couple with the Mg matrix and would accelerate the corrosion of the α-Mg matrix.Reference Srinivasan, Huang, Mendis, Blawert, Kainer and Hort39 The galvanic corrosion mainly happened by the potential difference between the α-Mg phase and secondary phase which is formed in the Mg matrix. Song.et al.Reference Song and Atrens53 studied the AZ31 alloy and reported that the secondary phase (Mg17Al12) formed in the alloy could either act as a corrosion behavior or galvanic cathode accelerating the corrosion. Which factor determines the role of the corrosion process mainly influenced by the volume fraction and distribution of the secondary phases? The continuous and fine distributed phase helps to act as a corrosion barrier, and the discontinuous coarse phase accelerates the corrosion.Reference Bi, Li, Zang, Zhang, Ma and Hao30 In the present study, Mg–Zn–Gd alloy, the isolated LPSO [Figs. 1(a) and S1(b)], and (Mg, Zn)3 Gd phases [Fig. S1(a)] present at the grain boundaries are more continuous and uniformly distributed,Reference Zhang, Wu, Xue, Wang and Yang54 and these secondary phases act as a corrosion barrier. The better fraction of anode to cathode ratio should reduce the galvanic effect severity and lead to better corrosion resistance.Reference Srinivasan, Huang, Mendis, Blawert, Kainer and Hort39 Therefore, the large size and grain boundary precipitation of secondary phases in Mg–Zn–Dy and Mg–Zn–Gd–Nd could be responsible for their higher corrosion rate. Besides, Mg–Zn–Gd has decreased corrosion resistance as more coarse secondary phases are present at the grain boundaries [Fig. 1(a)]. The type of secondary phase morphologies observed here are also different from other two alloy systems. The presence of the (Mg, Zn)3Gd phase with less volume at inderdendritic and grain boundaries will hinder the corrosion.Reference Srinivasan, Huang, Mendis, Blawert, Kainer and Hort39 In addition, the presence of LPSO also influences the corrosion process. The sharp increase in the Mg2+ ion release of other two alloys made it difficult to compare the corrosion resistance of the three alloys. For example, after 70 h immersion, the rate of ion release (slope of ion release versus time curves) appears to be low for the Mg–Zn–Gd–Nd alloy compared to other two alloys. The estimated rate of Mg ion release, after 70 h immersion, from Mg–Zn–Dy, Mg–Zn–Gd–Nd, and Mg–Zn–Gd alloys were found to be 0.11 ppm/h, 0.04 ppm/h, and 0.12 ppm/h, respectively. These data indicate that by 130 h of immersion in HBSS, the Mg–Zn–Gd alloy can release more Mg2+ ions than the Mg–Zn–Gd–Nd alloy, suggesting a relatively poor long-term corrosion resistance relative to the Mg–Zn–Gd–Nd alloy. The corrosion rate of these Mg–Zn-REE alloys was calculated using Eq. (3). The corrosion rates by weight loss measurements as well as hydrogen emission are presented in Table III. The lowest corrosion rate of 0.99 ± 0.45 mmpy is observed with the Mg–Zn–Gd alloy, and the highest corrosion rate is exhibited by the Mg–Zn–Dy alloy (2.13 ± 0.35 mmpy) by the weight loss method. The Mg–Zn–Gd–Nd alloy presents medium corrosion rates. Cai et al. reported that the average corrosion rate of as-cast Mg–1% Zn was ∼2 mmpy,Reference Cai, Lei, Li and Feng55 which is almost twice the corrosion rate of the present Mg–Zn–Gd alloy and significantly higher than that of Mg–Zn–Gd–Nd alloy. Same corrosion rate trend can be observed through hydrogen emission measurement also. Overall, the corrosion rates estimated using the weight loss method corroborate the hydrogen evolution and Mg2+ ion release trends observed with these alloys.
The severity of the corrosion damage and the corrosion products formed on the Mg–Zn-REE alloy surfaces after immersion tests were examined by SEM and XRD. The surface morphology of the alloy and XRD analysis of the surface product after 180 h of immersion in HBSS is shown in Fig. 3(c). The degraded surfaces of Mg–Zn–Gd and Mg–Zn–Gd–Nd reveal features that are different from those formed on Mg–Zn–Dy alloys. The first two alloys present a compact continuous film covering the entire sample surface with bright precipitates. The formation of a continuous compact film on the surface of these alloys provides a protection against further degradation of the surface in HBSS. In effect Mg–Zn–Gd and Mg–Zn–Gd–Nd alloys exhibit relatively better corrosion resistance than the Mg–Zn–Dy alloy. On the other hand, the surface morphology of the Mg–Zn–Dy alloy lacks the presence of a continuous surface film and presents a large number of discrete precipitates, which relate to the release of large amount of Mg(OH)2. The volume changes associated with the formation of porous Mg(OH)2 would have destabilized the surface film, leading to a poor corrosion resistance.
The EDX analysis was carried out at different regions for all the immersed samples. The white particles on the surface [Fig. 3(c)] of Mg–Zn–Gd [Spectrum 1 labelled as (A)], Mg–Zn–Dy [Spectrum 1 labelled as (A)], and Mg–Zn–Gd–Nd [Spectrum 2 labelled as (B)] consisted of O, Ca, P, and Mg. The compact film formed on the alloy surface [Spectrum 2, labelled as (B)] in Mg–Zn–Gd and spectrum 1 labelled as (A) in Mg–Zn–Gd–Nd appears to prevent further degradation of these two alloys. This film contains Mg(OH)2 with small amounts of Ca and P. The Mg to O and Ca to P ratio of the corrosion products on Mg alloys can be used to assess the formation of Mg(OH)2 and calcium phosphate on the surface of the alloy.Reference Zander and Zumdick56 These products have mainly formed because of the interaction between Mg ions with the carbonate, phosphate, and calcium ions which are contained in the HBSS.Reference Atrens, Liu and Zainal Abidin35 The EDX data indicate that the Mg to O ratio is 0.74, 0.68, and 0.11 for Mg–Zn–Gd, Mg–Zn–Gd–Nd, and Mg–Zn–Dy alloys, respectively, which indicates the formation of Mg(OH)2 on the first two alloys as the ratio is more than 0.5.Reference Zander and Zumdick56 Corresponding Mg(OH)2 peaks are observed in the XRD spectra analysisReference Yang and Zhang51 [Fig. 3(c)] at 2θ of 18°, 32°, 38°, and 62° mainly (Reference code 00-044-1482). The Ca to P ratio for Mg–Zn–Gd, Mg–Zn–Dy, and Mg–Zn–Gd–Nd alloys is 1.7, 1.6, and 0.67, respectively. The standard ratio of Ca to P in hydroxyapatite is 1.67,Reference Nge, Sugiyama and Bulone57 which confirms that the white particles at the surface of Mg–Zn–Gd and Mg–Zn–Dy alloy have shown the close presence of hydroxy apatite (HA). The XRD spectra also show the presence of HA (Reference code 01-076-0694), and calcium phosphate (00-009-0348). The formation of Ca and P compounds during immersion in HBSS on the present Mg alloys may assist them in bone bonding.
2. Electrochemical behavior
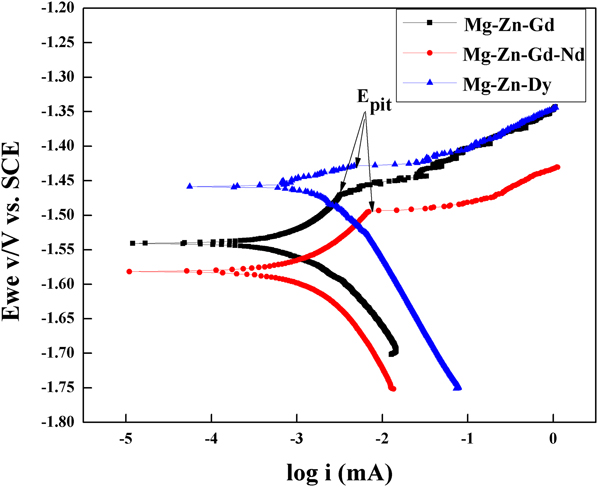
Figure 4 shows the Tafel plots of Mg alloys tested in HBSS at room temperature. The measured electrochemical parameters, corrosion potential (E corr), and corrosion current (i corr) from Tafel extrapolation, and the corrosion rate estimated using Eq. (4) are presented in Table III. The experimental details showed that the i corr was 13.6 µA/cm2 for the Mg–Zn–Gd alloy, 25.1 µA/cm2 for the Mg–Zn–Gd–Nd alloy, and 42.2 µA/cm2 for the Mg–Zn–Dy alloy. These i corr values indicate that the corrosion rate of the alloys would be in the order of Mg–Zn–Gd < Mg–Zn–Gd–Nd < Mg–Zn–Dy. However, the corrosion potential, E corr, of these alloys showed a slightly different trend. The lowest E corr of −1.58 V versus SCE was exhibited by the Mg–Zn–Gd–Nd alloy and the highest potential was observed with Mg–Zn–Dy (−1.45 V versus SCE). The E corr of the Mg–Zn–Gd alloy was measured to be −1.53 V versus SCE. These corrosion potentials suggest that the initiation of corrosion would be difficult in Mg–Zn–Dy alloys compared to the other two alloys studied in this work. The easy initiation of corrosion on Mg–Zn–Gd–Nd and Mg–Zn–Gd alloys can be clearly seen from the relatively high amount of hydrogen emission during the initial 24 h of immersion in HBSS, [Fig. 3(a)]. The absence of hydrogen emission from the Mg–Zn–Dy alloy during the first 24 h of immersion clearly supports the observed high E corr of the alloy during electrochemical testing. Once initiated, the corrosion front appears to propagate rapidly in this alloy, as evidenced by a high i corr and hydrogen emission. The corrosion rates of Mg–Zn–Gd, Mg–Zn–Gd–Nd, and Mg–Zn–Dy alloys estimated using Eq. (4) are 0.04 mmpy, 0.07 mmpy, and 0.12 mmpy, respectively. The trend of the corrosion rates determined from the electrochemical test thus agrees well with the corrosion rates obtained from weight loss measurements. However, the corrosion rates of the alloys estimated following weight loss method were always higher than those obtained from electrochemical tests mainly due to the followingReference Shi, Liu and Atrens32,Reference Song and Atrens53 : measurement of the corrosion rate by the Tafel plot is fundamentally a technique repeating an instantaneous corrosion state. However in the case of magnesium alloys, corrosion is not constant with the time in solution. Typically, corrosion initially starts at localized regions and after a time of immersion, it slowly expands over the whole surface. In this respect, the weight loss measurement averages the corrosion rate over the time of immersion. This mainly shows that Tafel extrapolation tests require stringent evaluation of the corrosion rate when being compared with immersion studies. Also after a certain period of incubation, corrosion typically starts as localized and slowly expands over the surface of the sample. This spreading of corrosion may not happen in the short span of test. Thus evaluation of the corrosion rate by the short term test (Tafel extrapolation) may not agree with the corrosion rate measurement by the long-term test.Reference Shi, Liu and Atrens32 The current density increases sharply as a function of applied potential, above OCP. A sudden change in potential occurs in the anodic branches of all three alloys, which is indicated as E pit (Fig. 4). The absolute value (E pit − E corr) of the passive range of the Mg–Zn–Dy alloy is 0.02 V versus SCE, which is very much less than for the Mg–Zn–Gd (0.08 V versus SCE) and Mg–Zn–Gd–Nd (0.1 V versus SCE) alloys. The higher value indicates that the passivating film formed over Mg–Zn–Gd and Mg–Zn–Gd–Nd is stable for longer time and hence forth any further corrosion is inhibited.
Tafel plots of the Mg–Zn-REE alloys tested in HBSS.

C. In vitro cell–materials interactions
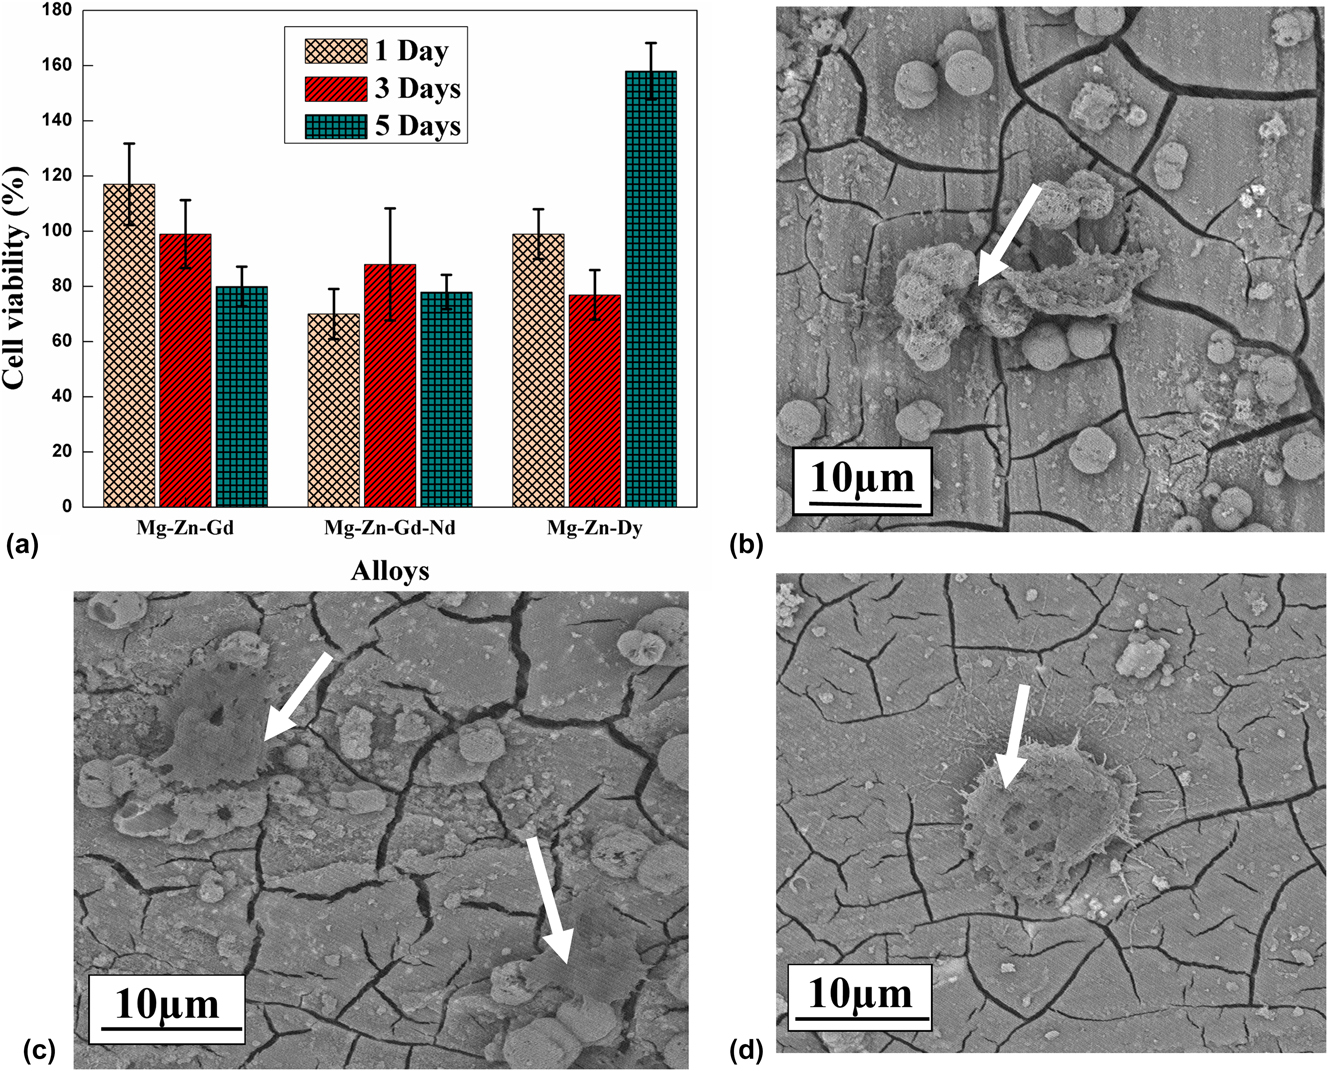
The influence of REE addition on the in vitro cytotoxicity of Mg–Zn-REE alloys was assessed using the MTT assay. Results are presented in Fig. 5(a). They demonstrate that all three alloys are biocompatible and did not induce any toxic effect after 1, 3, and 5 days of culture. Among the three alloy systems, Mg–Zn–Gd showed the highest cell proliferation after 1 and 3 days of culture. After the third day of culture, the cell viability on the alloys decreased slightly except for the Mg–Zn–Dy alloy. In general, the magnitude of cell viability on the three alloys are in the order of 80% (Mg–Zn–Gd–Nd), 80% (Mg–Zn–Gd), and 160% (Mg–Zn–Dy) at day 5. The results also indicate that the viability of cells for the three alloys are greater than 70%, which is considered as good with respect to biocompatibility. Figures 5(b)–5(d) show the morphology of cells cultured on different alloys. The cells were all well spread and flattened across the alloy surface. Also, cells were seen to be connected to neighboring cells and to the substrate. Figure 5(b) presents a uniform cell distribution over the Mg–Zn–Gd alloy (arrow) after the first day of cell culture. After the first day of cell culture, the Mg–Zn–Gd–Nd [Fig. 5(d)] surface shows a dome-shaped cell formation. The cells which are grown on Mg–Zn–Dy [Fig. 5(c)] consist of few slender-like structures which are attached to other cells and are forming a network. The different cell shapes formed on the surface may relate to different Zn, Gd, Dy, and Nd additions and their varying concentration in the cell environment. In the Mg–Zn–Dy [Fig. 5(c)] alloy apart from the confluent cell layer, there is a white granular apatite spread nearer to the cell area. It shows that the distributed cells were even growing into the pores and are trying to establish a uniform cell network.
(a) The influence of different REE additions on the in vitro cell viability, (b) Mg–Zn–Gd, (c) Mg–Zn–Dy, and (d) Mg–Zn–Gd–Nd alloys SEM micrographs with the morphology of NIH 3T3 cells after 1 day of cell culturing.

The results indicate that the prepared Mg-REE based alloys present a good biocopmaptabilty with cell culture. The cells tend to adhere onto the surface of the alloys. Hence, the addition of REE elements improves corrosion resistance and cytocompatibility. This illustrates that these alloys are promising for clinical studies.
D. Mechanical properties
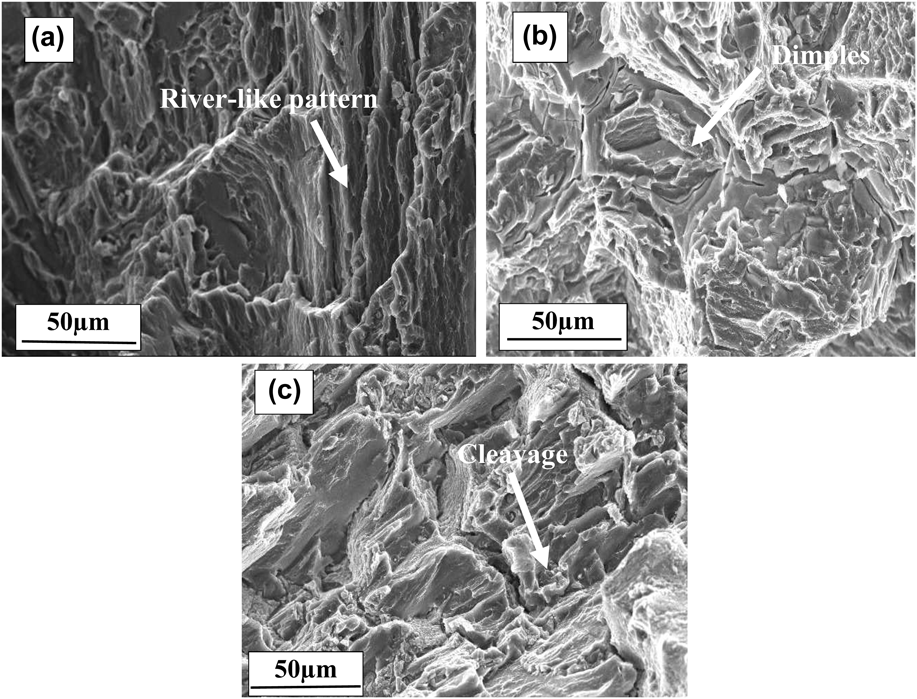
The tensile properties of as-cast Mg–Zn-REE alloy samples at the room temperature are summarized in Table IV. Mg–Zn–Gd–Nd and Mg–Zn–Gd alloys showed relatively high YS compared to the Mg–Zn–Dy alloy. The higher strength of these alloys are primarily attributed to the presence of secondary phases and solid solution strengthening of the Mg matrix. Besides, it has also been reportedReference Xu, Liu, Xu and Han58,Reference Shao, Yang and Ma59 that attachment of the secondary phase into the metal matrix induces more stress concentration at the matrix/particle interface, which leads to nucleation of voids by debonding of the matrix/particle interface. In addition, the dislocation pile-up at the interface due to brittleness of the secondary phases causes crack initiation and its easy propagation. This reduces the UTS and the ductility of the alloy. The LPSO phase observed here makes a weak interface with the Mg matrix, which leads to the lowering of mechanical properties as compared to that of the Mg–Zn–Gd–Nd alloy. The effect of solid solution strengthening due to Zn may also expected to decrease the strength of the alloy.Reference Yang, Wang, Wang and Zhang29 The improvement in the elongation on Mg–Zn–Gd–Nd was mainly attributed to the changes in the microstructure induced by the increase in the amount of alloying elements.Reference Srinivasan, Huang, Mendis, Blawert, Kainer and Hort39 However, in Mg–Zn–Dy, the formation of coarse secondary phase precipitates in the grain boundary region leads to a low elongation.Reference Lu, Ma, Jiang, Chen, Song, Yuan, Chen and Yang60 The fractured surface of the Mg–Zn–Gd alloy [Fig. 6(a)] shows a deformed river-like pattern with raised edges. Figure 6(b) shows the fractured surface morphology of the alloy illustrating the quasi cleavage fracture with large dimples (faceted texture). Fu et al.Reference Zhang, Yuan, Mao, Niu, Fu and Ding61 reported that the activation of nonbasal dislocations changes the fracture pattern from cleavage brittle fracture to quasi cleavage fracture during tensile testing. The presence of these cleavage planes led to a quasi-cleavage mode of fracture. In the Mg–Zn–Dy alloy, the presence of an eutectic phase (Mg8ZnDy) determines the fracture behavior. Rough edges indicate a low bonding strength between the α-Mg matrix and the eutectic phase.Reference Zhang, Xin, Nie, Cheng, Wang and Xu46 It caused the failure of the tensile sample at a lowered UTS value of 107 MPa. The SEM micrographs [Fig. 6(c)] of Mg–Zn–Dy show relatively flatter areas and cleavage planes with microcracks. The EDS analysis shows that microcracks occur at the junction of the Mg8ZnDy precipitate and α-Mg matrix. The Mg–Zn–Gd–Nd alloy presents a higher strength (131 MPa) and elongation (12 ± 1%). The eutectic phase which is precipitated along the grain boundary provides an additional barrier to the movement of dislocations resulting in an enhancement in tensile strength. The reported YS of Mg–1% Zn is 60.62 MPa.Reference Cai, Lei, Li and Feng55 It implies that there is a significant improvement in the mechanical properties in alloys with REE as compared to the as-cast Mg–Zn alloy system.
Mechanical properties of the as-cast alloys.

SEM micrograph revealing the tensile fracture surface morphology of the (a) Mg–Zn–Gd, (b) Mg–Zn–Gd–Nd, and (c) Mg–Zn–Dy.

IV. CONCLUSIONS
Mg–Zn–Gd, Mg–Zn–Dy, and Mg–Zn–Gd–Nd alloys are developed as biodegradable materials for implant fixation. Based on the results, the following conclusions are drawn:
(1) All three alloys show the formation of secondary phases that result in an improvement in the mechanical and in vitro degradation properties.
(2) Microstructures of alloys predominantly consist of lamellar LPSO phase in the Mg–Zn–Gd alloy, Mg8ZnDy particles in the Mg–Zn–Dy alloy, and Mg12Nd particles in the Mg–Zn–Gd–Nd alloy. In addition, few binary phases such as Mg–Zn and Gd–Zn in the form of particles were also presented in the alloys.
(3) The in vitro degradation of the alloys in HBSS is obtained by hydrogen emission, mass loss, and Mg2+ ion release and electro chemical tests. The results showed that the addition of Gd to the Mg–Zn alloy enhances the corrosion resistance. The dissolution of Mg2+ and the hydrogen emission were limited at the beginning of the immersion. The lower hydrogen emission of the Mg–Zn–Gd alloy could show lower possibilities of H2 bubbles during the in vivo implantation. The corrosion rate obtained from the weight loss is in the order of Mg–Zn–Gd < Mg–Zn–Gd–Nd < Mg–Zn–Dy. This shows the consistency in the results of hydrogen evolution and electrochemical experiments.
(4) The cell culture study proves the good cytocompatibility of all three alloys. Dense cells adhered well and colonize on the whole surface of the alloys.
(5) The excellent ductility and tensile strength exhibited by the Mg–Zn–Gd–Nd alloy are due to the strengthening by the eutectic phase. The coarse and continuous LPSO phase at the grain boundaries in the Mg–Zn–Gd alloy leads to moderate ductility. The bulk continuous phase at the grain boundaries of the Mg–Zn–Dy alloy lowers its strength and leads to easy crack propagation.
Supplementary Material
To view supplementary material for this article, please visit https://doi.org/10.1557/jmr.2018.311.
ACKNOWLEDGMENTS
The authors thank the Department of Metallurgical and Materials Engineering and the Department of Chemical Engineering, National Institute of Technology, Karnataka, for providing access to various experimental facilities.