Research into in-group identification has expanded in recent decades, with the recognition that group membership is a major influence on individual experience and behavior. According to social identity theory (Tajfel, Reference Tajfel and Tajfel1978; Tajfel, & Turner, Reference Tajfel, Turner, Worchel and Austin1986) and self-categorization theory (Turner, Hogg, Oakes, Reicher, & Wetherell, Reference Turner, Hogg, Oakes, Reicher and Wetherell1987) identification with in-groups is an important part of individual self-concept that influences the attitudes and behavior of individuals. Awareness of one’s membership in a social group leads one to think and to behave in the ways members of this group do.
There are many conceptualizations and much operationalization of in-group identification in the literature. Some authors operationalize it as a unitary scale, others approach it as a multidimensional construct, but there is little agreement regarding the set of its components (for reviews see Ashmore, Deaux, & McLaughlin-Volpe, Reference Ashmore, Deaux and McLaughlin-Volpe2004; Leach et al., Reference Leach, van Zomeren, Zebel, Vliek, Pennekamp, Doosje and Spears2008). Leach et al. (Reference Leach, van Zomeren, Zebel, Vliek, Pennekamp, Doosje and Spears2008) have reviewed different approaches to the conceptualization of in-group identification and systematized its components proposed by different authors in a single logical and coherent model. Their model includes five main components: individual self-stereotyping, in-group homogeneity, solidarity, satisfaction, and centrality. Individual self-stereotyping is the degree to which an individual perceives herself or himself as similar to an in-group prototype. In-group homogeneity is the degree to which an individual perceives her or his in-group as relatively homogeneous and distinct from relevant out-groups. Solidarity refers to a sense of belonging, a psychological attachment to the in-group, and coordination with the other group members. Satisfaction refers to the positive evaluation of the in-group. Centrality is the salience and importance of in-group membership.
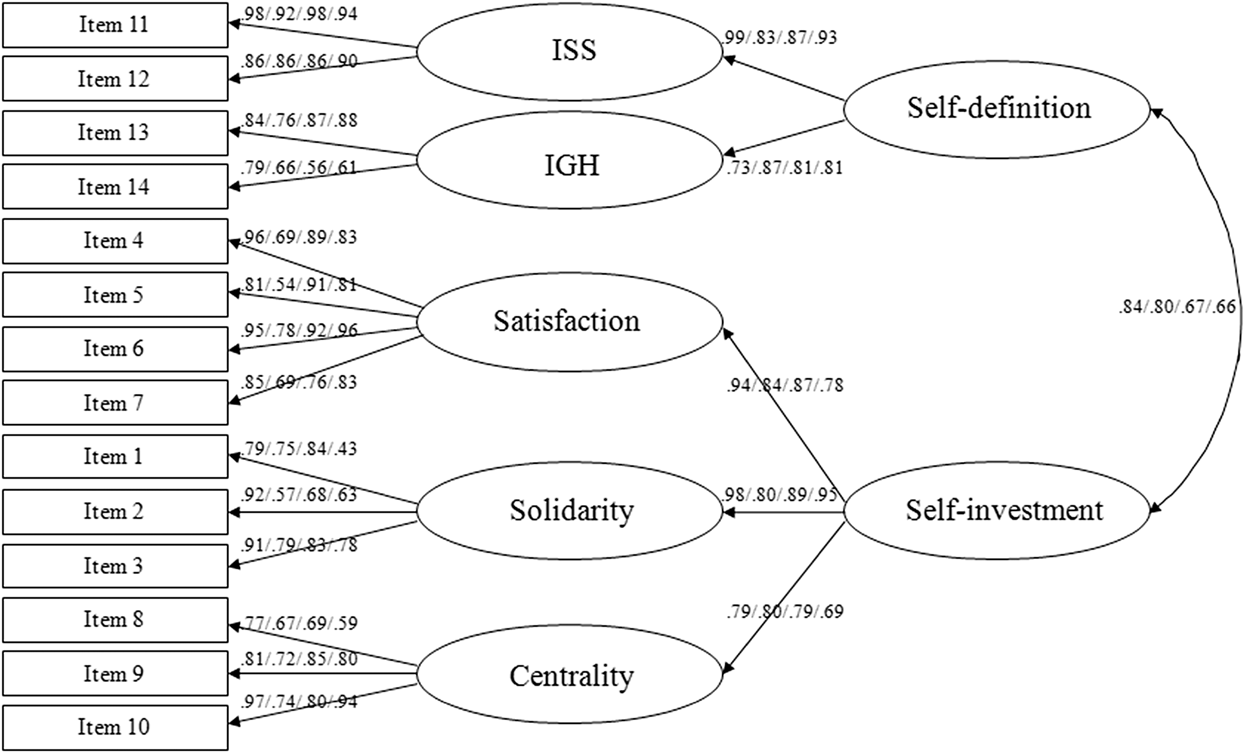
Based on this analysis, Leach et al. (Reference Leach, van Zomeren, Zebel, Vliek, Pennekamp, Doosje and Spears2008) developed a hierarchical model of in-group identification, which consists of these five components integrated into two more abstract, higher-order dimensions: self-definition and self-investment (see Figure 1). Leach et al. (Reference Leach, van Zomeren, Zebel, Vliek, Pennekamp, Doosje and Spears2008) operationalized this hierarchical model in a 14-item measure. Most of the items were close adaptations of those used in previous narrow approaches. The authors validated their measure in seven studies using different groups (University, Dutch, and European). Results showed that their theoretical first- and second-order factor models fit the data well and the scale was shown to have high internal consistency, concurrent validity, construct validity, and discriminant validity. An independent examination of scale structure conducted by Howard and Magee (Reference Howard and Magee2013) showed that the theoretical model has an acceptable fit to the data from different types of in-groups: country, state, university, and online group (the Reddit.com community). This hierarchical model of in-group identification is important because it was created by combining multiple approaches, the main classic and contemporary models of the in-group identification, and specifies similarities and differences between its components. The measure based on this model can be used for studying identification with groups of any type.
Hierarchical (multicomponent) model of in-group identification. Standardized item loadings are presented in the following order: Russians/Orthodox (Christians)/Students/Males & Females. ISS – individual self-stereotyping; IGH – in-group homogeneity.

The model has been widely used in psychological research. In recent years, the Leach et al. (Reference Leach, van Zomeren, Zebel, Vliek, Pennekamp, Doosje and Spears2008) measure of in-group identification was used in at least 20 studies using different types of target groups: ethnic, national, and racial in-groups (Danel et al., Reference Danel, Fedurek, Coetzee, Stephen, Nowak, Stirrat and Saxton2012; Giamo, Schmitt, & Outten, Reference Giamo, Schmitt and Outten2012; Koval, Laham, Haslam, Bastian, & Whelan, Reference Koval, Laham, Haslam, Bastian and Whelan2012; Leach, Mosquera, Vliek, & Hirt, Reference Leach, Mosquera, Vliek and Hirt2010; Philpot & Hornsey, Reference Philpot and Hornsey2011; Shepherd, Spears, & Manstead, Reference Shepherd, Spears and Manstead2013; Stürmer et al., Reference Stürmer, Benbow, Siem, Barth, Bodansky and Lotz-Schmitt2013; Wang, Minervino, & Cheryan, Reference Wang, Minervino and Cheryan2013), gender in-groups (Correia et al., Reference Correia, Alves, Sutton, Ramos, Gouveia-Pereira and Vala2012; Good, Moss-Racusin, & Sanchez, Reference Good, Moss-Racusin and Sanchez2012; Kenny & Garcia, Reference Kenny and Garcia2012), student in-groups (Becker, Reference Becker2012; Correia et al., Reference Correia, Alves, Sutton, Ramos, Gouveia-Pereira and Vala2012; Cruwys et al., Reference Cruwys, Platow, Angullia, Chang, Diler, Kirchner and Wadley2012; Leach et al., Reference Leach, Mosquera, Vliek and Hirt2010), online in-groups (people from an online forum sharing the same interests) (Howard, Reference Howard2014; Howard & Magee, Reference Howard and Magee2013), the army (Sani, Herrera, Wakefield, Boroch, & Gulyas, Reference Sani, Herrera, Wakefield, Boroch and Gulyas2012), group of experiment participants (Hartmann & Tanis, Reference Hartmann and Tanis2013; van Veelen, Otten, & Hansen, Reference van Veelen, Otten and Hansen2013), supporters of mental health advocacy (Gee & McGarty, Reference Gee and McGarty2013), and organizational in-group (Smith, Amiot, Callan, Terry, & Smith, Reference Smith, Amiot, Callan, Terry and Smith2012). But, with the exception of two studies (Correia et al., Reference Correia, Alves, Sutton, Ramos, Gouveia-Pereira and Vala2012; Danel et al., Reference Danel, Fedurek, Coetzee, Stephen, Nowak, Stirrat and Saxton2012), the Leach et al. (Reference Leach, van Zomeren, Zebel, Vliek, Pennekamp, Doosje and Spears2008) measure was used only in English-language samples. Danel et al. (Reference Danel, Fedurek, Coetzee, Stephen, Nowak, Stirrat and Saxton2012) and Correia et al. (Reference Correia, Alves, Sutton, Ramos, Gouveia-Pereira and Vala2012) translated the Leach et al. (Reference Leach, van Zomeren, Zebel, Vliek, Pennekamp, Doosje and Spears2008) items into Polish and Portuguese languages, respectively, but did not examine structural validity of their translations. At present time, the measure exists only in the English version.
Group identification is a very popular research topic around the world, including Russian-speaking countries. The Leach et al. (Reference Leach, van Zomeren, Zebel, Vliek, Pennekamp, Doosje and Spears2008) model and measure of in-group identification would be very useful in countries where the issues of ethnic, national, and other types of social identification have not been sufficiently studied. The aim of this study was to examine the Leach et al. (Reference Leach, van Zomeren, Zebel, Vliek, Pennekamp, Doosje and Spears2008) model of in-group identification in three different Russian samples. In Study 1, we focused on the validity of the hierarchical model. We applied confirmatory factor analysis (CFA) to the data from four different in-groups (ethnic, religious, university, and gender). In Study 2, we examined the convergent and discriminant validity of the five components of in-group identification by assessing the component correlations with different measures of in-group identification.
STUDY 1: FACTORIAL VALIDITY AND RELIABILITY EVIDENCES
Method
Participants
Three samples were employed. The first sample included 226 undergraduate students of the Higher School of Economics (86 male, 135 female, 5 respondents did not specify their gender, M (age) = 18.13, SD = 1.18 (5 people did not specify their age). For students, participation in the survey was part of a Psychology course. They completed a paper-and-pencil questionnaire. The second sample included 146 people who identified themselves as Russian (58 male, 88 female, M (age) = 33.1, SD = 11.8). The third sample included 249 people who identified themselves as Orthodox Christian (143 male, 106 female, M (age) = 30, SD = 8.6). In the second and third samples, participants completed an online questionnaire. Links to the survey were placed on specialized websites dedicated to psychology and the Russian culture.
Procedure and Measures
All participants completed a structured questionnaire that included a 14-item measure based on a hierarchical model of in-group identification (Leach et al., Reference Leach, van Zomeren, Zebel, Vliek, Pennekamp, Doosje and Spears2008). The items were translated from English into Russian by the authors and then back-translated by a bilingual, native speaker of both languages, who was unaware of the subject of the questionnaire. Differences in translations were discussed until agreement was reached. The Russian version of the items can be found in the Appendix. Each item was scored on a 7-point scale, all 7 options verbalized ranging from 1 (absolutely disagree) to 7 (absolutely agree). We created four versions of the measure for each in-group: Russian, Orthodox Christian, gender, and students of the Higher School of Economics. Participants from the student sample completed two 14-item measures: one about the in-group of students of the Higher School of Economics, and one about the gender in-group. Before the start of the survey the respondents were informed about the purpose and procedure of the study, as well as their right to withdraw from the study at any time. In all samples the survey was anonymous and the respondents were informed that their answers would be kept confidential and used only for research purposes.
Results
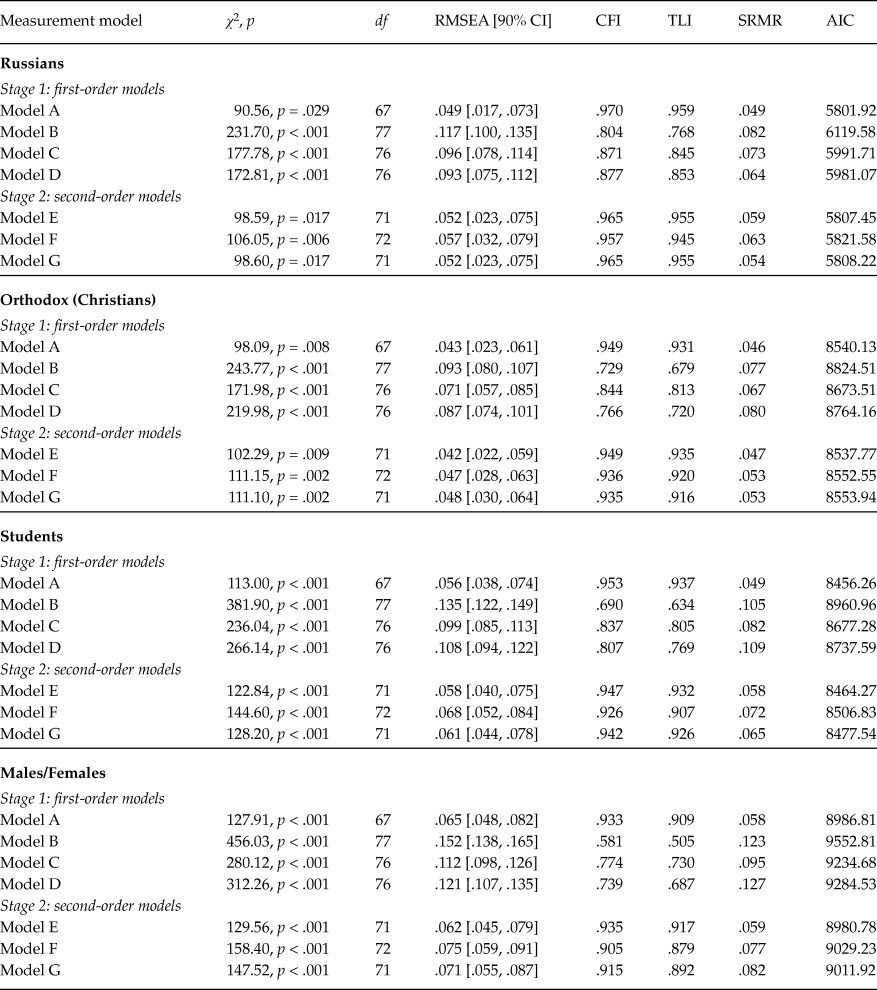
We performed CFAs with Mplus 6.12 (estimator – MLMV) to examine how well the proposed measurement model fitted the Russian version of the 14-item measure of in-group identification. We estimated the proposed measurement model separately for four types of in-groups: Russians, Orthodox, university, and gender. First we examined the first-order model, which consists of five components: individual self-stereotyping, in-group homogeneity, solidarity, satisfaction and centrality (Model A). The results (shown in Table 1) indicate that Model A fitted the data well for all four group identities. The fit indices (excluding TLI in the case of the gender in-group) exceeded the benchmark of .930 and both of the main residual indices fell below the benchmark of .080 for models of this sample size (see Hu & Bentler, Reference Hu and Bentler1999). In all four in-groups, Model A showed the best fit to the data. Following Leach et al. (Reference Leach, van Zomeren, Zebel, Vliek, Pennekamp, Doosje and Spears2008), we compared Model A with three alternative first-order measurement models (Model B = all items loading on one common factor: identification; Model C = items loading on two components: self-definition and self-investment; Model D = items loading on two components: cognitive/self-categorization and affective ties/social identity). The fit of all three alternative models was worse. Because the alternative models were based on the same data, but not nested, they can be compared using the Akaike information criterion (AIC) index (Byrne, Reference Byrne2011). As shown in Table 1, Model A has the lowest AIC in all four samples, which suggests that Model A is the best first-order model.
The Fit of Models of In-Group Identification

Note: df = degrees of freedom; RMSEA – root-mean-square error of approximation; CFI – comparative fit index; TLI – Tucker-Lewis index; SRMR – standardized root-mean square residual; AIC – Akaike information criterion.
Second, we examined the hierarchical model (Model E), which included the second-order factors of self-definition (i.e., individual self-stereotyping and in-group homogeneity) and self-investment (i.e., satisfaction, solidarity, centrality). This model is shown on Figure 1. Model E fitted the data well for all four group identities (Table 1). The fit indices (excluding TLI in the case of the gender in-group) exceeded the benchmark of .930, and both of the main residual indices fell below the benchmark of .080. In all four samples Model E had the lowest AIC, which means Model E is the best second-order model.
As Figure 1 shows, the standardized factor loadings exceeded .50 for nearly all items (excluding the first item in the gender in-group), with many above .80, and differed significantly from zero (p < .05). Each of the five components loaded onto the expected second-order factor. All the second-order factor loadings exceeded .60, with many above .80, and differed significantly from zero (p < .05). The second-order factors of self-definition and self-investment were strongly and significantly related in all samples (.66–.84, all p < .05). All of these parameters confirm that Model E, with five components and two second-order factors, was well defined by its items. The fit indices indicate that Model E fitted the data better, compared to the two alternative models (Model F = five-components: individual self-stereotyping, in-group homogeneity, solidarity, satisfaction and centrality, and one dimension: identification; Model G = alternative five-component/two-dimensional: self-definition (i.e., individual self-stereotyping, in-group homogeneity, and centrality) and self-investment (i.e., satisfaction, solidarity).
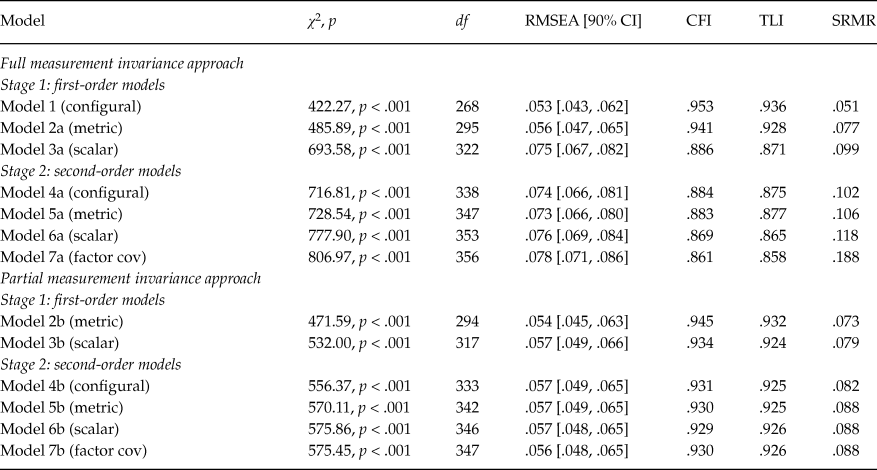
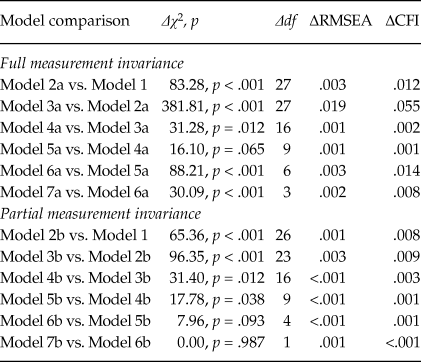
In order to investigate the factorial invariance of the instrument, we performed a series of multi-group CFA analyses testing configural, metric, and scalar invariance of the model across the 4 samples. Latent factors were identified by fixing variance to 1. Because the complete first- and second-order configural invariance model had convergence issues, we started by establishing the invariance of the first-order structure and then used the scalar-invariant first-order model as a baseline for the second-order models. This strategy resulted in a sequence of nested models, allowing to use the DIFFTEST function in order to compare the fit. As the chi-square test is overly sensitive in large samples, we relied on the ΔCFI > .01 criterion of a significant difference between nested models (Cheung & Rensvold, Reference Cheung and Rensvold2002). At each stage, we first evaluated the fit of a completely invariant model and then proceeded by establishing partial measurement invariance (Byrne, Reference Byrne2011; Byrne, Shavelson, & Muthen, Reference Byrne, Shavelson and Muthén1989). The results of model fit tests are summarized in Table 2 and those of model comparison are presented in Table 3.
The Fit of Multi-Group Models of In-Group Identification

Note: df = degrees of freedom; RMSEA – root-mean-square error of approximation; CFI – comparative fit index; TLI – Tucker-Lewis index; SRMR – standardized root-mean square residual.
Multi-group model comparison results

Note: Δdf = difference in degrees of freedom; ΔRMSEA – change in root-mean-square error of approximation; ΔCFI – change in comparative fit index.
The fit of the first-order configural invariance model (1) was good. Though the fit of the full metric invariance model (2a) was statistically worse, the absolute difference was not large and there were no pronounced outliers among modification indices (MI). The strongest MI (χ2 = 12.26) referred to the loading of item 2 in the Orthodox sample; removal of the respective constraint resulted in a statistically significant, but marginal improvement of the model (2b). The fit of the first-order full scalar invariance model (3a) was much worse, compared to the model 2a, suggesting some strongly non-equivalent item intercepts. Based on MI, we relaxed intercept constraints (one at a time) for item 3 in the Gender sample (χ2 = 44.94), item 2 in the Student sample (χ2 = 38.55), item 5 in the Orthodox sample (χ2 = 26.34), and item 8 in the Student sample (χ2 = 22.54). The resulting partial scalar invariance model (3b, based on model 2b) had no pronounced MIs for intercepts (the strongest MI: χ2 = 6.70) and exhibited satisfactory fit.
When configural invariance second-order part of the model was introduced into the models 3a and 3b, the fit did not become worse, according to the ΔCFI criterion, both for the model developed using full invariance approach (4a) and partial invariance approach (4b). Introduction of metric invariance constraints into the second-order part of the model did not lead to a deterioration of model fit either (models 5a and 5b). There was empirical under-identification in the means part of the second-order scalar invariance model, and second-order factor means for Student and Gender samples were constrained to 0 in order for the models 6a and 6b to converge. Comparison of model fit indices indicated some pronounced non-invariance of factor intercepts, and we relaxed constraints for the intercepts of second-order solidarity factor in the Gender sample (χ2 = 54.03) and the individual self-stereotyping factor in the Orthodox sample (χ2 = 21.70), after which the fit of model 6b did not differ statistically from that of model 5b.
Finally, in model 7 we constrained the covariance of second-order factors to be equal across groups. Because the model fit deteriorated, in the partially invariant model we relaxed this constraint for the Russian sample (χ2 = 28.04) and for the Orthodox sample (χ2 = 10.09), after which the fit indices of the models 6b and 7b did not differ.
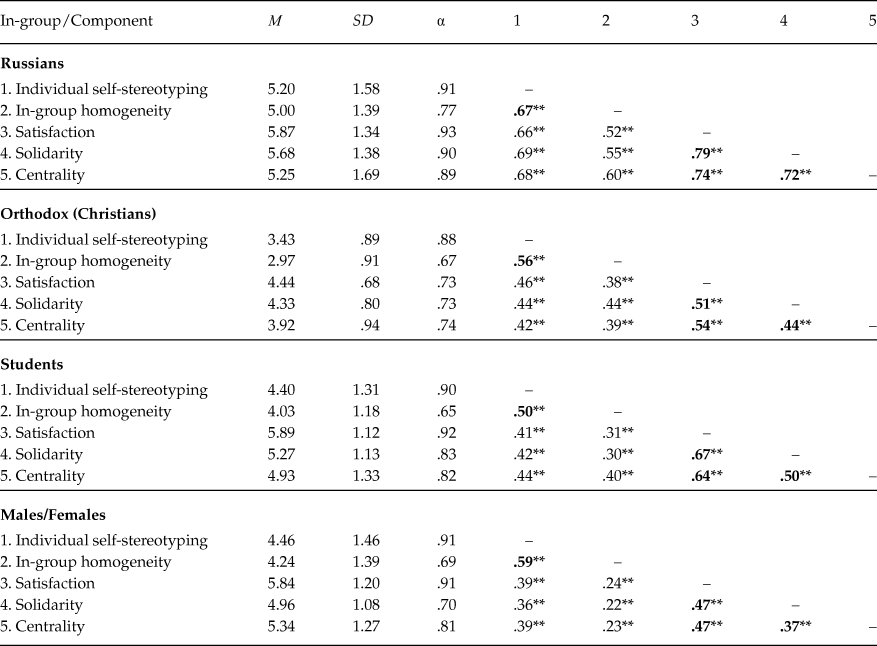
Finally, we computed the scale scores for each component. All the five scales were of moderate or high reliability, Cronbach’s α ranged between .65 and .93 (see Table 4). Correlations between the five components were moderate or high, but in all four in-groups inter-correlations were higher for the components referring to the same dimension. Satisfaction, solidarity, and centrality have higher correlations with each other than with individual self-stereotyping or with in-group homogeneity, but correlations between individual self-stereotyping and in-group homogeneity were higher than their correlations with satisfaction, solidarity, and centrality (see Table 4). This supports the hierarchical conceptualization proposed by Leach et al. (Reference Leach, van Zomeren, Zebel, Vliek, Pennekamp, Doosje and Spears2008) and the results of the CFA. Therefore, the results support the use of the subscales and confirm the structural validity of the Russian version of the measure.
Descriptive Statistics and Inter-correlations for Five Components of In-Group Identification

Note: In the Orthodox sample we used a 5-point scale. Therefore, means and standard deviations are lower than in the student and Russian samples. Bold correlations are those of scales that refer to the same dimension. **p ≤ .01
STUDY 2: EXAMINING VALIDITY
We performed additional studies to examine the convergent and discriminant validity of the Russian version of the measure of in-group identification. As part of the same survey session, two of the three Study 1 samples (undergraduate students of the Higher School of Economics and people who identified themselves as Russians) completed several additional measures related to the in-group identification.
Method
Participants and Measures
Sample 1
146 people who identified themselves as Russians in Study 1 completed several additional measures.
Multigroup Ethnic Identity Measure (MEIM)
To gauge the convergent validity of the Leach et al. (Reference Leach, van Zomeren, Zebel, Vliek, Pennekamp, Doosje and Spears2008) measure, we used MEIM (Phinney, Reference Phinney1992). This scale consists of 12 items scored on a 4-point frequency scale and comprises two subscales: Affirmation and Belonging (α = .92), and Identity Search (α = .84). Participants completed the Russian version of the MEIM (sample items: “I am glad that I belong to Russians”, “I follow the traditions of Russians”) (Tatarko & Lebedeva, Reference Tatarko and Lebedeva2011). Participants were asked to indicate their identification as Russians (as opposed to immigrants from Central Asian countries). As Leach et al. (Reference Leach, van Zomeren, Zebel, Vliek, Pennekamp, Doosje and Spears2008) suggested, the Affirmation and Belonging subscale includes items similar to the solidarity, centrality, and satisfaction components and the Identity Search subscale includes items similar to the centrality and satisfaction components.
Self–Group Overlap
This graphical scale was used to assess the self-inclusion of respondents in their in-group (Schubert & Otten, Reference Schubert and Otten2002). Seven pictures, with two circles on each, showed different degrees of overlap. The first circle represented the respondent, the second circle represented the in-group (Russians). Participants were asked to choose the pair of circles that best describes the overlap between him/her and the in-group. The choice was translated into a 7-point scale with higher scores indicating higher overlap. Swann, Gomez, Seyle, Morales, and Huici (Reference Swann, Gomez, Seyle, Morales and Huici2009) showed that group identification is associated with fusion, defined as “a powerful union of the personal and social self wherein the borders between the two become porous without diminishing the integrity of either construct” (Swann, Jetten, Gomez, Whitehouse, & Bastian, Reference Swann, Jetten, Gomez, Whitehouse and Bastian2012, p. 443). It means that a highly identifying person fuses with a group. As Leach et al. (Reference Leach, van Zomeren, Zebel, Vliek, Pennekamp, Doosje and Spears2008) suggested, the inclusion of the self in the in-group should be associated especially with individual self-stereotyping.
Positivity of Ethnic Identity Scale
This scale consists of 4 items scored on a 5-point scale (sample item: “If I have the opportunity to choose an ethnic group, I would choose the same”), which ranged from 1 (absolutely disagree) to 5 (strongly agree). Positivity of ethnic identity refers to positive emotions based on ethnic group membership (Tatarko & Lebedeva, Reference Tatarko and Lebedeva2011). We expected the Positivity of ethnic identity subscale (α = .61) to be associated with satisfaction and solidarity components.
Sample 2
226 undergraduate students of the Higher School of Economics from Study 1 completed several additional measures.
Group Entitativity Measure (GEM-in)
GEM-in (Gaertner & Schopler, Reference Gaertner and Schopler1998) is a modification of the Inclusion of Other in the Self scale (Aron, Aron, & Smollan, Reference Aron, Aron and Smollan1992) and is composed of six diagrams. On each diagram there are five similar circles representing in-group members. On the first diagram the circles are far apart; on the last diagram they overlap. Gaertner and Schopler (Reference Gaertner and Schopler1998) suggest that GEM-in is sensitive to changes in both intragroup similarity and interdependence. We expected perceived group entitativity to be associated with in-group homogeneity and solidarity.
Brief Scale of In-Group Emotions
Emotions associated with in-group membership were measured by adapting a version of Brief Scale of Ethnical Membership Emotions (Tatarko & Lebedeva, Reference Tatarko and Lebedeva2011). We changed the focus of this single-item scale from ethnic membership to university and gender group membership: “What do you feel about the fact of belonging to the Higher School of Economics/male or female group?” Participants had to choose one of the 5 responses: 1 – humiliation, 2– offense embarrassment, 3 – no feelings, 4 – quiet confidence, 5 – pride. We expected that in-group emotions would be associated most strongly with the satisfaction component.
Self–Group Overlap
The same measure as used in Sample 1; the first circle represented the participant, the second circle represented the in-group (in the first case, students of the Higher School of Economics, in the second case, the male or female group).
Intention to leave
The Intention to leave in-group was assessed only for the university in-group and was measured by 2 items (Spearman-Brown Coefficient = .84): “If I had the opportunity to study at another university, I would have done it” and “I often think that my choice of university was wrong, and it would be nice to study at another university”. Each item was scored on a 7-point frequency scale, which ranged from 1 (absolutely disagree) to 7 (strongly agree). When individuals identify with a group, they are less likely to intend to leave the group (Abrams, Ando, & Hinkle, Reference Abrams, Ando and Hinkle1998; Riketta, Reference Riketta2005). We expect that the intention to leave the in-group should be negatively associated with satisfaction and centrality components.
Results
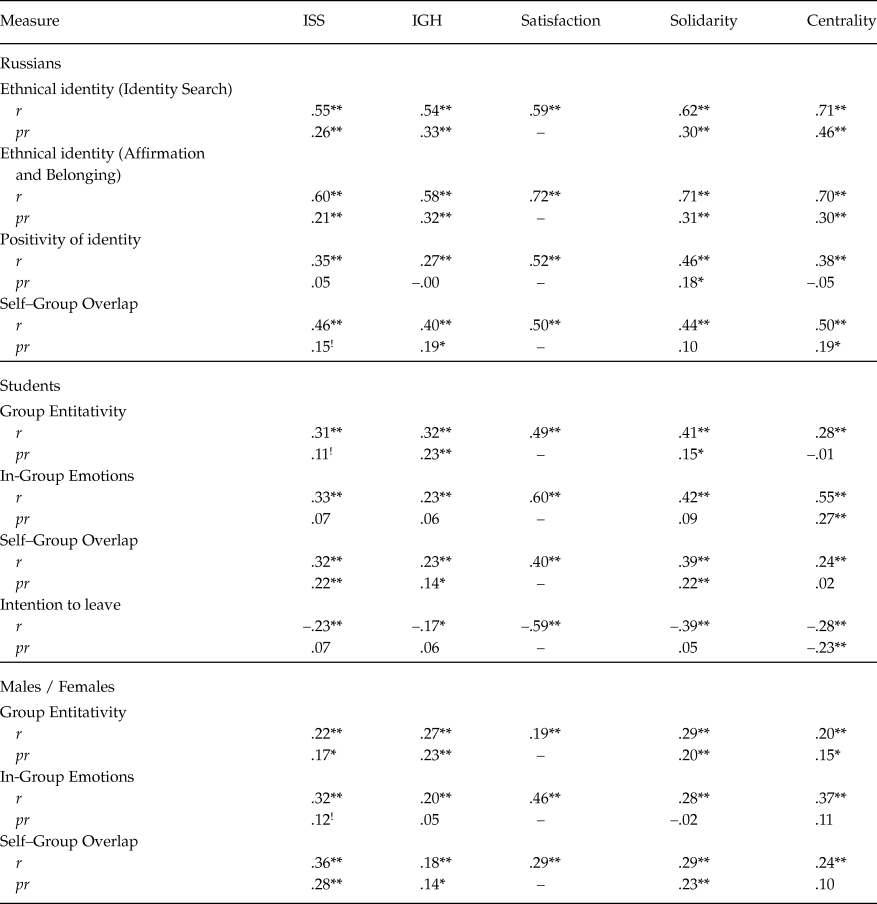
Table 5 shows the correlations between the five components of in-group identification and the different measures related to in-group identification. Following Leach et al. (Reference Leach, van Zomeren, Zebel, Vliek, Pennekamp, Doosje and Spears2008), we calculated the partial correlations which control for satisfaction, because satisfaction is the general and strongest component of in-group identification that tends to demonstrate the highest correlations with different scales.
Correlations of five components of in-group identification with different measures related to the in-group identification used in Study 2

Note: ISS – individual self-stereotyping; IGH – in-group homogeneity. Satisfaction controlled in partial r (pr). ! p < .10, *p ≤ .05, **p ≤ .01.
All the components were moderately correlated with the subscales of MEIM (Phinney, Reference Phinney1992). We expected that the Affirmation and Belonging subscale would correlate with the solidarity, centrality, and satisfaction components, and the Identity Search subscale would correlate with the centrality and satisfaction components of in-group identification. As shown in Table 3, there were statistically significant correlations between the Affirmation and Belonging subscale and the satisfaction, in-group homogeneity, solidarity, centrality and individual self-stereotyping components. The Identity Search subscale had statistically significant correlations with the satisfaction, centrality, in-group homogeneity, solidarity, and individual self-stereotyping components. These correlations indicate that the constructs measured by Leach’s et al. (Reference Leach, van Zomeren, Zebel, Vliek, Pennekamp, Doosje and Spears2008) items and MEIM measure are closely related. At the same time, the moderate effect sizes of the correlations suggest that the five components of in-group identification and Phinney’s measures of ethnic identification measure similar but distinct aspects of identification. The pattern of the correlations between Phinney’s scales and the components of in-group identification differs from that obtained by Leach et al. (Reference Leach, van Zomeren, Zebel, Vliek, Pennekamp, Doosje and Spears2008), which may results from non-equivalence of the English and Russian versions of the measures.
The satisfaction component had moderate correlations with the Positivity of Identity subscale, positive feelings about the in-group, and intention to leave the in-group. Consistent with the theoretical conceptualization, the satisfaction component refers to a positive evaluation of the in-group and it means that the person who is satisfied with his or her membership has positive feelings about membership and is intending to stay in the group (Stryker & Serpe, Reference Stryker, Serpe, Ickes and Knowles1982). These correlations suggest a convergent validity of the satisfaction component scale. Moreover, the satisfaction component had also significant correlations with self-group overlap and group entitativity. These weaker correlations are consistent with the satisfaction being a general component of in-group identification, which has the strongest relationship to all the other facets of group identification.
The individual self-stereotyping component was correlated with self-group overlap. Because the self-group overlap in the graphical measure is a visual metaphor for self-categorization (Schubert & Otten, Reference Schubert and Otten2002), these correlations suggest convergent validity of the self-stereotyping component scale.
The in-group homogeneity component correlated with perceived group entitativity. Because perceived group entitativity is theoretically close to group homogeneity (Hamilton, Sherman, & Castelli, Reference Hamilton, Sherman, Castelli, Stroebe and Hewstone2002; Pickett & Perrott, Reference Pickett and Perrott2004), these results suggest the convergent validity of the in-group homogeneity component.
The solidarity component was associated with perceived group entitativity and self-group overlap. Solidarity refers to a sense of belonging, a psychological attachment to the in-group, and coordination with other group members. Lickel et al. (Reference Lickel, Hamilton, Wieczorkowska, Lewis, Sherman and Uhles2000) demonstrated that the importance of the group to group members and the interaction among group members are significant parts of the perception of group entitativity. In other words, solidarity is similar to group entitativity. Moreover, self-group overlap as a degree of unity among group members also describes the relationship between group members and attitudes to a group (Schubert & Otten, Reference Schubert and Otten2002). All of these results support the convergent validity of the solidarity component.
The centrality component was correlated with the intention to leave in-group and emotions about in-group. Centrality is the salience and importance of in-group membership. Brewer (Reference Brewer, Wyer and Srull1988) argues that group members have two main needs, the desire to preserve their identity and the desire to belong to the group. It means that higher salience and importance of in-group membership (the centrality component) are associated with lower intention to leave the group.
There were unexpectedly low correlations of self-group overlap with in-group homogeneity and centrality for the Russian group, with solidarity and in-group homogeneity for the university group and solidarity for the gender group. These correlations may reflect differences in the understanding of overlap by participants.
In general, the associations between the five components of in-group identification and other measures followed our theoretical expectations and suggested validity of the five scales. In Study 2, the Russian version of the Leach et al. (Reference Leach, van Zomeren, Zebel, Vliek, Pennekamp, Doosje and Spears2008) measure was shown to have adequate convergent and discriminant validity.
General Discussion
The main goal of this study was to examine the Leach et al. (Reference Leach, van Zomeren, Zebel, Vliek, Pennekamp, Doosje and Spears2008) model of in-group identification and to establish convergent and divergent validity of the Russian version of the measure. In order to meet this goal, we conducted two studies using different types of social groups as targets. The results of Studies 1 and 2 have several main consequences.
First, our data showed that the structure of the hierarchical model of in-group identification by Leach et al. (Reference Leach, van Zomeren, Zebel, Vliek, Pennekamp, Doosje and Spears2008) is successfully replicated in the Russian samples. The same first- and second-order factors exist in the Russian sample data and the theoretical second-order factor model is indeed the best-fitting one. We can, therefore, assume that the model may be culturally universal, because it holds for the Dutch sample (Leach et al., Reference Leach, van Zomeren, Zebel, Vliek, Pennekamp, Doosje and Spears2008), and was successfully replicated in the American (Howard & Magee, Reference Howard and Magee2013) and now in Russian samples. However, because all these three cultures can be classified as Western cultures, further studies using more diverse cultural contexts are needed to confirm the cultural universality of the model. The results suggest that the measure can be a useful tool for cross-cultural research, once its cross-cultural measurement invariance is established.
Second, the Russian version of the measure of in-group identification has the same factor structure when it is used with different types of in-groups. The results of measurement invariance analyses suggest that the measure exhibits configural and metric invariance across the 4 target in-groups. The only non-equivalent loading parameter for item 2 (“I feel solidarity with…”) suggests that Russian-speaking respondents perceive literal “solidarity” (traditionally, a part of political discourse in the Russian language) as a less relevant expression for solidarity with members of one’s religious group, in contrast to groups of other types. However, a number of non-invariant intercepts indicate that some identity items are perceived by respondents differently when they are applied to different target in-groups. For instance, respondents showed a stronger tendency to endorse item 3 for gender identity (“I feel committed to men / women”), which may reflect the ambiguity this item gains in the gender context. Lower intercept of item 2 for the student group suggests that it is more difficult to “feel solidarity” with a very diverse social group. Lower intercept of item 5 (“I think that … have a lot to be proud of”) for the Orthodox group is explained by the negative evaluation of pride within the religious context. Higher intercept of item 8 (“I often think about the fact that I am…”) for the student group can be explained by contextual factors (students completed the questionnaire at the university). Non-equivalence of first-order factor intercepts is in line with the other findings. For instance, “solidarity” and “bond” with members of one’s own sex are perceived by the respondents differently from those with members of one’s own religion, profession, or country, resulting in a much lower intercept for the respective factor. Because second-order self-definition factor has only two indicators, it is not clear whether intercept non-equivalence for the Orthodox group relates to the individual self-stereotyping or to the in-group homogeneity component. Finally, non-equivalence of factor covariances indicates that self-definition and self-investment components of in-group identity are more strongly related in the cases of ethnic and religious identity, compared to gender and professional contexts. Overall, the results suggest that intercept non-equivalence may bias the analyses that compare raw scores on the in-group identification scales for different target in-groups. Qualitative methods, such as focus groups or cognitive interviewing, may be used to find out the substantive reasons for this bias.
Third, the Russian-language version of the measure was shown to have excellent internal reliability, high internal consistency, satisfactory convergent validity, and divergent validity. Confirmatory factor analysis supported the structural validity of the measure. Overall, we conclude that the Russian version of this measure shows adequate psychometric properties, and it can be used for future in-group research in Russian-language samples.
Our study is not without limitations. The validation of the Russian version of the Leach et al. (Reference Leach, van Zomeren, Zebel, Vliek, Pennekamp, Doosje and Spears2008) measure of in-group identification is not complete. There are a lot of alternative constructs that could have been measured in order to check the validity of the measure. The present study used data from a cross-sectional design. A longitudinal design could be employed in future research to investigate test-retest reliability of the measure. The Russian version measure of the in-group identification measure has only been investigated using four types of in-groups. This and previous research investigated in-group identification with groups categorized by Lickel et al. (Reference Lickel, Hamilton, Wieczorkowska, Lewis, Sherman and Uhles2000) as “social groups”. Usually these are large groups, with a lower degree of similarity, solidarity and interaction between group members (such as race, ethnicity, and gender). In contrast, there are two other types of group: the intimacy group (such a family or two people in a romantic relationship) and task-oriented groups (for instance, committees and work groups). Lickel et al. (Reference Lickel, Hamilton, Wieczorkowska, Lewis, Sherman and Uhles2000) demonstrated that identification with different types of groups is varied. This means that the model of in-group identification needs to be validated with intimacy and task-oriented groups.
This research was supported by the Russian Foundation for Humanities, grant 13–06–00519, to Elena Agadullina. We would like to express our appreciation to Olga Gulevich, Milana Hachaturova, Anatoly Skvortsov, and Yuliya Briseva for help in collecting data.
Appendix
Russian version of items measuring in-group identification
1. Я чувствую свою связь с [ингруппа]
2. Я солидарен с [ингруппа]
3. Я ощущаю свою приверженность [ингруппа]
4. Я рад, что являюсь частью [ингруппа]
5. Я думаю, что [ингруппа] есть чем гордиться
6. Мне приятно быть частью [ингруппа]
7. Принадлежность к [ингруппа] делает меня счастливым
8. Я часто думаю о том, что я [представитель ингруппы]
9. Принадлежность к [ингруппа] накладывает отпечаток на мою личность
10. Принадлежность к [ингруппа] – важная часть моего представления о себе
11. У меня много общего со среднестатистическим [представитель ингруппы]
12. Я похож на среднестатистического [ингруппа]
13. У [представителей ингруппы] много общего между собой
14. Все [представители ингруппы] очень похожи друг на друга