When Simon Kuznets (1945) and Charles Feinstein (Reference Feinstein1961) produced their first sets of historical national accounts—Kuznets for the United States, Feinstein for the United Kingdom—they dared to venture no further back than the mid-nineteenth century. Nowadays historical national accounts spanning several centuries are commonplace.Footnote 1 Neither Kuznets nor Feinstein, two very cautious scholars, claimed too much for their data's accuracy. Kuznets' caveats informed Oskar Morgenstern's famous mantra, qui numerare incipit errare incipit, while Feinstein applied reliability grades ranging from A (“firm estimates,” with margins of error less than 5 percent) to D (“conjectures,” with margins of error exceeding 25 percent) to the statistics in his classic 1972 study. Few nowadays note that Feinstein awarded grades of C (“rough estimates”) or D to all but one of his pre-1870 estimates of the main income and expenditure series (Morgenstern Reference Morgenstern1963, p. 2; Kuznets 1945; Feinstein Reference Feinstein1972, pp. 20–22).Footnote 2 Should estimates based on weaker data and straddling much longer periods be awarded higher grades?
While Kuznets' and Feinstein's main interest was in macroeconomic aggregates, today the focus of economic historians is mainly on GDP per capita. Unfortunately, estimates of GDP per capita in earlier centuries are compounded by fallible demographic data. Take the case of England, where the population estimate of 4.81 million on the eve of the Black Death by Stephen Broadberry, Bruce Campbell, Alexander Klein, Mark Overton, and Bas van Leeuwen (henceforth Broadberry et al.) is distinctly higher than estimates by Josiah Russell (3.7 million) and Overton and Campbell (4.0–4.5 million), but conservative compared to the 6 million proposed independently by Richard Smith and Gregory Clark. In other words, for any given estimate of GDP, Russell's pre-1348 population would have enjoyed a per capita income 62 percent higher than that of Smith and Clark. Similar doubts surround estimates of England's population in the wake of the Black Death (Wrigley and Schofield Reference Wrigley and Schofield1981, pp. 207–15; Broadberry et al. Reference Broadberry, Campbell, Klein, Overton and van Leeuwen2011a, p. 23; Russell Reference Russell1966; Overton and Campbell Reference Overton1996; Smith Reference Smith and Campbell1991; Clark Reference Clark2007, p. 30).
When newly minted data earn fewer credits than reinterpretations of the past based on such data, the temptation to combine the drudgery of data construction with the glamour of interpretation is almost irresistible. And so estimates of GDP per capita for several European economies over nearly a millennium have been invoked to underpin far-reaching findings regarding economic change in medieval and early modern Europe and beyond.Footnote 3 Challenging and plausible as these findings may be, how reliable are they? In this study, we highlight the tentative character of historical national accounts by focusing on one important component of GDP, agricultural output, in one economy, that of England.
Four Conflicting Estimates of Agricultural Output
The trends in English agricultural output and food availability since 1000 have an important bearing on our understanding of economic conditions in the early modern era. Nutritional status before and during the Industrial Revolution, is equally important to the pace of industrialization. Food matters for material well-being not only as a consumption good but also as a contributor to human capital. More food today may mean yet more food tomorrow. For economic growth to occur, agriculture must generate the calorie surpluses needed to sustain an increasing and adequately fed nonagricultural labor force. When did progress in primary food production allow this to happen? How well fed were English workers on the eve of the Industrial Revolution? Estimates of agricultural output inform and influence interpretations of trends in nutrition and living standards both over the centuries and during the period of the Industrial Revolution.
Unfortunately, consensus is lacking on calorie consumption per capita in medieval and preindustrial England. This is perhaps inevitable: calculating past agricultural output is an inexact science, and the precision of point estimates to the nearest unit of net output or their calorific equivalents is misleading. The challenge of producing reliable or plausible estimates of agricultural output in an era when key components such as crop acreages, crop and milk yields, seed ratios, carcass weights, and losses from processing and wastage are disputed is clear. Even the most careful estimates are conjectural, and subject to an unspecified and unknown but non-negligible margin of error (compare Feinstein and Thomas Reference Feinstein and Thomas2002; Turner Reference Turner and Collins2000, pp. 224–58).
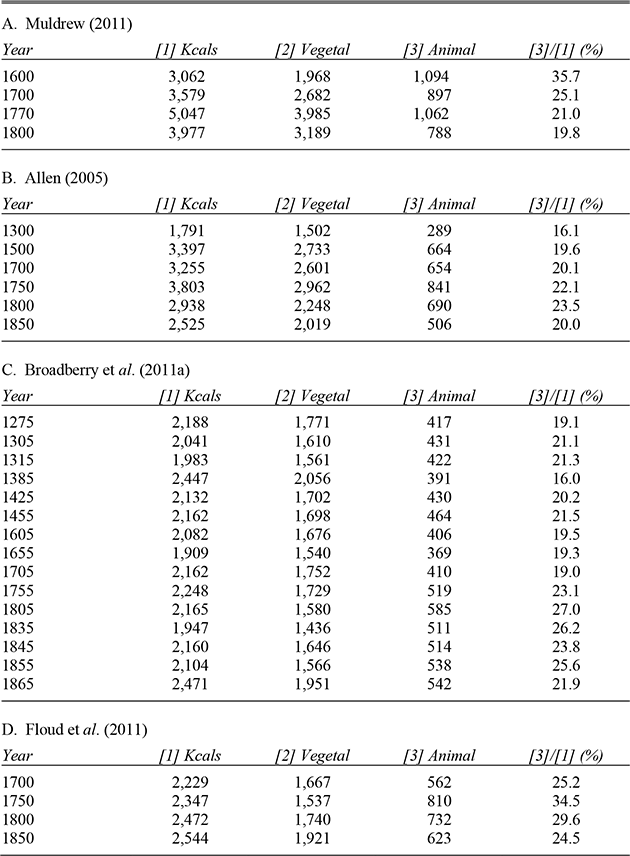
Table 1 reports four recent estimates of food supply—net agricultural value added plus net imports—measured in calories per head of population in England and Wales. The estimates by Robert C. Allen (Reference Allen2005) and by Broadberry et al. (Reference Broadberry, Campbell, Klein, Overton and van Leeuwen2011a) cover the entire period since 1300, while those by Roderick Floud, Robert Fogel, Bernard Harris, and Sok Chul Hong (henceforth Floud et al. Reference Floud, Fogel, Harris and Chul Hong2011) and by Craig Muldrew (Reference Muldrew2011) concentrate on the post-1600 period.Footnote 4 All build on a rich primary source-driven literature on English agronomics that extends all the way from the work of Arthur Young and William Marshall over two centuries ago to that of Brian Holderness (Reference Holderness and Mingay1989), Mark Overton and Bruce Campbell (Reference Overton1996), and Michael Turner, John Beckett, and Bethanie Afton (Reference Turner, Beckett and Afton2001).Footnote 5 The first two remain unpublished in the traditional sense, but Allen's estimate informs important publications by the same author (Allen Reference Allen2005; Reference Allen2009), while Broadberry et al.'s, supported by an online database,Footnote 6 is already being cited by other scholars. All four studies provide estimates of calories per head for a range of dates, as well as of the shares of animal and vegetable sources in the total.
FOUR RECENT ESTIMATES OF ENGLISH CALORIE CONSUMPTION PER CAPITA, C. 1300–1800

Sources:
Muldrew (Reference Muldrew2011, p. 156); Allen (Reference Allen2005, p. 39, Table 12); Broadberry et al. (Reference Broadberry, Campbell, Klein, Overton and van Leeuwen2011a, table 23); Floud et al. (Reference Floud, Fogel, Harris and Chul Hong2011, p. 167, table 4.13: Variant B); Deborah Oxley (2012, private communication, 26 November).
FOUR ESTIMATES OF CALORIES PER HEAD
The four estimates differ strikingly in their assessments of nutritional status (see Figure 1 and Table 1). Allen (Reference Allen2005) reckons that calorie consumption per head was significantly higher in 1750 than in 1270, but that it decreased sharply during the Industrial Revolution, and that as a result it was no higher in the mid-nineteenth century than in 1500, though not in 1300. Broadberry et al. (Reference Broadberry, Campbell, Klein, Overton and van Leeuwen2011) tell quite a different story to Allen. They find remarkably little variation and no significant sustained increase in per capita consumption over the entire period between 1300 and 1850. It seems vital to be able to discriminate between these two reconstructions.
Despite the greater availability of data for the 1750–1850 period, the differences remain uncomfortably large. Allen's estimate of calories per diem c. 1750 is nearly two-thirds higher than that of Broadberry et al. Floud et al. (Reference Floud, Fogel, Harris and Chul Hong2011, pp. 160–61) come closest to Broadberry et al. but their estimates, unlike the rest, envisage a rise in calorie consumption after 1800, in which the increasing contribution of imports plays an important role. Muldrew's estimate, supporting a rich and cogent account of material conditions in preindustrial England, is by far the most optimistic of the four. His generous “global estimates of food production,” more than double those of Broadberry et al. for both 1770 and 1800, imply that daily food availability in 1770 reached an average of 5,047 calories per head. That is scarcely credible,Footnote 7 but Muldrew's more modest estimates for 1700 and 1800 are still consistent with an “industrious” labor force that both worked hard and played hard (Muldrew Reference Muldrew2011, p. 161). This finding contrasts sharply with that of Robert Fogel in Escape from Hunger; he interpreted his output estimates as implying that a non-negligible percentage of Englishmen and Englishwomen in this era were too malnourished to work effectively on a regular basis. Fogel reached this striking conclusion by applying a plausible distribution of calories across the entire population to his estimates of mean consumption per head. Roderick Floud and his coauthors (who include Fogel) temper Fogel's earlier results considerably; the former report 2,347 calories for 1750 and 2,439 calories for 1800, whereas the latter reports 2,168 and 2,237 calories, respectively. But the implications of new estimates of food supplies per capita from Stephen Broadberry and his collaborators are as gloomy as Fogel's original numbers.Footnote 8
The four estimates also offer contrasting perspectives on nutritional status during the eighteenth century. While Broadberry et al. envisage essentially no change in calorie consumption over the century, both Allen and Muldrew see a big increase to mid-century, followed by a big decline to 1800, while Floud et al. report increases in each half-century between 1700 and 1850. And while Allen reckons that consumption declined over the century as a whole, Muldrew reckons that it rose. Finally, Broadberry et al. and Floud et al., and to a lesser degree Allen, envisage an increase in the share of animal products in total calorie consumption during the eighteenth century, but Muldrew implies that the opposite was the case. The estimates also disagree on conditions after 1800, with Floud et al. implying improvement in nutritional status and Allen sharp deterioration.
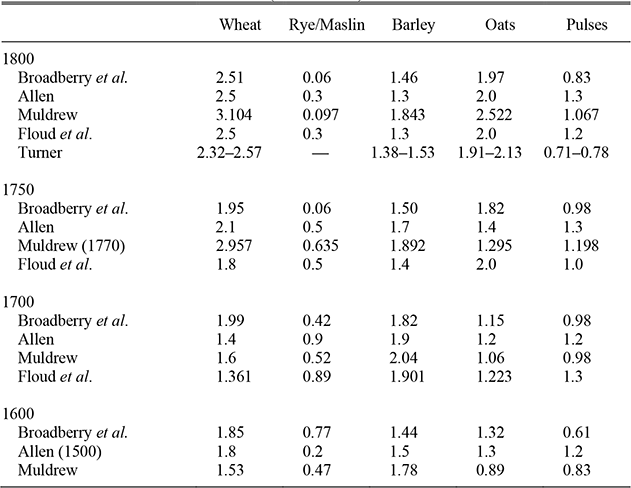
CROP ACREAGES, ENGLAND, 1600–1800 (million acres)
Note:
Allen's and Turner's data refer to England and Wales, while the others refer to England only. Turner's wheat data include rye and maslin.
Sources:
Allen (Reference Allen2005); Muldrew (Reference Muldrew2011, pp. 142–43); Broadberry et al. (Reference Broadberry, Campbell, Klein, Overton and van Leeuwen2011a); Floud et al. (Reference Floud, Fogel, Harris and Chul Hong2011, p. 208); Turner (Reference Turner1981, p. 301); Turner, Beckett, and Afton (Reference Turner, Beckett and Afton2001).
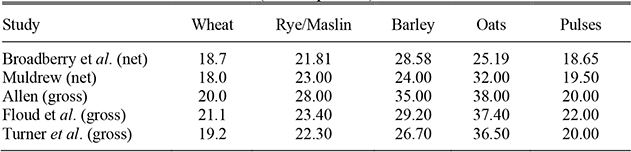
These remarkable differences are rather worrying since, as George Grantham (Reference Grantham1995, p. 74) noted in a similar context nearly two decades ago, “the debate about the level of per caput consumption is… about the more fundamental issue of the long-run dynamics of agricultural supply.” Yet the four estimates do share some common ground. All calculate output for the country as a whole directly, product by product; this is preferable to relying on inferences from budget surveys or models based on “positing a demand curve for agricultural goods” (Allen Reference Allen2000, p. 1). All agree that English consumers obtained the bulk of their calories throughout from vegetable rather than animal sources. Furthermore, the estimates generally do not differ radically in their assumptions about crop acreages and yields (Tables 2 and 3). Muldrew's acreages in 1800 are on the high side, but his crop yield estimates tend to be a little lower than the others. This suggests that most of the differences between the estimates probably stem from contrasting assumptions about the share of production devoted to value added and ending up as calories for human consumption. While it may not be possible to always determine whose assumptions are most plausible, it is still worth discovering which assumptions explain most of the differences.
CROP YIELD ESTIMATES, 1800 (bushels per acre)
Sources:
Allen (Reference Allen2005); Muldrew (Reference Muldrew2011, pp. 142–43); Broadberry et al. (Reference Broadberry, Campbell, Klein, Overton and van Leeuwen2011a); Floud et al. (Reference Floud, Fogel, Harris and Chul Hong2011, p. 208); Turner, Beckett, and Afton (2011, p. 163).
Theory and History
How well do the estimates in Table 1 tally with the empirical findings of development economics and demand theory? Modern income and expenditure elasticities of demand are certainly a poor substitute for hard data, but what are the implications of a plausible expenditure elasticity of demand for food energy measured in calories for the competing estimates in Table 1 (compare Crafts Reference Crafts1983; Reference Crafts and Mokyr1985)? The answer is not straightforward as there is no consensus on a figure for the elasticity. Clark, Michael Huberman, and Peter Lindert (Reference Clark, Huberman and Lindert1995, p. 224) based their choice of a demand elasticity of 0.449 for calories on cross-section evidence on the late-eighteenth-century expenditure patterns of poor households, but Floud et al. (Reference Floud, Fogel, Harris and Chul Hong2011, pp. 97–105) generate a more convincing estimate of 0.26 from the same evidence. Using modern Indian data, Shanker Subramanian and Angus Deaton (Reference Subramanian and Deaton1996) reckon the expenditure elasticity of demand for calories at “0.3–0.5,” but falling as income rises. Several subsequent case studies have also reported positive, albeit low elasticities (e.g., Behrman, Foster, and Rosenzweig Reference Behrman, Foster and Rosenzweig1997; Thomas and Strauss Reference Thomas and Strauss1997; Skoufias, Tiwari, and Zaman Reference Skoufias, Tiwari and Zaman2011; Floud et al. Reference Floud, Fogel, Harris and Chul Hong2011, p. 105; but see too Skoufias et al. Reference Skoufias, Di Maro, Gonzalez-Cossio and Rodriguez Ramirez2009).Footnote 9
AGRICULTURAL OUTPUT AND GDP PER HEAD, 1300–1800
According to Broadberry et al., English GDP per capita trebled between c. 1260 and the mid-eighteenth century. What they dub this “modest but positive trend growth” is troubling for their estimates of agricultural output and average calorific intake, since even very low income elasticities are not easily reconciled with zero sustained improvement in calorie supplies over the same period (see Figure 2). Even an elasticity of, say, 0.2 would indicate a rise of three-fifths in calorie consumption per capita between the thirteenth and eighteenth centuries. This points to a potential tension between Broadberry et al.'s “optimistic” interpretation of income growth in the very long run and their very bleak assessment of the course of calorific consumption over time. It is scarcely conceivable that energy consumption in the medieval era was much lower than the 2,000 calories they assume. A more generous estimate of agricultural output in the late eighteenth century seems absolutely necessary to solve the dilemma posed by their estimates as they stand.
While Broadberry et al. describe an agricultural sector incapable, by implication, of feeding a significant proportion of the population adequately c. 1800 or even c. 1850, their data also describe a sector that was hardly static in the very long run. Their calculations imply that an agricultural labor force that doubled at best between 1381 and 1800 produced a threefold increase in output. However, the increase in estimated agricultural output per head was modest—about 19 percentFootnote 10—and by Broadberry et al.'s reckoning caloric supplies in 1381 exceeded those in 1800 by nearly 300 calories per diem. The divergence between calorie supplies and output is probably explained by a shift in composition of output towards meat and dairy products (see Table 1) and an increase in the production of non-food items such as hides and hay for off-farm horses.
Increased incomes should mean not only more calories, but also more meat and other animal products. An added puzzle, then, is how the rise of two-fifths in food availability per head between 1270 and 1381 (when real wages more than doubled) was linked to an increase in per capita calories from 2,188 calories to 2,447 calories but a reduction in the pastoral share of the total from 19 to 16 percent, while the 28 percent rise food availability between 1381 and 1801 (when real wages fell by about a quarter) was linked to significant fall in per capita supplies from 2,447 calories to 2,165 calories, but in a rise in the pastoral share from 16 to 27 percent (see Table 1). Relative price movements may resolve this puzzle, in part at least: while the price of pastoral products relative to arable products shifted little between c. 1270 and c. 1381, it fell significantly between c. 1381 and c. 1801.Footnote 11
A further complication is that Broadberry et al.'s current estimates mean that calorie consumption per head in England c. 1800 was roughly equivalent to that in contemporary France. Jean-Claude Toutain, a “pessimist” on agricultural productivity during the ancien régime, has proposed a national average of 2,000 calories per head for France at the end of the eighteenth century. Grantham would prefer a somewhat higher total (Toutain Reference Toutain1995, p. 772; Grantham Reference Grantham1995, p. 774; see too Grantham Reference Grantham1993; Fogel Reference Fogel2004, p. 9; Floud et al. Reference Floud, Fogel, Harris and Chul Hong2011, pp. 52–54).Footnote 12 Broadberry et al.'s estimates do not tally either with contemporary English popular opinion, as represented in the cartoons of William Hogarth, James Gillray, and others, that John Bull was much better fed than Louis Baboon.Footnote 13 More concretely, they do not readily square with the common understanding that real wages in mid- and late eighteenth-century London (representing England) were roughly double those in Paris (representing France) (Allen Reference Allen2001). Broadberry et al.'s low estimate is not easily reconciled either with the considerable productivity advantage of English workers over French workers. That advantage is corroborated by the longer life expectancy of the English and their significant height advantage on the eve of the Industrial Revolution (Kelly and Ó Gráda Reference Kelly, Ó Gráda and Daumas2012).
Disappearing Subsistence Crises
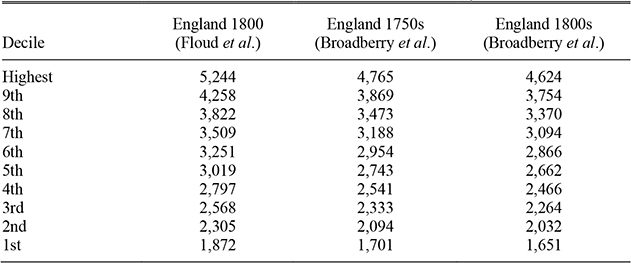
The energy accounting exercises of Fogel imply that a significant proportion of England's population may have been malnourished until the nineteenth century. The implications of Broadberry et al.'s estimates are gloomier still. Table 4 imposes Floud et al.'s hypothetical calorie distribution per male adult equivalent on Broadberry et al.'s estimates of calories per head for the 1750s and the 1800s. If, as this suggests, the bottom decile of the English population subsisted on the equivalent of 1,700 calories per adult male in mid-century and on 1,650 calories in the 1800s, the implications for living standards during the Industrial Revolution are very bleak indeed. The numbers seem implausibly low: they imply that in the late eighteenth century even Broadberry et al.'s median adult male would have been consuming two hundred calories fewer than males in the laboring households studied by Ian Gazely and Sara Horrell (Reference Gazeley and Horrell2013, pp. 767–68)—and that is before the latter factor in beer and self-provisioning.
It does not end there. Note that Table 4 is based on average yields and harvests in a normal year. Year-to-year fluctuations in agricultural output before c. 1800 can only have exacerbated the malnutrition problem initially highlighted by Fogel (Reference Fogel1994). How big were such fluctuations? Hitherto analysis of short-term variations in farm output and food supplies has had to rely on proxy measures such as fluctuations in tithe payments or in grain prices and grain crop yields (Campbell and Ó Gráda 2012). Now, Broadberry et al.'s annual agricultural production series offers a direct measure of year-to-year fluctuations. These series are inferred from manorial accounts, tithe payments, the medieval accounts database assembled by Campbell, probate inventory data and, from the early eighteenth century on, farm account data (Broadberry et al. Reference Broadberry, Campbell, Klein, Overton and van Leeuwen2011a, pp. 3, 11; Campbell Reference Campbell2007).
HYPOTHETICAL DISTRIBUTION OF CALORIES PER MALE ADULT EQUIVALENT BY DECILE
Source:
Derived from Floud et al. (Reference Floud, Fogel, Harris and Chul Hong2011, tables 2.4 and 4.13).
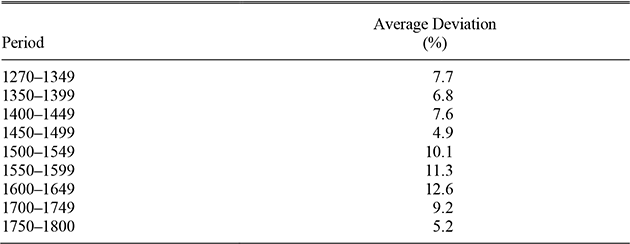
Figure 3 describes the proportionate deviations from a Hodrick-Prescott filter estimated for the 1270–1800 period. It shows that the annual Broadberry et al. series identifies the main harvest deficit years highlighted in the literature very well. Still, the implication that the crises of the sixteenth and seventeenth centuries were more serious—purely in terms of the size of proportionate deviations from trend— than those of the 1310s and 1430s is unexpected and surprising.
Table 5 reports averages of the absolute values of proportional deviations from trend by subperiod between the 1270s and the 1800s. Again, the implication that aggregate output fluctuated much more between 1500 and 1650 than either earlier or later is striking. Perhaps this is a reflection of the lower quality of post-1500 data: whereas those for the pre-1475 period are based on yield data directly recorded in manorial accounts, those for the later period are inferred from probate inventories, using a complex formula that attempts to take account of tithe payments and the putative (rather than the actual) costs of reaping, threshing, and carting (Broadberry et al. Reference Broadberry, Campbell, Klein, Overton and van Leeuwen2011a, pp. 2–3).
Here we are more interested in the finding that implies that output fell by 20 percent or more below trend in fourteen years between 1550 and 1800. These years were 1556, 1577, 1586, 1594, 1596, 1597, 1629, 1630, 1631, 1650, 1659, 1709, 1710, and 1713. Most serious would have been the repeated failures in 1594–1597, 1629–1631, and 1709/10, when the cumulative shortfall reached 40 percent or more. If average calorie intake in noncrisis years was really as low as these data stipulate, then it is difficult to imagine how tens of thousands of those eking out calories near the bottom of the socioeconomic pyramid did not succumb to mass starvation in those years. Yet only in 1594–1597 was there a nationwide famine—England's last truly major famine, when perhaps 1 percent of the population succumbed to starvation and disease. Neither poor relief nor grain imports would have been capable of mitigating the output losses inflicted on the calorie-poor population implicit in Broadberry et al.'s estimates. However, allowing for a secular increase in calorie supplies per head would help explain why a cumulative output shortfall of one-third in 1315/16 led to a catastrophe, while larger cumulative shortfalls in output in 1629–1631 and 1709/10 did not. It would also be easier to reconcile with evidence that while the positive check, in the sense of the short-run response of mortality to price and real wage shocks, was powerful in the Middle Ages, but had virtually disappeared by the late eighteenth century (Kelly and Ó Gráda forthcoming).
AGRICULTURAL OUTPUT, 1270–1800: DEVIATIONS FROM TREND
VARIABILITY OF AGRICULTURAL OUTPUT, 1270–1800
Source:
Broadberry et al. (Reference Broadberry, Campbell, Klein, Overton and van Leeuwen2011a) Data available online at http://www.lse.ac.uk/economicHistory/whosWho/profiles/sbroadberry.aspx.
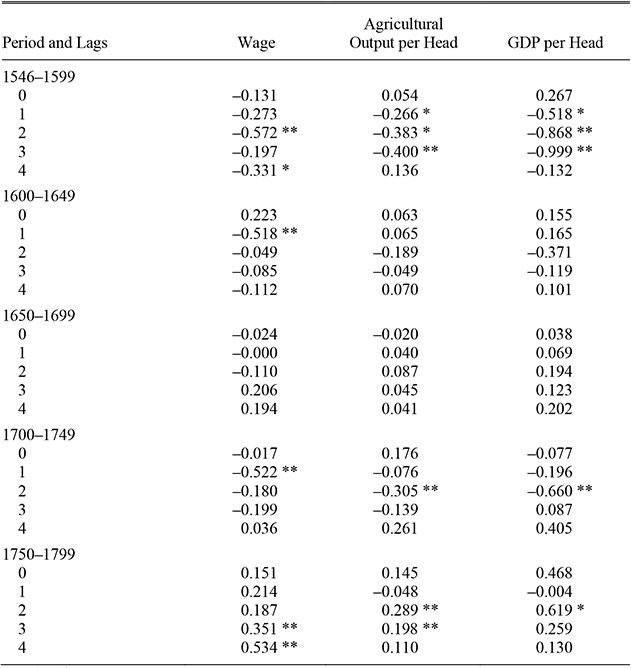
Table 6 reports the estimated response of mortality to fluctuations in three measures of real income for fifty-year intervals from 1546 to 1800. The death rates are those of E. A. Wrigley and R. S. Schofield (Reference Wrigley and Schofield1981); the income proxies are Clark's real wage series and Broadberry et al.'s estimates of agricultural output and GDP per head. Since the variables are transformed into differences of log values, the reported coefficients may be interpreted as elasticities. We ran the death rate on its own lagged values and on current and lagged income; only the income coefficients are reported in Table 6. The outcomes using real wages broadly concur with those found by Kelly and Ó Gráda (forthcoming), who apply the same autoregressive distributed lag (ARDL) estimation methods.Footnote 14 Thus, there is evidence of a strong positive check before 1650 but no significant response in the following half-century, and of a renewed response in 1700–1749 but no adverse impact thereafter. Broadberry et al.'s output estimates corroborate this outcome in some respects; in particular, they capture the impact of adverse shocks on mortality in the first half of the eighteenth century. However, two features of the results using their data are puzzling. First, before 1600 the response of mortality to variations in GDP per head is much stronger than that to variations in agricultural output per head. Second, the lack of a statistically significant response in the seventeenth century is surprising. We suspect that excessive variability in the agricultural output series, which would reduce the estimated mortality response, may partly account for these outcomes.
SHORT-RUN RESPONSE OF THE DEATH RATE TO ANNUAL VARIATIONS IN REAL INCOME
* = Significant at 10 percent.
** = Significant at 5 percent.
Note:
Estimated using robust regressions.
Reconstructing Agricultural Output, 1750–1850
Given the pivotal role of movements in the volume and variability of agricultural output in the early modern era, the huge gaps between the four estimates described above are disconcerting. In this section, we describe what we believe are plausible adjustments to individual components of those estimates. It seems appropriate to focus in particular on the estimates of output and caloric supply by Muldrew and Broadberry et al., since these authors provide the most generous and the most conservative of the four estimates. Bearing in mind Kuznets' and Feinstein's caution, but given also that credible or confidence intervals in the probabilistic sense cannot be calculated, let us consider the estimates of Muldrew and Broadberry et al. as initial upper and lower bounds of the true values. We confine the exercise to 1750–1800, when the gap between the estimates is widest. The implications of our findings for the longer run will be spelt out later.
The details of how historical agricultural output estimates are constructed make dull reading, and so are usually confined to appendices and rarely consulted further. Some of the detail is also relegated to an online appendix here, but most crucial revisions explained in the following paragraphs. This helps highlight what an inexact science estimating past agricultural output is. Most of the focus is on the main cereal crops, which constituted the bulk of output. Less important items are discussed in the Online Appendix.
Tillage crops accounted for the bulk of output and calories throughout. In calculating the output of any crop requires information on acreage cultivated, net yield, and the proportion of production after seed destined for domestic human consumption. Three of the estimates agree broadly on the acreage under crops in 1750 and 1850; Muldrew's estimates (Reference Muldrew2011, pp. 139–44) are clear outliers in this respect (see Table 2).Footnote 15 All four estimates exceed those generated by Michael Turner (Reference Turner1981) from official crop returns for 1801. The crop returns, which were gathered by the parish clergy in the wake of a severe food crisis, offer a useful cross-check on other estimates, even though as Turner, Beckett, and Afton (Reference Turner, Beckett and Afton2001, p. 151) state, they “may not be particularly dependable when used to assess the main parameters of agricultural production,” since farmers feared that the acreages they reported might be used as the basis of extra taxation. Clearly, then, the crop returns must be regarded as lower-bound estimates of the true acreages (Hoskins Reference Hoskins and Hoskins1949, pp. 129–30; Thomas 1958– Reference Thomas1960; Grigg Reference Grigg1967, p. 81).Footnote 16
Wheat: Muldrew's totals for both wheat and the coarser grains c. 1750–1800 are significant outliers. Wheat in the form of white bread has long been the staple food of England. Its preeminent role as a cereal crop is reflected in all four estimates, but Muldrew's estimate (Reference Muldrew2011, p. 143) of the area under wheat in the mid- and late eighteenth century is the highest by far. By simply adjusting his estimates to reflect acreages of 2 million in 1770 and 2.75 million in 1800 (instead of his 2.957 and 3.104 million),Footnote 17 and allowing for milling losses of 20 percent, would reduce his daily calorie supply from wheat from 1,646 to 891 calories in 1770 and from 1,322 to 937 calories in 1800.
Rye: Coarse grains were still a significant item in the English diet in the early eighteenth century. According to E. J. T. Collins, nearly one-third of the population consumed barley, oats, or rye rather than wheat as late as c. 1800. Rye was by far the least important of the coarse grains: Collins rates the relative importance of wheat, barley, oats, and rye c. 1800 at 67:17:15:2 (Collins Reference Collins1975, p. 105; on rye, see also Ashley Reference Ashley1921; Turner, Beckett, and Afton Reference Turner, Beckett and Afton2001, pp. 68–69). These proportions are not readily reconciled with Muldrew's claim (Reference Muldrew2011, p. 143) that coarse grains accounted for 56.3 and 56.1 percent of all calories supplied by cereals in 1770 and 1800, respectively.
Muldrew's figure for rye output in 1770—enough to account for 415 calories of the 3,985 calories supplied daily by all crops (Muldrew Reference Muldrew2011, table 3.14)—is a particularly notable outlier, although his figure for 1800 (generating 56 calories) is consistent with Collins' reckoning that rye accounted for only 2 percent of cereal consumption c. 1800. The unimportance of rye is confirmed by the 1801 crop returns (Turner Reference Turner1981). Yet if Muldrew's estimate of a total of 635,440 acres under rye in 1770—declining very sharply to 97,000 acres by 1800—seems on the high side, the 60,000 acres adopted by Broadberry et al. (Reference Broadberry, Campbell, Klein, Overton and van Leeuwen2011a, table 1) for the entire 1750–1871 period is almost certainly too low for the pre-1800 period. Our standard here is Brian A. Holderness's finding (Reference Holderness and Mingay1989, p. 130) that “the maximum acreage under rye in our period (i.e., 1750–1850) was about 500,000, which in proportion to the land under wheat may be an exaggeration.” That is also the figure adopted by Allen. By this reckoning, Muldrew's estimate of 12.4 million bushels of rye (and therefore 415 calories per day) consumed c. 1770 may be closer to the mark than Broadberry et al.'s 1.5 million bushels. We adjust accordingly, subtracting 165 calories from the former's 1770 estimate and adding 250 and 50 calories to the latter for 1750 and 1800 (Appendix Table 3).
Oats: The contrasting estimates of the contribution of oats require some elaboration. Muldrew (Reference Muldrew2011, pp. 142–43) assumes that a gross production of 80.7 million bushels (i.e., gross yield of 32 bushels per acre on 2,522,000 acres) in 1800 left 67.1 million bushels for human consumption. This generous total stems from choosing a high crop acreage (2.5 million acres, compared to the 2 million acres adopted by Allen and Broadberry et al.), and from two key assumptions regarding oats consumed by horses and the calorie loss from converting oats to oatmeal.
Let us consider the horses first. Allowing an estimated horse population of 0.9 million c. 1800 an annual ration of 6.5 quarters of oats each (Holderness Reference Holderness and Mingay1989, p. 132), and assuming quarters of 320 lbs. and bushels of 40 lbs., would account for 49.3 million bushels in total. By that reckoning, horses and seed requirements (8 million bushels at a minimum) would have consumed 56 million of the 80.7 million at the very least, leaving a maximum of approximately 25 million bushels for human consumption. The more conservative estimate of consumption per horse suggested by Alexander Apostolides et al. (Reference Apostolides, Broadberry, Campbell, Overton and van Leeuwen2008) for 1800 —26 bushels per mature horse—would entail a total of 23.4 million bushels, leaving 49 million bushels for human consumption.Footnote 18 These totals are almost five times and ten times, respectively, the 4.8 million bushels adopted by Broadberry et al. (Table 2). Reducing the area under oats to 2 million acres would narrow these multiples to less than two (7.3 million) and seven (33.2 million). Some of the remaining gap is accounted for by Muldrew's conservative assumption regarding the processing loss from converting oats to oatmeal. He uses 7.5 percent, while Broadberry et al. use 30 percent. Even the latter ratio may be conservative (compare Bourke Reference Bourke1976). Muldrew's estimate of a daily 816 calories for oats in 1800 is therefore almost certainly too generous. Substituting Broadberry et al.'s 14.06 million bushels for Muldrew's 67.14 million bushels would reduce the latter's calorie estimates for 1800 by from 816 to 171 calories, which is also close to the level estimated by Floud et al. We accordingly pare 600 kcals off Muldrew's estimate for 1800, and 250 kcals off that for 1770, but leave Broadberry's estimates unchanged. In sum, insofar as rye and oats are concerned, we reckon that while Broadberry et al. underestimate the role of the former before 1800, Muldrew exaggerates that of the latter, particularly in 1800, by a wider margin.
Barley: Another key difference between Broadberry et al. and Muldrew is the food conversion loss assumed when barley was converted into beer. The former allow a 70 percent loss, while the latter allows only 27 percent. Here the evidence of one abstemious economist—Adam Smith (Reference Smith1976, p. 889)—seems apposite:
In London, a quarter of malt is commonly brewed into two and a half and sometimes into three barrels of porter; and in the country, brewery for common sale the like quantity is seldom made into less than two barrels of strong, and one of small beer, and frequently into two barrels and a half of strong beer.
Using rates of 1 quarter = 348 lbs. and 1 barrel = 36 gallons, and assuming (generously) that a pint of beer or porter contained 250 calories and a pound of barley 1,650 calories, then the quarter of barley (= 384 × 1,650 calories) would have converted into 3 × 36 × 8 × 250 calories in the form of beer. That implies a processing loss of 66 percent, close to Broadberry et al.'s estimate.
However, as Collins (Reference Collins1975) reminds us, not all barley was consumed as beer. Applying a 60 percent loss to Muldrew's estimates of barley output as a rather arbitrary compromise would trim the daily energy supply from by about 550 calories in 1770 and by 400 calories in 1800 (Muldrew Reference Muldrew2011, pp. 143, 147).
All four estimates of agricultural output highlight the importance of cereals and other nonanimal items (Table 1). Our review of the contribution of these items found most of Muldrew's estimates to be overgenerous. Applying alternative assumptions about sown acreages and processing losses narrows the margin between the Muldrew and Broadberry et al. totals considerably. Figures 4A and 4B describe the contributions of different items and these are presented in more detail in Appendix Table 3.
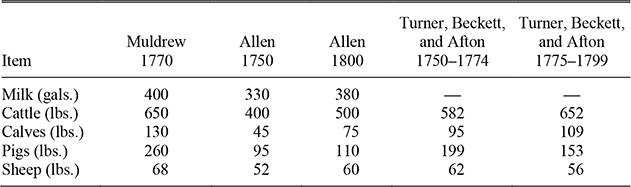
Animal Products: Muldrew's estimates of calories supplied through animal output (meat, eggs, dairy products) are also generally the highest of the four (see Table 1). Part of the gap is explained by his overgenerous allowance of 400 gallons for milk yield per cow (see Table 7). Muldrew's carcass weights c. 1770 are also far higher than those of Allen, but closer to those calculated by Turner, Beckett, and Afton from farm accounts (see Table 7). This may be because Allen's (and Holderness's) are net weights, while the others are gross estimates (Turner, Beckett, and Afton Reference Turner, Beckett and Afton2001, p. 186; compare Fussell Reference Fussell1929). Muldrew's estimates of daily meat consumption per capita in 1770 and 1800 (7 oz. and 6 oz.) dwarf the average achieved by poor rural households in the 1790s (18.3 lbs. per annum). They are also considerably more generous than Holderness's figures of 101 lbs. for 1761 and 100 lbs. per annum for 1801 (which translate to 4.4 oz. per diem). Holderness concedes that his data are “compounded of little hard evidence and much supposition” (Clark, Huberman, and Lindert Reference Clark, Huberman and Lindert1995, p. 223; Muldrew Reference Muldrew2011, p. 153; Holderness Reference Holderness and Mingay1989, p. 155), and Turner, Beckett, and Afton (Reference Turner, Beckett and Afton2001, p. 194) describe their analysis of cattle weights as another “salutary exercise in how much we still do not know, and may never know, about some of the basic parameters.” Broadberry et al. reckon that per capita consumption of meat and dairy products rose from 319 kcals in the 1750s to 385 kcals in the 1800s. Their allowances for meat consumption (using the conversion rates in Floud et al. Reference Floud, Fogel, Harris and Chul Hong2011, p. 210) imply an increase from 261 to 342 kcals, leaving little room for milk consumption. Their estimates of milk output for 1750 and 1800—163 million gallons and 280 million gallons— are distinctly lower than those implied by Holderness, who assumes that the rise in cow numbers from 0.75 million in 1750–1775 to 1 million in 1800 was accompanied by a rise in yield per cow from 330 gallons to 380 gallons (Holderness Reference Holderness and Mingay1989, pp. 162–63, 169).Footnote 19 Turner's review of official inquiries into livestock numbers (Turner Reference Turner1998) yields a “best guess” of 12 to 14 million for the number of sheep c. 1800. This is not far from Broadberry et al.'s 16 million, but the gap between it and Allen's national flock of 20 million, upon which his estimate of sheep meat is based, is yet another reminder of the scope for debate and error in this kind of exercise.
AMENDING ESTIMATES OF CALORIE SUPPLIES 1750/1770
ESTIMATES OF CARCASS WEIGHTS AND MILK PER COW
Sources:
Allen (Reference Allen2005, Table 6); Muldrew (Reference Muldrew2011, pp. 154, 156); Turner, Beckett, and Afton (Reference Turner, Beckett and Afton2001, p. 186) (cattle averages based on their cow and beef cattle data; pig and sheep averages on their averages for “pigs” and “sheep”).
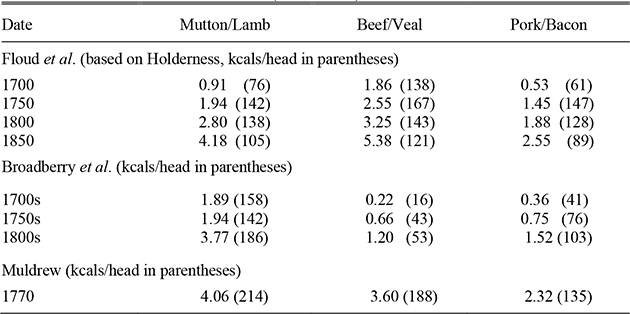
Table 8 compares the competing estimates of meat available for human consumption. Allen and Floud et al. both closely mirror Holderness; we rely on Floud et al.'s estimates here as plausible compromises. Only they (2011, p. 210) allow for lard; they estimate that it generated 52.5 calories per head in 1750 and 45.7 calories in 1800. If we substitute their numbers, including their allowance for lard, that entails increasing the contribution of meat and dairy products in Broadberry et al. by 467 kcals (from 319 to 786 kcals) in 1750 and by 350 kcals (from 342 to 692 kcals) in 1800, and reducing same in Muldrew by 276 kcals (from 1,062 to 786 kcals) in 1770 and 96 kcals (from 788 to 692 kcals) in 1800 (Muldrew Reference Muldrew2011, p. 156; Floud et al. Reference Floud, Fogel, Harris and Chul Hong2011, p. 156). Taken in conjunction with the suggested adjustments to tillage items, the net effect is to increase the share of animal products in the food supply.
MEAT FROM FARM ANIMALS (million cwt.)
Source:
Floud et al. (Reference Floud, Fogel, Harris and Chul Hong2011, p. 210); Broadberry et al. (Reference Broadberry, Campbell, Klein, Overton and van Leeuwen2011a, Table 3); Muldrew (Reference Muldrew2011, p. 145).
Our examination of individual components of agricultural output suggests that significant reductions in Muldrew's proposed crop outputs in 1770 and 1800 are called for. For tillage items, they entail haircuts of about 1,500/1,600 calories in 1770 and 1,100/1,250 calories in 1800; the cuts to meat and dairy items are also significant. Yet such reductions would still leave his case for a reasonably well-fed workforce on the eve of the Industrial Revolution largely intact.
On the other hand, we argue for upward revisions of Broadberry et al.'s numbers that in our opinion enhance the internal consistency of their interpretation of the growth of English productivity in the very long run. For example, we argue that Broadberry et al. have underestimated the contribution of rye—admittedly then a crop of rapidly diminishing importance—in mid-century; allowing it its due share would add about 300 calories to their estimate for c. 1750. Their estimates of meat and milk consumption are also on the low side. There is a good case for adding 300 or more calories to their meat-plus-dairy numbers for both 1750 and 1800, when Floud et al.'s estimate of the contribution of the lard (omitted by both Muldrew and Broadberry et al.) obtained from the fatty tissue of pigs is added on.
In this period, England was almost self-sufficient in food. Still, all four estimates have overlooked one or more imported items in 1750 and 1800. Only Floud et al. (Reference Floud, Fogel, Harris and Chul Hong2011, pp. 157, 159) allow for imports of sugar and wine, accounting for which would add about 90 calories c. 1750 and 110 calories c. 1800 to the other estimates. Allowing for imports of Irish meat and butter and of Scottish cattle would increase Broadberry et al.'s total by a further 60/75 kcals in 1800 and by perhaps 20/25 kcals in 1750. Their total for potatoes in 1800—by which time “untold acres of potatoes [were] grown in small plots or private gardens” (Turner Reference Turner1981, pp. 293–94)—is also arguably on the low side. Other adjustments are explained in more detail in the Appendix.
Taken together, such adjustments add an additional 750 calories per head to Broadberry et al.'s totals c. 1750 and another 400 calories c. 1800.Footnote 20 Our proposed amendments reduce the ratio of Muldrew's estimates to Broadberry et al.'s from 2.1:1 to 1.2:1 for 1750/1770 and from 1.8:1 to 1.1:1 for 1800. They imply a per capita supply of 3,000/3,300 kcals c. 1750/1770 and 2,700/3,000 kcals c. 1800. Note too that the amendments indicate a higher share for more protein-rich foods in both 1750 and 1800, with attendant implications for health and productivity.Footnote 21
The outcome of the adjustments is summarized in Figures 4A and 4B, where they are described in roughly descending order of importance. The upward adjustments to Broadberry et al. that matter are those for meat and dairy products in both periods and for rye in the mid-eighteenth century. The biggest downward adjustments to Muldrew are those for cereal crops in both periods and, to a much lesser extent, meat and fish and poultry in the mid-eighteenth century. Note too the general upward adjustments for items omitted by both parties: lard, sugar, and wine, and Irish and Scottish imports. Except for lard, these involve the difference between domestic agricultural output and the domestic consumption of calories. All of these adjustments serve to raise consumption per capita by about 200 calories for both Muldrew and Broadberry et al.
The changes suggested here build on a broader specialist literature that highlights the uncertainties and complexities of estimating farm output and food supply in the past.Footnote 22 Comparing our suggested totals to a round figure of 2,500/2,600 kcals per head for c. 1850 (see Table 1) would still mean a reduction in per capita supplies relative to 1800 or 1750 (compare Gazeley and Horrell Reference Gazeley and Horrell2013). However, this “pessimistic” verdict may need to be tempered to the extent that Floud et al. and Broadberry et al. have apparently not factored in the contribution of grain imports from Ireland, which would have accounted for about 100 kcals daily per head c. 1850 and perhaps double that before the Great Famine (Floud et al. 2011, pp. 213–17; Mitchell Reference Mitchell1971, p. 98; Ó Gráda Reference Ó Gráda1999, p. 123).Footnote 23
CONCLUDING REMARKS
In the recent past, several scholars—including Muldrew, Broadberry et al., Allen, Clark, and Floud et al.—have embarked on very ambitious projects that unite new data straddling the centuries with competing interpretations of the beginnings of modern economic growth. Keeping all the empirical and theoretical balls in the air at once has not been easy. Critics (e.g., Hatcher Reference Hatcher, Dodds and Liddy2011; Clark, Cummins, and Smith Reference Clark2013; Persson Reference Persson2009, pp. 45–57; Broadberry, Campbell, and Van Leeuwen Reference Broadberry, Campbell, Klein, Overton and van Leeuwen2011; Humphries Reference Humphries2013) have already questioned key aspects of the data underpinning rival approaches. This article has sought to bridge some of the gaps between data and interpretation by pointing to areas where competing estimates of agricultural output and food supply might be reconciled.
In evaluating shifts in the nutritional status of the English, however, several factors apart from calorie supplies complicate the outcome.Footnote 24 First, it is possible that as the share of the total labor force in agriculture fell, the number of calories required for effective work also declined. In the mid-eighteenth century, England's labor force was no longer mainly agricultural: on a recent reckoning, the share of the English male labor force in farming fell from 68 percent c. 1522 to 43.4 percent c. 1700 and 35.7 percent c. 1800 (Broadberry, Campbell, and Van Leeuwen, Reference Broadberry, Campbell, Klein, Overton and van Leeuwen2011; compare Shaw-Taylor et al. Reference Shaw-Taylor, Wrigley, Davies, Kitson, Newton and Satchell2010). More or less simultaneously, urban areas gained relative to the countryside, with the share of the population of England and Wales living in towns and cities of 10,000 or more increasing from 3.1 percent in 1500 to over one-fifth in 1800 (De Vries Reference De Vries1984, p. 39). The shift away from agricultural occupations and towards urbanization may have reduced the daily energy requirements of the average worker relative to earlier centuries.Footnote 25
Against this must be weighed a likely increase in the number of days worked per annum in the early modern era. Clearly, in the towns and cities work was less subject to seasonal lulls than in the countryside, but the new husbandry also increased the year-round demand for farm labor (Timmer Reference Timmer1969). Estimates of the number of days worked in England range widely, although if those widely cited in the literature are at all indicative, some increase in labor intensity is implied (Blanchard Reference Blanchard1978; Voth Reference Voth1998),Footnote 26 perhaps enough to overturn any saving in calorie requirements from urbanization and occupational shifts.
A third possibility is that shifts in the distribution of income led to disproportionate improvements in laborers' welfare. The record is silent on this issue before the late seventeenth century and remains oblique thereafter, but in an influential contribution Peter Lindert (Reference Lindert, Atkinson and Bourguignon2000, Table 1) has made the case for stasis before the mid-eighteenth century, followed by a century of so (c. 1750–1850) of markedly increasing income inequality. In mitigation, before the advent of the New Poor Law in 1838 the impact of rising inequality on food entitlements was blunted by an increasingly generous Old Poor Law.Footnote 27
Our ecumenical estimate of calorie supplies has four important implications for the understanding of nutritional status and productivity on the eve of the Industrial Revolution. First, it makes room for a rise in English calorie supplies in the very long run, in line with—though not the same as—the posited rise in GDP per head. Our compromise estimates for 1750 and 1800 are comfortably higher than both Allen's 1,791 kcals for 1300 and Broadberry et al.'s 2,188 for 1275. They are consistent with an income elasticity of demand for calories of about 0.2, broadly similar to those yielded by analyses of food consumption in present-day less developed countries. Second, by allowing for a margin over the Basal Metabolic Rate that increased over time, they may help explain why crisis mortality lessened over time. England's best-known famine, that of 1315–1318, was arguably also its last “biblical” famine; those of 1437/38 and 1593–1597 were relatively mild, and those of the seventeenth and eighteenth centuries miniscule, by comparison (Dyer Reference Dyer1998, pp. 265–72; Wrigley and Schofield Reference Wrigley and Schofield1981, pp. 645–93). Third, our estimates restore England's calorific advantage over France c. 1750–1800. England at this point was no longer hovering close to subsistence: it was already in a post-Malthusian world where agricultural progress outstripped population growth. And fourth, in the spirit of Muldrew, they allow for the presence of a more “industrious” English labor force, the productivity of which was not constrained by the lack of food before the Industrial Revolution.
Finally, in this article we have confined our attempt at producing compromise estimates of agricultural output and food availability to the second half of the eighteenth century. By then, the share of the agricultural sector had dropped to about 30 percent of GDP (Broadberry, Campbell, and Van Leeuwen Reference Broadberry, Campbell, Klein, Overton and van Leeuwen2011a, Table 7), but our revisions still imply that Broadberry et al.'s GDP estimates for this period may require non-negligible upward adjustment.Footnote 28 Data on key building blocks such as cultivated acreage, carcass weights, losses in processing, and population are much more readily available for the eighteenth and nineteenth than for earlier centuries.Footnote 29 The scope for error and disagreement about calorie supplies and GDP in, say, 1600 or 1300 is accordingly much greater. Broader interpretations of the past based on such data must always highlight this.