Introduction
As a world-class affluent city where its success and prosperity are to be emulated in Asia, Hong Kong has been a strong advocate in free market economy and neo-liberalism. The neo-liberal characters of Hong Kong governance can be observed in its government's non-interventionist role, conservative fiscal policies that restrict public spending and the lack of welfare protection (Lee and Haque Reference Lee and Haque2006). With the hard work and contributions of the Hong Kong people in the past decades, Hong Kong has attained a relatively high standard of economic development among Asian states. Nonetheless, the welfare option available to the Hong Kong people is limited once they have retired from the workforce. The entailing threat of poverty in old age has challenged the neo-liberal approach of the Hong Kong government. Hence, it is significant to study the case of Hong Kong, as the exemplary neo-liberalist governance in Asia, on its government strategy and policies’ adequacy in coping with the ageing population and their welfare provisions. Evidence from Hong Kong may have general implications for other Asian developing countries that are pursuing the path of neo-liberalisation.
Hong Kong's population will age rapidly over the next three decades, with older persons already forming a disproportionately large share of its poor. In 2012, 13.9 per cent of the Hong Kong population was aged 65 and older, a figure which is predicted to reach about 30.3 per cent by 2041 (Census and Statistics Department 2012). The increasing proportion of older adults in Hong Kong calls attention to the issue of poverty in old age. From 2001 to 2011, the number of Hong Kong people living in poverty and the number of households in poverty increased from 1.19 to 1.26 million and from 0.42 to 0.47 million, respectively, based on a poverty line of half the median income (Hong Kong Council of Social Services 2012). Compared with the poverty rates of children and the general population (24.2 and 19.6%, respectively), that of adults aged 65 and above was higher at 33.3 per cent (Commission on Poverty 2012). Like their counterparts in other countries (Mujahid, Pannirsalvem and Doge Reference Mujahid, Pannirsalvem and Doge2008), older adults in Hong Kong face a higher risk of poverty compared to those in other age groups. Impoverished older adults are less likely to escape the poverty trap than their younger counterparts. Poverty among older adults is associated with poorer health and higher functional impairment, higher rates of institutionalisation and spending a higher proportion of income on out-of-pocket health-care services (Hurd Reference Hurd1990).
To tackle the challenges of financial security of the ageing population, Hong Kong has adopted the multi-pillar approach to old-age financial protection recommended by the World Bank (Holzmann, Palacios and Zviniene Reference Holzmann, Palacios and Zviniene2004). The first pillar, funded by general revenues, serves as a social safety net for meeting the basic requirements. In Hong Kong, the first pillar is supported by three programmes financed by tax revenues (Chou, Chow and Chi Reference Chou, Chow and Chi2004), i.e. the Old Age Category of the Comprehensive Social Security Assistance (Old Age CSSA) scheme, the Old Age Living Allowance (OALA) scheme and the Higher Old Age Allowance (HOAA) scheme. Both the Old Age CSSA and OALA are non-contributory and means-tested, with the eligibility of the OALA scheme being open to individuals aged over 65 and has looser asset and income limits than Old Age CSSA. Lastly, the HOAA scheme is universal and requires no means testing, and is available to all adults who reach the age of 70.
The second pillar refers to mandatory and privately managed retirement schemes where individuals’ contributions (usually made as a percentage of earned income) are saved and invested to generate income in retirement. The Mandatory Provident Fund (MPF) system is a privately managed compulsory savings scheme that was launched by the Hong Kong Special Administrative Region (HKSAR) government in 1998. It is compulsory for both employment-based and self-employed persons in Hong Kong aged 18–65 years to be covered by one of the registered MPF schemes. Benefits are paid as a lump sum when individuals reach 65, as a form of retirement protection.
The third pillar refers to voluntary savings made by individuals and support from their families, which is intended to supplement the first two pillars. In the case of Hong Kong, both family support, which mainly derived from adult children (Chou Reference Chou2010; Chou, Chow and Chi Reference Chou, Chow and Chi2004), and private savings contributed to a substantial proportion (58.4 per cent) of the current cohort of older adults. Nonetheless, the third pillar may not be substantially sustained in the coming three decades due to declining fertility rate that reduces the number of adult children, and also to the weakening of intergenerational familial obligations (Chou Reference Chou2010; Logan and Bian Reference Logan and Bian2002; Zimmer and Kwong Reference Zimmer and Kwong2003).
In short, retirement protection in Hong Kong is still underdeveloped (Chou, Chow and Chi Reference Chou, Chow and Chi2004; Chou, Wong and Chow Reference Chou, Wong and Chow2011). The challenge of reforming the retirement income protection system in Hong Kong lies within the dilemma faced by the HKSAR government. Wong pointed out that a neo-liberal state like Hong Kong ‘can provide state welfare beyond the minimum, if a given social policy enhances economic growth’ (Reference Wong2008: 326). However, means-tested social services for the poor are not associated with economic development, especially for older adults who have retired from the workforce. Such is the dilemma faced by the HKSAR government which, on one hand, needs to balance the fiscal management of social policies, while on the other, has to fulfil demands from the general public that do not show much empathy to the poor and the vulnerable.
Income and consumption-based measures of poverty
Due to the impact of the Asian financial crisis, the HKSAR government eventually acknowledged poverty as a social problem in 2000, and yet the first Commission on Poverty was only inaugurated five years later. On 28 September 2013, the Committee on Poverty announced and defined the first official poverty line in Hong Kong, setting it at half of the median of the household income. Based on the concept of relative poverty, this poverty line was selected because household income is more accessible, more readily understood and more internationally comparable than other types of data. It also provides a reasonable guide to the material resources available to household members. However, using household income as the measurement of poverty is particularly problematic for the aged population because they may be ‘asset rich but cash poor’. To overcome this problem, the poverty line for older persons can be measured in terms of consumption by setting the poverty threshold to half the median of household expenditure. Studies show that some older persons are considered poor if income is used as the standard but may not be considered poor if consumption is used, and vice versa (Charles et al. Reference Charles, Danziger, Pounder and Schoeni2006; Hurd and Rohwedder Reference Hurd and Rohwedder2006; Meyer and Sullivan Reference Meyer and Sullivan2003). Therefore, to compare the two measurements, the first objective of this study is to identify the poor older adults by applying both income and consumption measurements, based on the concept of relative poverty.
Absolute measures of poverty
Unlike the relative poverty line, which varies with changes in income distribution, the absolute poverty line remains fixed over time and only needs to be adjusted for inflation. An absolute poverty line is essential if one wants to determine the effect of anti-poverty measures. The threshold could be linked to income from means-tested cash welfare benefits, like the CSSA in Hong Kong, or by applying the poverty standard that the United States of America (USA) developed, based on a food budget using purchasing power parities (Björklund and Jäntti Reference Björklund and Jäntti1997; Bradshaw et al. Reference Bradshaw, Nolan, Maitre and Finch2000). Another way to establish an absolute poverty line is based on budget standards. These standards are not arbitrary because they are designed to derive a basket of goods that will reflect a minimum acceptable standard of living (Ravallion Reference Ravallion1998). The choice of goods and their prices relies on the judgement of experts or the consensual method based on the views of the general public (Bradshaw et al. Reference Bradshaw, Middleton, Davis, Oldfield, Smith, Cusworth and Williams2008). Therefore, the second objective of the study is to identify the poor older adults using an absolute measure of poverty based on both the household income and consumption.
Socio-economic and household characteristics and poverty in old age
There are several vulnerable groups of older persons who are at higher risk of poverty. In the USA, poverty rates are the highest for those aged 85 or older, and rates for older women are nearly double those of men (Banerjee Reference Banerjee2012; Purcell Reference Purcell2009). In 2009, older persons with less education had higher poverty rates, while rates among married couples (4.1%) were much lower than for single older women (20.9%) or men (15.6%) (Banerjee Reference Banerjee2012; Purcell Reference Purcell2009). By examining the characteristics of older persons who may be included or excluded depending on the measure of poverty used, we can assess which measure does a better job of capturing disadvantages. Households headed by a single older adult, especially if that person is a woman, are at higher risk of poverty than those headed by an older couple (Casey and Yamada Reference Casey and Yamada2002); older persons who live alone also have higher poverty rates than those who live with others besides a spouse (Dodge Reference Dodge1995; Waehrer and Crystal Reference Waehrer and Crystal1995). Using data obtained from the Luxembourg Income Study, Tai and Treas (Reference Tai and Treas2009) find that living with more children, fewer older adults and more wage earners reduces the risk of elders being in poverty, as does having a married and better-educated head of household. As such, the third objective of this study is to examine the association of socio-economic and household characteristics with the risk of old-age poverty in Hong Kong, as defined by various different poverty measures.
Method
Respondents
A sampling frame was randomly drawn by the Department of Census and Statistics of the HKSAR government from the General Household Survey local census database (N = 7,000). This sampling frame was chosen because it is the most up-to-date, complete and authoritative source available in Hong Kong. A two-stage stratified sample design was adopted, with records in the frame of quarters first stratified by geographical area and type of quarter. In the first stage, a random sample of quarters was selected. In the second, one household member aged 60 and older in each household was invited to be interviewed using the last birthday method. Individuals aged 60 and above who were living in communities were eligible for inclusion in this study. The age of 60 was used to define Hong Kong older adults as it is the eligible age to receive Old Age CSSA. Of this sampling frame, 6,500 older persons were invited to take part in 2012, of whom 2,194 either refused to participate or could not be contacted after three home visits. Consequently, 4,306 older adults were personally interviewed in their homes, yielding a response rate of 66.2 per cent.
Dependent variables
We used two resource measures, namely household income before tax and household expenditure (reflecting the current standard of living in each household). The respondents were asked whether they had received income in the past month from a number of sources, including wages, family members or friends, government assistance (CSSA, OAA or other), pension, rental income, investment income and other income. Similarly, monthly expenditure was assessed by asking the respondents how much they had spent on the following items in the past month: rent, utilities, food and transportation, educational payments for children, hiring domestic helpers, transfers to other family members living elsewhere, health care and life insurance, tax and other expenditure. For those who owned the home they were living in, rental equivalence was used to capture its consumption value of the home (Fisher et al. Reference Fisher, Johnson, Marchand, Smeeding and Torrey2009).
The amount of all income and expenditure items was measured using a 23-option item based on the US dollar (US $1 = HK $7.8).Footnote 1 The actual amount of income and expenditure was estimated by imputation of the median of the range of all categories except the last (more than US $12,819), which we imputed by the lower bound. We acknowledge that this imputation procedure would have introduced errors into our measurements, but if we had asked for the exact amount of income and expenditure, the non-response rate for these sensitive items would have been high and would introduce non-systematic errors into our data-set. Therefore, we believe that using a range as the response format struck a balance between the accuracy of the answers and achieving an acceptable item response rate.
We used household income and expenditure to assess the poverty status of older persons, assuming that resources were shared equally among all individuals within a household. However, we also needed to account for differences in the household size due to the potential economies of scale for households consisting of more than two persons. Therefore, we adjusted the household income and expenditure by an equivalence scale by dividing household income or expenditure by the square root of household size (Fisher et al. Reference Fisher, Johnson, Marchand, Smeeding and Torrey2009; Garfinkel, Rainwater and Smeeding Reference Garfinkel, Rainwater and Smeeding2006). The thresholds of income and expenditure were US $499 and 481, respectively, for singleton households.
The poverty status of a household was determined by two methods. Firstly, we adopted the relative measure of poverty appropriated by the HKSAR government in 2013 (Commission on Poverty 2013), in which half of the median income is adjusted by household size from the full population. We also defined a group of the ‘near poor’, which refers to those at 150 per cent of the threshold; namely half the median household income or expenditure. We refer to this here as the official poverty threshold, but our income poverty rate will differ from the official poverty rate because it has been modified using a different equivalence scale. Secondly, we used an absolute measure of poverty, namely the median of the CSSA benefit level for households of different sizes. This was chosen because it was the poverty line proposed by the Commission on Poverty in 2004. The thresholds for households of one, two, three, four, five and six or more persons were US $454, 758, 1,025, 1,217, 1,443 and 1,803, respectively.
Independent variable
The demographic control variables included: age; gender; marital status (currently married, widowed, divorced/separated or never married); education level (below elementary, elementary school, high school and college); housing status (owning one's house or not); and the amount of assets held. We created one dummy variable for gender (0 = male, 1 = female), while three dummy variables were created to represent marital status by contrasting widowed, divorced/separated and single with married respondents. We also coded three dichotomous variables for education by contrasting college education with having no formal education, elementary school and high school. Lastly, we assessed the living arrangements by asking the respondents whether or not they were living with their children.
We also asked the respondents to report their possession of four categories of assets, namely (a) cash and savings; (b) stocks, bonds and funds; (c) property they occupied; and (d) property they did not occupy. We then created four dummy variables to indicate whether or not the respondents owned these types of assets. The amount of all these types of assets was measured using a 24-option item based on the US dollar (US $1 = HK $7.8).Footnote 2 Similar imputations (using the median of the range) of income and consumption were performed on these asset values.
Analysis
We firstly examined the income and consumption distribution of older adults and the changes in income and expenditure for different age groups. Following the work of Fisher et al. (Reference Fisher, Johnson, Marchand, Smeeding and Torrey2009), the median was calculated as the mean over the individuals in the ranges between the 45th and 55th percentiles. This provides a better approximation for income and consumption in the middle of the distribution and is less likely to be affected by extreme values, especially for income. Then, we examined the joint distribution of income and consumption relative to the official poverty threshold and the absolute thresholds for three groups: poor, near poor and non-poor. Finally, we looked at the demographic and socio-economic characteristics of the income and consumption poor using both thresholds.
Results
Association of age with income and expenditure
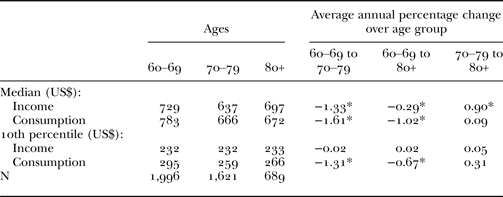
Table 1 shows the income and expenditure at the median and 10th percentiles in three age groups: 60–69, 70–79 and 80+. For those at the median, consumption exceeded income for the younger age groups, namely 60–69 and 70–79, while income was greater than expenditure among those aged 80+. For those whose incomes were at the 10th percentile, consumption consistently surpassed income for all three age groups. Table 1 shows that both the median income and consumption fell by 1.33 and 1.61 per cent per year between the ages of 60–69 and 70–79, but median income increased by 0.9 per cent annually between 70–79 and 80+. On the other hand, at the 10th percentile, consumption decreased by 1.31 per cent between the age groups 60–69 and 70–79, but still exceeded income in three age groups. At the 10th percentile, income remained stable between age groups.
Income and consumption by age

Notes: Median income and consumption are calculated as the mean over the 45th and 55th percentiles. The 10th percentile for income and consumption are calculated as the mean over the 5th and 15th percentiles.
Significance level: * change is significantly different from zero at the 5 per cent level.
Poverty status based on income and consumption
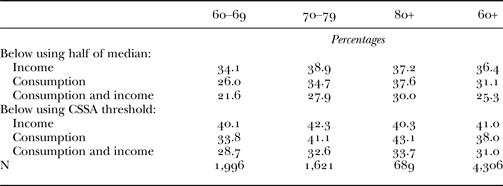
Table 2 presents the proportion of older adults living in poverty using half the median and the CSSA threshold for both income and consumption flows. The poverty rates are measured by before-tax income, consumption and the combination of both. For the official definition of poverty as half the median household income, the poverty rate was 36.4 per cent; using half of the median household consumption, this was reduced to 31.1 per cent. The proportion of those who were poor in terms of both income and consumption dropped to 25.3 per cent. For the fixed poverty threshold defined as the level of CSSA benefits, the rate of income poverty was 41.0 per cent, and for consumption poverty was slightly lower at 38.0 per cent. A lower percentage (31.0 per cent) was found for those who were both income and consumption poor. In short, the poverty rates of older adults based on the absolute threshold were higher than those obtained using the relative threshold. Moreover, for both relative and absolute measures, income-based poverty rates fluctuated slightly across the age groups whereas the percentage of consumption poor and both income and consumption poor increased steadily with age.
Poverty rates using income and consumption measures among adults aged 60 and older

Notes: N = 4,306. CSSA: Comprehensive Social Security Assistance.
Joint distribution of the income and consumption poor
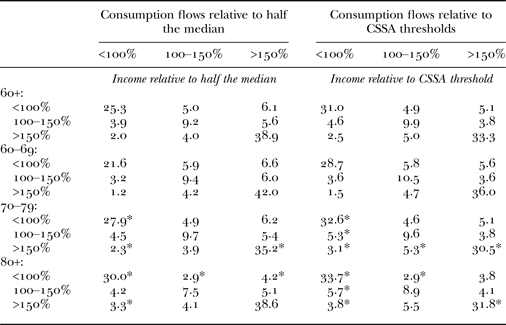
Table 3 compares the distribution between income and consumption for these poverty rates using three categories: poor (below the threshold), near poor (between 100 and 150% of the threshold) and those not in poverty (above 150% of the threshold) for adults in the age groups 60–69, 70–79 and 80+. The sum of the percentages of each 3 × 3 matrix in each age group is 100 per cent. Specifically, 25.3 per cent of older adults aged 60 and older were both income and consumption poor using the official poverty thresholds while 38.9 per cent were not poor in terms of either income or consumption. Both the relative and absolute measures of the poverty threshold showed a similar pattern in terms of comparing the ‘income poor but consumption non-poor’ with the ‘consumption poor but income non-poor’. The percentage of older adults in the former category reduced with age, whereas the percentage of those in the latter increased.
Joint distribution of income and consumption relative to a poverty threshold among adults aged 60 and older

Significance level: * statistically significantly different from the same cell at ages 60–69 years at the 5 per cent level.
Using official relative poverty thresholds, the percentage of older adults with income below the threshold but consumption above 150 per cent decreased from 6.6 per cent at ages 60–69 to 4.2 per cent at ages 80+, while the proportion of those whose consumption was below the threshold but with income above 150 per cent increased from 1.2 per cent at ages 60–69 to 3.3 per cent at ages 80+. These findings are similar to those of Fisher et al. (Reference Fisher, Johnson, Marchand, Smeeding and Torrey2009) in their study of older Americans. They identified a smaller percentage of individuals who were income poor but had consumption above 150 per cent, from 7.6 per cent at ages 55–64 down to 5.9 per cent at ages 75+. Similarly, a greater percentage of individuals were consumption poor but had income above 150 per cent of the threshold, from 0.8 per cent at ages 55–64 up to 1.1 per cent at ages 75+. A similar pattern was also found using the absolute threshold, but this is not consistent with the US absolute poverty measurement (Fisher et al. Reference Fisher, Johnson, Marchand, Smeeding and Torrey2009). A possible explanation for this is that the data used by Fisher and colleagues covers a period of 20 years from 1983 to 2003 and, therefore, the distribution of consumption and income would have changed over time.
Demographic characteristics of the income and consumption poor
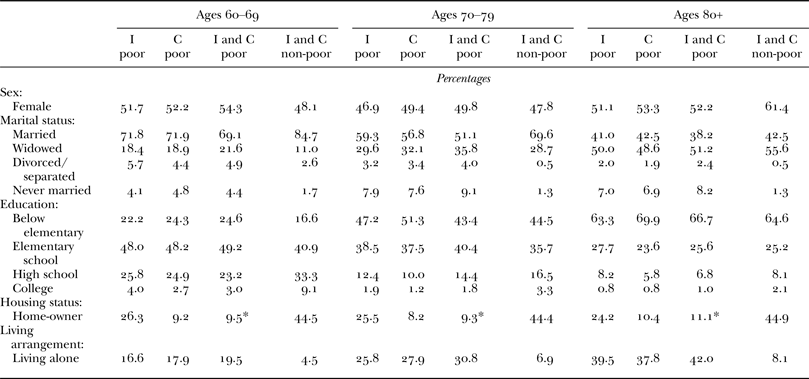
Table 4 shows the demographic characteristics of those who were income poor, consumption poor, both income and consumption poor, and both income and consumption non-poor, for the three age groups. In age groups 60–69 and 80+, women were more likely to be income and consumption poor than men, but men were more likely to be income poor than women among those aged 70–79. More interestingly, the vulnerability of older women was greater in terms of consumption than income poverty across all age groups. Among groups of different marital status, the widowed were most likely to be income and consumption poor among those aged 80 and above. Not surprisingly, even for the two younger age groups, the widowed were disproportionately likely to be income and consumption poor.
Income and consumption poverty status defined by official threshold among adults aged 60 and older by demographic characteristics

Notes: N = 4,306. I: income. C: consumption.
Significance level: * statistically significant for the corresponding demographic characteristic by the three poor groups at the 5 per cent level.
The effect of education on poverty status decreased with age. For instance, for the age group 60–69, the proportion of those without an elementary school education in the income, consumption, and both income and consumption poor categories was greater than those who were non-poor, but the differences narrowed in the other two groups (70–79 and 80+). In terms of living arrangements, the older adults who were both income and consumption poor were more likely to live alone across all age categories. Specifically, about 17 per cent of those who were income poor were singletons but this rose to almost 20 per cent of those who were both income and consumption poor.
Income, consumption and assets
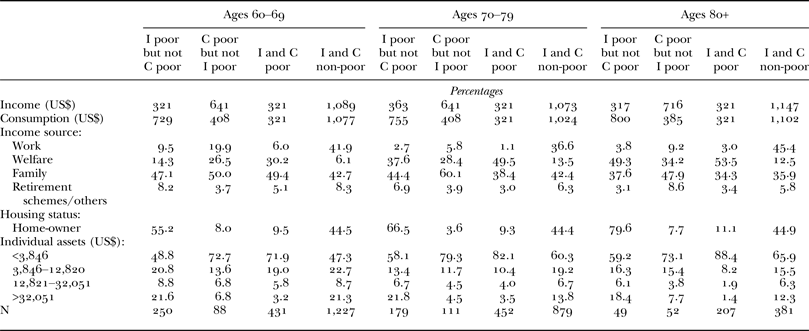
Lastly, we examined why some older adults were poor by using income or consumption, but not both, as the measure of resources. The results for source of income presented in Table 5 help to explain the reason why some were poor in terms of consumption but not income. To illustrate, among those aged 60–69, household income from wages was about 20 per cent for those who were consumption poor but income non-poor, but only about 10 per cent for those who were income poor but consumption non-poor. In other words, the former group had tried to set aside more savings when they or other household members were still working. It is worth noting that their median consumption was still greater than that of those who were both income and consumption poor.
Income and consumption poverty status defined by official threshold among adults aged 60 and older by income, consumption and assets

Notes: N = 4,306. I: income. C: consumption.
Discussion
In the study on China's older adults (Pak et al. Reference Pak, Shen, Strauss, Zhao, Smith and Majmundar2012), poverty rates based on consumption expenditures were lower than the income poverty. It was mainly due to the high savings rates in China, which is most likely triggered by the inadequacy of social protection in the light of rapid commercialisation and urbanisation (Chamon and Prasad Reference Chamon and Prasad2010). Similarly, in pursuing the objectives of this study, we compared the differences in two measures of poverty. As much as the HKSAR government is concerned with the growing population of poor older adults, the report of the Commission on Poverty (2013: 11) admitted to limitations in the relative poverty measurement. As illustrated in this study, measuring income alone does not accurately capture the poverty situation of older adults, given that the poorest 10th percentile shown in Table 1 had maintained a nearly unchanged income from the age of 60. Measuring consumption solely on the basis of expenditure is also problematic, insofar as the data could exceed actual consumption due to the volatility of a short-term survey (Johnson Reference Johnson2004). Hence, it is the combination of both income and consumption measures which produces a more accurate measurement of the poorest older adults.
In addition, our findings suggest that poverty increases with age if a consumption measurement alone is used, and also if it is combined with an income measurement. As expected, there is no linear relationship between income poverty and age. This makes sense because most older people are retirees who no longer hold down a regular job. Interestingly enough, the study on older Americans shows that poverty reduces with age whether the resources measure is based on income or consumption (Fisher et al. Reference Fisher, Johnson, Marchand, Smeeding and Torrey2009; Hurd and Rohwedder Reference Hurd and Rohwedder2006). Also, the poverty rates for Hong Kong elders reported here are substantially higher than for older Americans (Fisher et al. Reference Fisher, Johnson, Marchand, Smeeding and Torrey2009). This remains the case whether a relative or absolute poverty threshold is used. Poverty rates ranged from 3.6 to 7.8 per cent in the USA but from 21.6 to 33.7 per cent in Hong Kong. We believe the differences are likely to arise from the retirement income protection systems of Hong Kong and the USA. Fisher et al. state that ‘the economic preparations of older Americans, combined with public programmes, have almost eliminated poverty if defined jointly by income and consumption’ (Reference Fisher, Johnson, Marchand, Smeeding and Torrey2009: 765). The enactment of the Social Security system in the USA since 1935 has a great impact on the retirement arrangements of American older adults. Engelhardt and Gruber (Reference Engelhardt and Gruber2004) found that Social Security benefits managed to drive the decline of poverty of American older adults aged 65 and above, establishing the role of Social Security as a contributor to old-age poverty decline.
However, in the case of Hong Kong, the neo-liberal nature of the government has prompted the state to act against redistributive social programmes. Since the colonial period, the former government exercised residual welfare, where a safety net was to provide minimal support for the vulnerable ones (Lee et al. Reference Lee, Chan, Chan, Cheung, Lam and Lam2013: 69). In the 1996 Policy Address, the Hong Kong colonial government stated, ‘Quite deliberately, our welfare system does not exist to iron out inequalities. It does not exist to redistribute income’ (Hong Kong Government 1996: para. 78). Thus, it is no surprise that the HKSAR government, which inherited the paradigm of public administration from the former colonial government, still practises ‘positive non-interventionism’, in addressing its social policies (HKSAR 2011). Apart from the first-pillar old-age protection, the decision to implement the MPF rather than to introduce a universal state pension is further evidence of a dominant neo-liberal preference, since the MPF can yield a return by developing the financial industry in Hong Kong.
We also found that women in two age groups (60–69 and 80+) were more likely than men to be income poor, consumption poor and both. These findings are partially consistent with studies conducted in the USA (Fisher et al. Reference Fisher, Johnson, Marchand, Smeeding and Torrey2009; Johnson, Smeeding and Torrey Reference Johnson, Smeeding and Torrey2005). As coined by Pearce (Reference Pearce1978), feminisation of poverty depicts the disadvantages and deprivation that women encountered in the income and welfare system, causing them to be more prone to the risk of poverty. In the United Kingdom (UK), Price (Reference Price2006) revealed that the disadvantaged position of British females in the structure of the UK pension system exposed them to higher risk of poverty. The gendered phenomenon of poverty was also found in Hong Kong since Hong Kong women were ‘more likely to experience poor wages, lower job security, fewer employment opportunities, a weaker earning history, and consequently, lower levels of accumulated economic resources’ (Lee Reference Lee2003: 47). Our finding shows that feminisation of poverty remains a pertinent issue in Hong Kong.
Moreover, across all age groups, the widowed made up a greater portion of those who were both income and consumption poor than those who were either. Again, these findings match the work done with older Americans (Dodge Reference Dodge1995; Fisher et al. Reference Fisher, Johnson, Marchand, Smeeding and Torrey2009). Also, older adults who lived alone were more likely to be income poor, consumption poor or both, especially those in the oldest age categories of 70–79 and 80+. In the age group 60–69, about 20 per cent of those who were both income and consumption poor were singletons and for those aged 80+, this figure rose to 42 per cent. These findings coincide with the study on China's urban households (Saunders and Sun Reference Saunders and Sun2006), where the Chinese older adults aged 60 and above who live alone, especially female, are prone to poverty.
Finally, we have examined the differences between the four groups of respondents in terms of income, consumption, income sources, housing status and assets. Our findings indicate that among those who were income poor but not consumption poor, median consumption was more than twice their income at the median across all age groups. These individuals are well prepared for negative income or expenses shocks because they are able to draw on their savings. Our results show that almost 20 per cent of people in this position had assets worth more than US $32,051. In contrast, the older adults who were both income and consumption poor were particularly vulnerable because both their income and consumption were close to or even lower than that of the other three age groups. Most were likely to be dependent on family support and welfare payments to make ends meet and held a very low amount of assets.
As pointed out by Jefferson (Reference Jefferson2012), there are practical limitations to consumer-based measurements of poverty. The sample size of our study would be considered relatively small in terms of calculating consumer expenditure, compared to the official income-based data-set. Due to the possibility of fluctuations in the amount of income and expenditure, our research design can be improved by having measurements at several time-points, which would produce more reliable and consistent data. Also because of a lack of agreement among researchers, methods of including health-care spending in a poverty measurement may lead to different results (Hurd and Rohwedder Reference Hurd and Rohwedder2006). Another limitation is that we equated expenditure with consumption, although the two can be disentangled by including another variable, namely the cost of time (Aguiar and Hurst Reference Aguiar and Hurst2005).
Conclusion
Through the analysis presented here, we have succeeded in identifying the poor older adults by using two different measures of poverty: relative and absolute. Evidence from Hong Kong suggests that income alone may not be a good indicator of poverty status for older adults because a portion of the income poor are actually not poor at all if their assets are taken into account. Our findings suggest that about 30 per cent of the income poor belong to this group, who can be described as income but not consumption poor. This underlines the urgent need for Hong Kong policy makers to identify the poorest among the older population more accurately. To understand fully the economic wellbeing of older adults in Hong Kong, we propose combining both income and consumption measures when analysing poverty rates. The joint distribution of income and consumption poverty can better identify and explain the demographic characteristics of the poor older adults. Although it is unlikely that the Hong Kong government would change its neo-liberal approach to welfare provisions, the high poverty rates among older adults and the increase in consumption poverty with age are alarming signs of the inadequacy of welfare protection.
Acknowledgements
This study was supported by a research grant from the Council for Strategic Public Policy Research (HKIEd 7001-SPPR-11) and the Humanities and Social Sciences Prestigious Fellowship Scheme (38600214).