

Including minority ethnic groups in politics is important to guard against democratic instability and ethnic conflict (Cederman, Wimmer, and Min Reference Cederman, Wimmer and Min2010; Lijphart Reference Lijphart1977). Normatively, minority representation can increase a group’ s legitimacy, draw attention to their interests in deliberation, and provide them with recognition (Kymlicka Reference Kymlicka1995; Mansbridge Reference Mansbridge1999; Phillips Reference Phillips1995; Young Reference Young2002). However, there are concerns that the descriptive representation of minority groups in politics essentializes individuals to a single key identity and presumes intra-group unity, even where there are often differences (Dovi Reference Dovi2002; Pitkin Reference Pitkin1967). This article attends to these theoretical concerns and explores how minority representation affects the role of identity in political behavior and how this shapes electoral politics.
Prior empirical studies have investigated how minority political representation impacts a range of outcomes, including distributive benefits, inter-group relations, party decisions, and voter behavior. On the one hand, minority representation can be empowering by encouraging more minority elites in politics, greater political participation and trust from minority citizens, and sometimes targeted benefits for them (Bhalotra, Clots-Figueras, and Iyer Reference Bhalotra, Clots-Figueras and Iyer2018; Bobo and Gilliam Reference Bobo and Gilliam1990; Fraga, Juenke, and Shah Reference Fraga, Juenke and Shah2020; Gulzar, Haas, and Pasquale Reference Gulzar, Haas and Pasquale2020; Keele et al. Reference Keele, Shah, White and Kay2017; Pande Reference Pande2003; Rocha et al. Reference Rocha, Tolbert, Bowen and Clark2010; Washington Reference Washington2006). On the other hand, minorities who make it to power are still electorally accountable to majority group members and political parties, which limits the substantive representation they can provide to their group (Chauchard and Jensenius Reference Chauchard and Jensenius2023; Dunning and Nilekani Reference Dunning and Nilekani2013; Jensenius Reference Jensenius2017). Moreover, a minority in power can generate a backlash from the dominant group, especially in cases without institutional protections (Bustikova Reference Bustikova2019; Zonszein and Grossman Reference Zonszein and Grossman2024; Reference Zonszein and Grossman2025).Footnote 1 This article presents an argument and evidence highlighting the unintended consequences of descriptive representation. I demonstrate how the political gains for minority groups can create the conditions for their electoral demise, revealing the perils of power.
I argue that minority political representation changes the incentives and behavior of elites and voters in both the minority and dominant groups. These changes can generate two perils of power: (1) minority political behavior is more structured around sub-identities and (2) majority political behavior is more heavily based on their dominant group identity. This happens for two reasons. First, for a minority candidate to win, they often need cohesive support from their minority group. Being in power can reveal to the minority group whether their coethnic representative ultimately delivers on minority voters’ high expectations or if only some minority members benefit. A minority ascending to power can also boost intra-minority competition as challenger elites emerge and mobilize their sub-identity groups to attract support. The combination of minority voter perceptions of the incumbent coethnic and new elites activating divisions can lead the political behavior of the minority group to be structured along their sub-identities, such as tribe, caste, sect, place of origin, or language. Second, when a minority comes to power, some members of the majority may begin to perceive a challenge or a change in their status quo dominance. This trend can be exacerbated if a minority politician tries to balance delivering to the minority with tending to dominant group members who voted for them. Majoritarian elites can also seek to activate a dominant group identity by mobilizing against the minority incumbent. The combination of a perception of changing majority group dominance and mobilization efforts by majoritarian elites can lead the majority group to engage in politics based on their dominant group identity. Under some circumstances, these two perils of power can come together to generate a process I call the representation trap, in which power can create the conditions for political demise.
I examine the observable predictions of my argument by conducting an in-depth study of Indian Muslims, a group at the center of debates about India’s democratic challenges (Allie Reference Allie2025; Varshney Reference Varshney2022). I provide evidence that minority power shifts the way in which identity structures Muslim and Hindu political behavior, which has implications for electoral politics. This multi-method study analyzes election data, evidence from an original survey, and insights from qualitative interviews conducted during fieldwork. I first use a regression discontinuity design to show that the close election of a Muslim (rather than Hindu) politician increases the share of Muslim candidates, disperses votes across the viable Muslim candidates, and consolidates votes for the majoritarian Bharatiya Janata Party (BJP) in the subsequent election. Since aggregate election data cannot clearly disentangle the behavior of Hindus and Muslims, I surveyed nearly 5,000 Hindu and Muslim voters in the northern Indian states of Uttar Pradesh and Bihar. I fielded the survey just across constituency boundaries with and without a Muslim representative to measure the impact of having a Muslim representative on both groups’ voting behavior. I observe that in constituencies with a Muslim representative, Muslims are more likely to split their votes and Hindus who previously voted for a Muslim are more likely to switch to the BJP.
I draw on nearly 150 elite and voter interviews and a preregistered vignette experiment from my original survey to illuminate the causal logic rooted in changes in the role of identity in political behavior for both groups. The qualitative and experimental evidence demonstrates a Muslim division on sub-identities (such as sub-caste or jati) and a Hindu consolidation on a dominant group identity due to changes at the elite and voter levels. These findings reveal that Muslim success can be used to generate a form of electoral backlash and that underexplored sub-identities among Muslims can become politically salient.
The theory and evidence advance our understanding of ethnic politics, political representation, and democratic inclusion. Whereas existing work emphasizes how group demographics and institutions shape which identities are politically mobilized and where such mobilization succeeds, I offer a more dynamic account of ethnic politics centered on representation itself. The article develops a unified framework for understanding how representation shapes the behavior of both minority and dominant groups, in contrast to existing scholarship, which often examines these groups separately.Footnote 2 It also attends to the behavior of both elites and voters within the minority and dominant groups. I show how minority political power changes the ways that ethnic political entrepreneurs (such as parties and candidates) mobilize identity and how ordinary voters experience minority power in a way that makes these elite appeals resonate. In doing so, the article underscores that the study of minority politics must explicitly theorize how inclusion simultaneously reshapes the behavior of actors in both dominant and minority groups.
The results reveal the headwinds that descriptive representation can create for broader inclusion. Some studies suggest that ethnic minorities may be limited in what they can deliver for their group once they gain power (Dunning and Nilekani Reference Dunning and Nilekani2013; Jensenius Reference Jensenius2017). This article reveals that beyond falling short of delivering, minority representation can also have more dire consequences for electoral politics that may hinder sustained inclusion. This suggests that beyond electoral rules and compositional factors that can restrict minority representation (Dancygier Reference Dancygier2014; Gerring, Jerzak, and Öncel Reference Gerring, Jerzak and Öncel2024), their representation itself can shift politics in a way that contributes to their political challenges.
This study builds on emerging research on heterogeneity within marginalized groups by exploring how Muslim sub-identities obstruct political coordination and promote divisions. Intra-group dynamics play a key role in political phenomena, such as ethnic conflict, public goods provision, and participation in contentious politics (Cammett, Chakrabarti, and Romney Reference Cammett, Chakrabarti and Romney2024; Fearon and Laitin Reference Fearon and Laitin1996; Habyarimana et al. Reference Habyarimana, Humphreys, Posner and Weinstein2009; McClendon Reference McClendon2018). A growing body of work highlights the importance of examining heterogeneity within ethnic and racial categories.Footnote 3 This article reveals how intra-group heterogeneity, particularly along sub-identities, is activated by the groups’ political power.
Finally, the argument and findings advance our understanding of India as a democracy. The country’s democratic survival despite ethnic divisions is an enduring puzzle for the study of democracy and scholars have long debated whether the country was indeed consociational (Lijphart Reference Lijphart1996; Varshney Reference Varshney1998; Wilkinson Reference Wilkinson2006). The micro-dynamics of Muslim political power highlighted in this article suggest that even if India’s democracy did exhibit some consociational qualities in the past, ethnic cleavages contributed to exclusionary politics even before the more recent rise in majoritarianism. A rich political science literature examines the role of religious and caste identity in India.Footnote 4 This article’s focus on the agency and political experience of Indian Muslims highlights the underexplored dimensions of caste within the Muslim community and advances our understanding of religious identity in post-independence Indian democracy.Footnote 5
THE PERILS OF POWER
Minorities face significant challenges in gaining elected office. Their group size can be disadvantageous in politics, especially in plurality systems that favor numerical majorities but also in other electoral systems (Cox Reference Cox1997; Dancygier Reference Dancygier2014; Lublin Reference Lublin2014). In cases where coethnicity with a representative can signal access to material and psychic benefits, minority ethnic groups may struggle to mobilize voters outside their group (Chandra Reference Chandra2007; Horowitz Reference Horowitz1985). Despite these obstacles, some minority candidates do obtain their party’s nomination, gain votes across ethnic groups, and win office without the help of institutional protections, such as quotas or majority–minority districting.Footnote 6 Overcoming the representation hurdle is a strong signal that a minority represents a viable political group accepted by voters (Marschall, Ruhil, and Shah Reference Marschall, Ruhil and Shah2010). If a minority candidate can do this, we may expect them to sustain their inclusion and push for broader acceptance by party elites and voters. After all, electing a minority demonstrates a movement toward inclusion. I argue instead that when minorities gain power, it can change the incentives and behavior of political elites and voters in a way that divides the minority group and consolidates the dominant group, creating the conditions for political demise. Under some conditions, these two perils of power can generate a representation trap that reverses the minority group’s progress.
How Power Divides the Minority Group
Minority voters often have high expectations when a minority is elected due to the perception that coethnicity with a politician is more likely to provide material and nonmaterial benefits (Chandra Reference Chandra2007; Fearon Reference Fearon1999; Horowitz Reference Horowitz1985). These expectations are reinforced when minorities have high group consciousness (McClain et al. Reference McClain, Johnson, Carew and Watts2009). Because winning typically requires mobilizing cohesive support from the entire minority group, minority voters are more likely to expect the politician to represent the group as a whole.
Keeping this minority voting bloc together can be difficult once in power. Several challenges emerge when minority voters assess whether the politician is delivering on their high expectations. First, while identity groups may have shared interests, they also display significant heterogeneity, making it hard to satisfy all sub-groups even when they were mobilized collectively (Dovi Reference Dovi2002). Second, minority politicians often mobilize minority voters by emphasizing their shared exclusion. Once in power, appeals about exclusion may resonate less among voters. Finally, while all politicians face obstacles to delivery, minority politicians typically have fewer resources, weaker networks with bureaucrats and senior politicians, and less governing knowledge (Auerbach, Singh, and Thachil Reference Auerbach, Singh and Thachil2025; Jensenius Reference Jensenius2017). These constraints make it more likely that the minority politician’s actions will fall short for the group as a whole and begin to reveal which sub-groups they favor.
Beyond the challenges of delivering while in power, additional hurdles can emerge at the elite level. When a minority wins political office, especially in cases where they do so without institutional protections, it provides a signal to other elites and political parties that a minority victory is possible. In the case of gender and ethnicity, representation has had the impact of bringing more members from the group into elite-level politics as candidates or in the party organization (Bhalotra, Clots-Figueras, and Iyer Reference Bhalotra, Clots-Figueras and Iyer2018; Bhavnani Reference Bhavnani2009; Goyal Reference Goyal2020; Shah Reference Shah2014). However, while the emergence of more minorities at the elite level increases numerical inclusion in politics, it can also introduce complications for the incumbent minority.
These new minority challengers can function as ethnic entrepreneurs who seek to mobilize the minority group by drawing on particular identity-based symbols to differentiate themselves and highlighting what the incumbent is doing wrong (Brass Reference Brass1974; Laitin Reference Laitin1998).Footnote 7 I argue that challenger minority elites will seek support, at least initially, from a sub-group in the minority that is most similar to them. This could mean members from their locality, economic strata, or sub-identity, with the latter being most likely because ethnic identity is easily observed and relatively fixed (Chandra Reference Chandra2007). The support of a sub-identity gives the challenger a credible base so that voters may perceive them as viable, which can improve their chances of being nominated by a party. By mobilizing a sub-identity within the minority population, challenger elites can activate divisions within the minority group. When the minority incumbent views the challenger elites as viable competition, they may also try to cater to their own sub-identity within the minority population to retain a core portion of the minority vote. Previous work notes that preferential distribution can often be targeted to sub-groups rather than the entire minority group (Chauchard Reference Chauchard2017, 166).
In sum, when a minority gains power, minority voters begin to learn whether the coethnic politician can deliver on the high expectations that the entire group has, setting up at least some subgroups to be let down. This is exacerbated by intra-minority elite competition from newly emerged challengers who seek to activate subgroups in the minority to gain their political footing. The combination of these elite and voter processes can make minority political behavior more likely to be structured around sub-identities.
How Power Consolidates the Dominant Group
Dominant group voters who supported the minority previously often do so with the view that the minority candidate will be constrained by a party to not just represent minority interests. Previous work suggests that this is possible. When elected, minorities are often brought into elite party structures and function as any politician would; they do not just provide for the minority (Dunning and Nilekani Reference Dunning and Nilekani2013; Jensenius Reference Jensenius2017). Yet, while parties and electoral incentives constrain aggregate preferential treatment of the minority group, minority politicians often do have an intrinsic interest in attending to their coethnics (Bhatiya et al. Reference Bhatiya, Dinneen, Grossman and Zonszein2025; Broockman Reference Broockman2013) and, in some cases, they can deliver benefits to their own (Chauchard Reference Chauchard2017; Gulzar, Haas, and Pasquale Reference Gulzar, Haas and Pasquale2020; Pande Reference Pande2003). Moreover, some members of the minority who have greater access to a politician may behave in a way that emphasizes the growing power of the minority group relative to the dominant group. These forces make it more likely that the majority group voters resonate with the mobilization of their dominant group identity against the minority. This argument is rooted in prior work on group threat where majority groups can view minority groups as a threat when they are perceived to grow in power (Blalock Reference Blalock1967; Giles and Evans Reference Giles and Evans1986). Empirical tests of this theory note that various forms of backlash—including hate crimes, supporting anti-minority parties and candidates, and negative attitudes toward the minority group—can increase in response to an increase in minority power (Bustikova Reference Bustikova2019; Cikara, Fouka, and Tabellini Reference Cikara, Fouka and Tabellini2022; Zonszein and Grossman Reference Zonszein and Grossman2024; Reference Zonszein and Grossman2025).
A minority victory can also incentivize some political elites to double down on exclusion and seek to mobilize the dominant group based on its superordinate identity. In multiple contexts, political parties and candidates are grounded in the exclusion of particular groups. For example, the Alternative für Deutschland in Germany often mobilizes against immigrants, the Justice and Development Party in Turkey against ethnic minorities, and Vox in Spain against Catalans and Basques. Witnessing a member of the minority group come to power indicates that a nontrivial share of members of the dominant group were willing to vote for the minority candidate. This can make majoritarian elites more likely to mobilize on a dominant group identity. The tactic can help entrench those already on board with their view and convince dominant group members who previously supported a minority to switch. With a minority in power, majoritarian elites have a clear target for their mobilization. Elites may believe majoritarian mobilization tactics will resonate more in places with a minority incumbent and may prioritize this rhetoric in those places.
In sum, when a minority gains power, members of the dominant group evaluate whether (and how) this impacts them. Some of them may perceive a change in their status quo dominance if they see minority voters behaving differently. Majoritarian elites or parties can exacerbate this view among voters by highlighting the threat that the minority incumbent poses to the dominant group. The combination of these elite and voter processes can make it more likely that the majority group’s political behavior becomes structured on its superordinate dominant group identity.
The Representation Trap
So far, I have argued that minority power can drive two changes in how identity shapes political behavior: it can (1) divide minorities, leading them to approach politics based on their sub-identities and (2) consolidate the dominant group, leading them to approach politics based on their superordinate identity. When these two perils of power come together, minorities can experience what I call a representation trap, in which their gains in power can undermine their subsequent prospects. In what contexts and for which groups should the representation trap be more likely?
Minority power is most likely to produce divisions when the group has meaningful internal heterogeneity and includes strong elites who can mobilize those differences. Intra-minority divisions are more costly when they are not cross-cutting cleavages. However, where elites can share power or voters have incentives or norms to remain unified, divisions may be less likely to emerge from minority power. At the same time, minority power can prompt dominant group consolidation when majoritarian elites are powerful and able to mobilize a superordinate identity. It is less likely when such elites are weak, cross-group ties are strong, or inequality within the majority undermines a shared identity. These dynamics further depend on minority group size. Districts with very small minorities are unlikely to see minority power, while those where minorities are demographically dominant may retain power even if fragmented. The dynamic is most likely in places where minorities enjoy some electoral leverage but do not constitute a majority of the constituency. The argument, therefore, builds on existing theories that emphasize that group size is a key determinant of ethnic politics (Chandra Reference Chandra2007; Dancygier Reference Dancygier2017; Posner Reference Posner2005), by showing the dynamic nature of politics in places where minorities are demographically relevant.
The representation trap produces a divided minority and a consolidated dominant group. These two processes are linked. Intra-minority challengers can pressure minority politicians to direct finite resources and attention within the minority group. This can reduce outreach to dominant voters and fuel grievances that majoritarian elites can mobilize. These elites can also portray the emergence of intra-minority challengers as expanding minority power. While dominant group mobilization might encourage minority unity, this would require coordination among minority elites, which can be challenging when they are more attuned to their within-group differences. The perils of power—minority division and dominant consolidation—can therefore feed off of one another, making them likely to co-occur. In the conclusion, I discuss whether groups learn over time and the longer-term implications.
The argument centers on minorities in power, though some dynamics apply to identity-based representation more broadly. For example, politicians claiming to represent an identity group often struggle to satisfy all sub-groups and may face internal challengers or coordinated opposition. Still, the burden of representation for minorities is particularly acute. First, the marginalized status of many minority groups can make it more challenging for them to effectively deliver when in office, while also making it easier for them to be targeted by opposing candidates.Footnote 8 Second, because minorities are numerically smaller, they must appeal to a coalition of coethnics and non-coethnics to win and their internal divisions can be more consequential. Finally, the nature of being a marginalized minority might also mean that when they gain representation, especially when this is done without institutional protections, the group may develop high expectations of what this may mean for their inclusion and prospects. This can create higher expectations among minority voters and make more of them interested in contesting for power.
CONTEXT AND MIXED-METHODS APPROACH
This article provides empirical evidence of the observable electoral implications of the representation trap and details and tests components of the causal logic. In the previous section, I highlight several factors that can increase the likelihood that we observe both perils of power, but I do not leverage variation in these factors to establish that the representation trap is more common in some places or among some groups compared to others. Rather, I focus on the case of Indian Muslims, one of the largest minority groups in the world’s largest democracy. In the conclusion, I return to the broader scope conditions and where else this logic may apply.
Muslims constitute 14% of India’s population and have no explicit institutional protections at any level of government. Scheduled Castes (SCs) and Scheduled Tribes (STs) have reservations at the national, state, and local levels, while women have reservations at the local level. In some states, Other Backward Classes (OBCs)—educationally and socially disadvantaged groups—have reservations at the local level. While some Muslims can contest seats reserved for women and OBCs, they are not considered institutional protections for Muslims as they are not dedicated only to Muslims. Figure 1 illustrates that while the share of Muslims in India has increased, the share of Muslims in elected office at the state and national levels has not improved. This is expected in a single-member district plurality system like India’s; however, it highlights that the small gains in representation did not last. Along with low political representation (Farooqi Reference Farooqi2019), Muslims have experienced poor socio-economic outcomes (Asher et al. Reference Asher, Jha, Novosad, Adukia and Tan2026; Asher, Novosad, and Rafkin Reference Asher, Novosad and Rafkin2024), segregation and prejudice (Jaffrelot and Gayer Reference Jaffrelot and Gayer2012; Majumdar Reference Majumdar2026; Susewind Reference Susewind2017), marginalization from India’s national narrative (Haas and Lindstam Reference Haas and Lindstam2024), and communal violence (Jha Reference Jha2013; Varshney Reference Varshney2002; Wilkinson Reference Wilkinson2006).
Muslim Representation at the National and State Levels, 1962–2021
Note: MLA is a Member of the Legislative Assembly (state level) and MP is a Member of Parliament (national level). For the percent of Muslim MLAs, I calculate the percent of Muslim MLAs across all states in five-year time periods and plot the value for the middle year in the range, except for the first time period which covers 1964–71.

Figure 1. Long description
The X-axis represents Year from 1960 to 2020 in 20-year increments. The Y-axis represents Percent from 0 to 20 in increments of 5. Three lines track different metrics.
* Percent of Muslims in Population: A thick black line starting at approximately 11 percent in 1962, showing a steady upward trend with minor plateaus, reaching roughly 14 percent by 2020.
* Percent of Muslim M L As: A light blue line starting around 8 percent in the late 1960s. It remains relatively stable between 6 and 8 percent until 2015, before dropping toward 5 percent by 2020.
* Percent of Muslim M Ps: A dark green line showing high volatility. It starts below 5 percent in 1962, peaks near 9 percent around 1980, fluctuates downward to approximately 5 percent in the late 1990s, rises briefly in the mid-2000s, and ends just below 5 percent in 2020.
The gap between the population percentage and the political representation percentages widens significantly over the observed period.
Several factors make Muslims in India a case where we would be likely to observe the representation trap. First, there is meaningful heterogeneity within the Muslim population, especially on caste (Ahmed Reference Ahmed2019). While prior political science studies have extensively studied caste among Hindus, caste among Muslims has received less attention. Islamic doctrine does not formalize a caste system, yet accounts of Muslims in South Asia highlight the role of caste in everyday life (Ahmad Reference Ahmad1966; Trivedi, Goli, and Kumar Reference Trivedi, Goli and Kumar2016). Muslim castes generally fall into three categories: the ashraf are descendants of foreign Muslims who brought Islam to the subcontinent, the ajlaf are mostly converts from the “clean occupational” Hindu castes, and the arzal are largely converts from the “untouchable” castes (Ansari Reference Ansari1960; Levesque Reference Levesque2020). Non-ashraf Muslims (sometimes referred to as OBCs) are increasingly mobilizing politically and socially under the name Pasmanda or “those left behind” (Allie Reference Allie2024; Azam Reference Azam2023). Each category contains specific jatis or sub-castes. Moreover, caste does not function as a cross-cutting cleavage across Hindus and Muslims, but rather as a nested identity within Muslims and within Hindus. A Muslim’s jati is a salient identity marker: 0.1% of Muslims in the survey I describe below did not identify or know their jati. Other sub-identity divisions also matter among the Muslim population, such as sect.
The second reason the representation trap is likely to apply to Muslims in India is that the prominent majoritarian party, the BJP, has ideological and organizational roots in the Hindu nationalist movement making mobilizing a dominant Hindu identity more accessible to them (Allie Reference Allie2025; Jaffrelot Reference Jaffrelot2021; Thachil Reference Thachil2014).
Finally, while India has a first-past-the-post electoral system, multiple parties and independent candidates often contest in each constituency, resulting in an overall mean effective number of parties of 3.0 (median of 2.6) in state elections during my time frame of focus. India’s electoral system thus allows us to directly observe how minority politics becomes structured based on sub-identities after a minority gains power. In India, the emergence of challenger intra-Muslim elites can result in more candidates representing different sub-groups within the Muslim population. And because state elections in India often involve multiple viable parties, we can observe the new Muslim elites as candidates in those parties. While parties are crucial to voting behavior in India (Chandra Reference Chandra2007), prior work also highlights that parties pursue candidate-centric strategies at the local level and that voters pay attention to candidates, not just party labels (Chauchard Reference Chauchard2016; S. Singh Reference Singh2015).
To examine the observable implications of my argument, I use a mixed-methods design. First, I analyze constituency-level election data, leveraging an RD design to test how closely electing a Muslim representative affects the aggregate electoral politics of Muslims and Hindus in the next election. Second, because aggregate election data do not contain information on voting behavior by religious group, I use an original survey of Hindu and Muslim voters fielded across constituency boundaries to examine changes in voting behavior by Hindus and Muslims separately. Third, drawing on elite and voter interviews and observations at party meetings and election rallies, I demonstrate the causal logic using a case study of constituencies in the district of Meerut in Uttar Pradesh. I supplement the qualitative evidence with a preregistered, ethnographically informed vignette experiment to test the key mechanisms driving division and consolidation. While there are limitations of each individual approach; taken together, the varying forms of evidence all point in the direction of the theoretical argument that I lay out. Replication data are available at Allie (Reference Allie2026).
THE ELECTORAL CONSEQUENCES OF MINORITY REPRESENTATION
My argument yields two observable implications after a Muslim gains power. First, I expect an increase in the share of Muslim candidates in the next election, along with a fragmentation of votes across them, suggesting that sub-identities structure Muslim political behavior. Second, I expect increased support for the BJP, suggesting that a dominant superordinate identity shapes Hindu behavior.
Election Data and Design
State Assembly Election Data
I focus on state assembly elections across India from 1977 to 2007 (Agarwal et al. Reference Agarwal, Agrawal, Bhogale, Hangal, Jensenius, Kumar and Narayan2022). These elections are theoretically important because they are the lowest level at which party politics matters and because Members of the Legislative Assembly (MLAs) regularly interface with citizens to provide constituency service, respond to claims-making, and deliver development (Bussell Reference Bussell2019; Kruks-Wisner Reference Kruks-Wisner2018). The 1977–2007 period constitutes the longest-lasting electoral delimitation in India where constituency boundaries remained constant.Footnote 9 Theoretically, this period also represents the time before the rise of Narendra Modi nationally in 2014, allowing the effects to be distinct from the current brand of the BJP’s Hindu nationalism. I focus only on “general” constituencies, excluding those reserved for SCs and STs.
Assigning Religion through a Character-Based Algorithm
The key independent variable of interest is the winning candidate’s religion. Formal election information does not contain this information, so I use three India-specific name-to-religion algorithms and expert-coded religious identity from SPINPER Project (2024) to classify candidate religion.Footnote 10 Section A of the Supplementary Material provides further details. For the time period and types of constituencies I focus on, the algorithm codes about 10.5% of candidates as Muslim. Since Hindus and Muslims constitute about 94% of India’s population according to the 2011 Census, I label those who are not coded as Muslim based on the algorithms as Hindu and refer to the non-Muslim candidates as Hindu throughout the rest of the article for simplicity. Figure 2 displays the variation in Muslim representation over time in 12 key states where Muslims make up a substantial share of the population. In all states, Muslim representation fluctuates over time and rarely reflects their proportion within the population. Even small fluctuations offer an opportunity to understand the challenge of sustaining Muslim representation.
Muslim State Representation over Time, 1960–2022
Note: This figure plots representation over time for 12 states with a sizable Muslim population. Representation is calculated based on the number of Muslim MLAs divided by the total constituencies that are part of the state in the particular year (e.g., after the 2014 bifurcation, Andhra Pradesh no longer includes the seats that are now part of Telangana). Delhi’s legislative assembly was created in 1991, so the representation displayed before that is for the elected council.

Figure 2. Long description
The Y-axis is Percent of Constituencies with a Muslim M L A and the X-axis is Year. Each panel contains a solid black line with points representing actual representation and a horizontal dashed blue line representing the 2011 Muslim population percentage in that state.
* Andhra Pradesh. Representation remains steady near 5 percent, well below the 10 percent population line.
* Assam. Representation fluctuates between 15 and 30 percent, peaking around 1990, remaining below the 35 percent population line.
* Bihar. Representation stays near 10 percent, below the 17 percent population line.
* Delhi. Representation starts in 1991, fluctuating between 5 and 10 percent, below the 13 percent population line.
* Gujarat. Representation shows a downward trend from 5 percent toward 0, below the 10 percent population line.
* Karnataka. Representation fluctuates between 2 and 8 percent, below the 13 percent population line.
* Kerala. Representation shows an upward trend from 15 to 25 percent, nearing the 27 percent population line.
* Madhya Pradesh. Representation is very low, near 2 percent, below the 7 percent population line.
* Maharashtra. Representation stays flat near 5 percent, below the 12 percent population line.
* Tamil Nadu. Representation is low, near 5 percent, fluctuating around the 6 percent population line.
* Uttar Pradesh. Representation shows high volatility, peaking near 18 percent before a sharp drop after 2010, staying below the 19 percent population line.
* West Bengal. Representation trends upward from 12 to 20 percent, remaining below the 27 percent population line.
Regression Discontinuity Design
To determine how a Muslim win (at time t) affects subsequent political outcomes (at time
$ t+1 $
 ), I use a close election RD design. I compare constituencies that closely elected a Muslim to those that did not. The logic is that these constituencies will be relatively similar on other dimensions except that a Muslim just won instead of a Hindu.
Focusing on close elections allows me to estimate the causal effect of a constituency having a Muslim MLA on various outcomes. However, close elections between a Hindu and a Muslim are also of theoretical interest. Constituencies with close elections represent places where Muslims could realistically come to power, making them important sites for possible Muslim inclusion.Footnote 11 So while the RD will estimate a local average treatment effect, this effect represents crucial cases for Muslim representation in India. Two states that make up a large share of the close elections are Uttar Pradesh and Bihar. Both have sizable Muslim populations with intra-group caste heterogeneity, a greater number of competitive parties, and a notable presence of the majoritarian BJP. These underlying factors make us more likely to observe both perils of power (division and consolidation). Section C of the Supplementary Material provides additional descriptive statistics on the elections included in the RD design.
I use the following RD model specification:

$ {Y}_{i,t+1} $
 are dependent variables, which denote a range of political outcomes in
$ t+1 $
 , including Muslim candidacy, measures of vote concentration among Hindu and Muslim candidates, and BJP performance.Footnote
12 All outcome variables are described in detail in Section B of the Supplementary Material.
$ MuslimWi{n}_{i,t} $
 is the treatment indicator for whether a Muslim won in constituency i in election year t.
$ f({M}_{i,t}) $
 is the running variable, which is the vote share difference between the Muslim and Hindu candidates in the top two positions in the previous election. The sample includes only elections where a Hindu and a Muslim were in the two top spots. The running variable takes negative values when a Hindu wins and positive values when a Muslim wins.
The RD is a politician characteristic RD (PCRD), for which there are at least two associated challenges. First, the politician’s characteristic of interest may be correlated with other characteristics that could confound the analysis (Marshall Reference Marshall2024). For example, Muslim candidates could be more likely to be from the Congress Party, so religion and party could be driving the effect. Second, PCRDs can involve estimating the effect of characteristics, such as religion as well as compensating differentials that impact whether the election is close (Marshall Reference Marshall2024). For example, if Muslims tend to face more voter discrimination relative to Hindus, then for a Muslim to be in a close election against a Hindu, they may need to be substantially more “competent.” This would mean that close elections between a Hindu and a Muslim would, on average, involve a more competent Muslim competing against a less competent Hindu. The compensating differential of competence would therefore be an additional difference beyond religion for the winner and loser. Given these constraints, the quantity of interest in the RD,
$ \tau $
 , should not be interpreted as the effect of religious identity on voting outcomes, but rather as the effect of electing a Muslim politician and the bundle of accompanying characteristics that come with being a Muslim politician.
In Section C of the Supplementary Material, I assess the validity of the RD design. I conduct a McCrary Test to show that there is no evidence of selective sorting on either side of the discontinuity (McCrary Reference McCrary2008), ensure that there is smoothness in pretreatment outcomes, show balance on a range of dimensions for the elections on either side of the cutoff and conduct ex-post power calculations to show that the design generally has sufficient power to detect the effects on which I observe significant changes (Stommes, Aronow, and Sävje Reference Stommes, Aronow and Sävje2023).
Muslim Win Divides Muslims
I report the RD results to establish that a Muslim win divides Muslims electorally. The RD examines how Muslim representation affects Muslim candidacy, vote share for all Muslims, and the concentration or fragmentation of votes among all Muslim candidates and more competitive Muslim candidates (measured by the Herfindahl–Hirschman Index, or HHI). I provide additional details on constructing these measures in Section B of the Supplementary Material. Table 1 presents these results. A Muslim win increases the percent of Muslim candidates by 5.84 percentage points, the percent of major party candidates who are Muslim by 5.75 percentage points, and the percent of all candidates that are Muslim independents by 3.39 percentage points.Footnote 13 In all elections with a Hindu and a Muslim in the top two positions during the study period, the average of the constituency-level percent of Muslim candidates is 30% and the constituency-level percent of Muslim candidates among major party candidates is 37% (reflecting an increase of 15%–20% of these means). Moreover, the average of the constituency-level percent of independent Muslim candidates is 12%, indicating that a Muslim win leads to a 29% increase from this mean. These findings align with effects found in other work on how representation can promote the political entry of the represented identity (Bhalotra, Clots-Figueras, and Iyer Reference Bhalotra, Clots-Figueras and Iyer2018; Bhavnani Reference Bhavnani2009; Fraga, Juenke, and Shah Reference Fraga, Juenke and Shah2020; Goyal Reference Goyal2020). Relevant to the case of Muslims in India, for example, Bhalotra, Clots-Figueras, and Iyer (Reference Bhalotra, Clots-Figueras and Iyer2018) also find an increase in Muslim candidates after a Muslim win in their analysis of elections across 16 Indian states from 1980 to 2007. Section D of the Supplementary Material reports additional results, such as an increase in the percent of “winning party” candidates who are Muslim and the percent of all new candidates who are Muslim. I also detect an increase in the number of Muslim candidates; however, this is not statistically significant. These findings, along with the results on the increased Muslim independents, suggest that it is not only that the incumbent party renominates a Muslim but also that new challenger Muslims emerge through political parties and as independents.
Effect of Muslim Win in t on Muslim Politics in
$ t+1 $


Table 1. Long description
The table presents regression results across seven columns representing political outcomes in t plus 1.
Column 1: Pct Muslim candidates.
Column 2: Pct major party Muslim candidates.
Column 3: Pct Indep. Muslim candidates.
Column 4: Muslim vote share.
Column 5: All Muslim H H I.
Column 6: Muslim H H I Top 5.
Column 7: Muslim H H I Top 3.
Row 1: Muslim win, t.
Column 1: 5.84 with two asterisks.
Column 2: 5.75 with one asterisk.
Column 3: 3.39 with two asterisks.
Column 4: 0.02.
Column 5: minus 0.03.
Column 6: minus 0.07.
Column 7: minus 0.09 with two asterisks.
Row 2: Standard errors in parentheses.
Column 1: 2.42.
Column 2: 3.11.
Column 3: 1.59.
Column 4: 0.03.
Column 5: 0.03.
Column 6: 0.04.
Column 7: 0.04.
Row 3: Observations.
Column 1: 1,438.
Column 2: 1,389.
Column 3: 1,515.
Column 4: 1,300.
Column 5: 1,062.
Column 6: 440.
Column 7: 289.
Row 4: Bandwidth selection is C C T for all columns.
Row 5: Bandwidth.
Column 1: 13.46.
Column 2: 12.68.
Column 3: 14.7.
Column 4: 13.18.
Column 5: 14.22.
Column 6: 7.9.
Column 7: 11.5.
Row 6: Polynomial is 1 for all columns.
Note: The unit of analysis is a constituency-election year. The dependent variable is a Muslim win in
$ t+1 $
 . Bias-corrected estimates are reported with robust standard errors clustered at the constituency level (Calonico, Cattaneo, and Titiunik Reference Calonico, Cattaneo and Titiunik2015).
$ {}^{*}p< $
 0.1;
$ {}^{**}p< $
 0.05;
$ {}^{***}p< $
 0.01. Bandwidth is selected using the one common MSE-optimal bandwidth from the rdrobust package for all models. The polynomial row indicates the order of the local polynomial used to construct the point estimator. The results are robust to alternative specifications, which are provided in Section D of the Supplementary Material.
In terms of voting, while we do see a positive effect of a Muslim win on the vote share for all Muslim candidates and a negative effect on HHI among all Muslim candidates, these effects are not significant. There is, however, a decrease in the HHI (measuring consolidation) among Muslims in the top 5 that is just below statistical significance (
$ p=0.11 $
 ) and among Muslims in the top 3 which is statistically significant.Footnote
14 This finding demonstrates that voters will disperse their votes among Muslim candidates after a Muslim win, particularly when there are viable options.Footnote
15 The result relates to other work which notes that Muslim voters in India prefer a coethnic if they have a realistic chance of winning (Devasher Reference Devasher2024; Heath, Verniers, and Kumar Reference Heath, Verniers and Kumar2015). The theoretical argument also suggests that minority divisions are likely when the intra-minority elite challengers who emerge are viable enough that their challenge impacts the minority incumbent. Moreover, the finding highlights the crucial role that parties play. That is, when viable parties nominate these challenger Muslims, they are more likely to split the Muslim vote.
Muslim Win Consolidates Hindus
I examine how a Muslim win affects BJP nomination behavior, Hindu vote consolidation, and BJP performance. Section B of the Supplementary Material provides additional details on these measures. During the study period, the BJP engaged in majoritarian efforts, such as the Ram Rath Yatra and exclusionary rhetoric. By focusing on the outcomes related to the BJP, I can capture voters’ political support for majoritarianism and consolidation against Muslims. Consolidation for the BJP would support the theoretical argument, which expects consolidation to be due to majoritarian mobilization. If voters were coordinating around a Hindu candidate from a different party, majoritarian mobilization would be playing less of a role.
Table 2 presents the results. First, there is no statistically significant change in BJP decisions about whether to field a candidate or whether to field a Muslim candidate. Thus, after a Muslim wins, the BJP continues to field Hindu candidates; only 1.3% of all BJP candidates were Muslim during the study period. While there is not a statistically significant increase in the HHI among all Hindu candidates, I find two positive and substantively meaningful effects on the BJP’s performance—an 8 percentage point increase in its vote share and a 22 percentage point increase in the likelihood of a BJP win.Footnote 16 I examine additional outcome variables in Section D of the Supplementary Material and detect a decrease in the share of Hindu candidates. I also continue to see vote consolidation measured by HHI when looking at top 3 and top 5 Hindu candidates. Moreover, a Muslim win does not change the vote share for the highest non-BJP Hindu candidate. These findings suggest that a Muslim win can consolidate Hindus in favor of majoritarianism through voting for the BJP.
Effect of Muslim Win in t on Hindu Politics in
$ t+1 $


Table 2. Long description
The table contains five columns representing dependent variables for voting outcomes in time t plus 1.
* Column 1: B J P fielded candidate.
* Column 2: B J P fielded Muslim.
* Column 3: Hindu H H I.
* Column 4: B J P win.
* Column 5: B J P vote share.
The primary row, Muslim win in time t, shows the following coefficients and standard errors in parentheses:
* Column 1: minus 0.06 with standard error 0.06.
* Column 2: minus 0.03 with standard error 0.02.
* Column 3: 0.04 with standard error 0.03.
* Column 4: 0.22 with three asterisks indicating p less than 0.01, with standard error 0.05.
* Column 5: 0.08 with three asterisks indicating p less than 0.01, with standard error 0.03.
Supporting data rows:
* Observations: 1,337 in column 1; 1,370 in column 2; 1,494 in column 3; 1,141 in column 4; 854 in column 5.
* Bandwidth: 12 in column 1; 12.46 in column 2; 14.86 in column 3; 9.72 in column 4; 10.2 in column 5.
* Bandwidth selection: C C T for all columns.
* Polynomial: 1 for all columns.
Note: The unit of analysis is a constituency-election year. The dependent variable is a Muslim win in
$ t+1 $
 . Bias-corrected estimates are reported with robust standard errors clustered at the constituency level (Calonico, Cattaneo, and Titiunik Reference Calonico, Cattaneo and Titiunik2015).
$ {}^{*}p< $
 0.1;
$ {}^{**}p< $
 0.05;
$ {}^{***}p< $
 0.01. Bandwidth is selected using the one common MSE-optimal bandwidth from the rdrobust package for all models. The polynomial row indicates the order of the local polynomial used to construct the point estimator. The results are robust to alternative specifications, which are provided in Section D of the Supplementary Material.
Muslims Struggle to Maintain Power
The results from the election analysis tell a complete story. After a Muslim gains power, Muslim voters divide their votes across viable candidates from the increased number of Muslim candidates and Hindu voters come together specifically for the BJP. This evidence is consistent with the theoretical expectation that Muslim power restructures Muslim political behavior around sub-identities and focuses Hindu political behavior on their dominant group identity. Together, these two perils of power can make it difficult for Muslims to maintain power. I test whether this is the case by estimating the effect of a constituency having a Muslim MLA in t on the likelihood of having any Muslim politician in
$ t+1 $
 . I allow the Muslim politician in
$ t+1 $
 to be from any party to avoid constraining the effect to only individual-level or party-level anti-incumbency.
Table 3 reports the RD results for the effect of a Muslim win in t on a Muslim win in
$ t+1 $
 . A Muslim win decreases the likelihood of a future Muslim win by 11–18 percentage points across a range of model bandwidths and polynomial orders and in models with and without covariate adjustments. Because the Muslim and Hindu variables are opposites of one another, the finding that a Muslim win lowers the likelihood of any future Muslim win suggests that a Hindu win also makes a subsequent win from any Hindu less likely. When outlining the logic of the representation trap, I crucially note that the process by which representation leads to division and consolidation could theoretically occur in any identity group. The RD finding illustrates that this is also the case for Hindus in close elections between Hindus and Muslims. However, the types of elections covered in the RD (those that are close and those with a Hindu and a Muslim in the top two spots) make up 4% of the cases in which a Hindu wins (defining close election as within a margin of victory of 12%). This means that while the close election RD is informative for Muslims since these election types comprise a large share of Muslim victories, they are not informative of the broader experience of Hindu wins in India. Moreover, it is not clear whether voters interpret the election of a Hindu candidate as a representation of the Hindu identity. In many cases, voters view a Hindu in power more on caste lines than on religious lines. By contrast, given Muslims’ status as a marginalized minority, voters often perceive them as potentially representing the Muslim identity. This suggests caution in analyzing the result as relevant to majority group representation.
Effect of Muslim Win in t on Any Muslim Win in
$ t+1 $


Table 3. Long description
The table presents results for the dependent variable Muslim win, t plus 1. It is organized into eight columns numbered 1 through 8.
* Row 1: Muslim win, t. The coefficients are negative across all models: -0.12, -0.16, -0.17, -0.18, -0.11, -0.15, -0.16, and -0.16. All values are marked with double asterisks indicating p < 0.05.
* Row 2: Standard errors in parentheses. Values range from 0.06 to 0.08.
* Row 3: Observations. The count increases from 417 in column 1 to 1,872 in column 4, and from 451 in column 5 to 1,858 in column 8.
* Row 4: Bandwidth. Values range from 3.21 to 21.76.
* Row 5: Bandwidth selection. All columns use C C T.
* Row 6: Polynomial. Columns 1 and 5 use 0; columns 2 and 6 use 1; columns 3 and 7 use 2; columns 4 and 8 use 3.
* Row 7: Covariate adjustment. Columns 1 through 4 are blank; columns 5 through 8 are marked with a checkmark.
The note specifies that bias-corrected estimates are reported with robust standard errors clustered at the constituency level.
Note: The unit of analysis is a constituency-election year. The dependent variable is a Muslim win in
$ t+1 $
 . Bias-corrected estimates are reported, with robust standard errors clustered at the constituency level (Calonico, Cattaneo, and Titiunik Reference Calonico, Cattaneo and Titiunik2015).
$ {}^{*}p< $
 0.1;
$ {}^{**}p< $
 0.05;
$ {}^{***}p< $
 0.01. Bandwidth is selected using the one common MSE-optimal bandwidth from the rdrobust package for all models. The polynomial row indicates the order of the local polynomial used to construct the point estimator. The results are robust to alternative specifications, which are provided in Section D of the Supplementary Material.
The finding that a Muslim win lowers the likelihood of a subsequent Muslim win relates to prior work on incumbency disadvantages in developing democracies such as India (Klašnja and Titiunik Reference Klašnja and Titiunik2017; Lee Reference Lee2020; Schiumerini Reference Schiumerini2025; Uppal Reference Uppal2009). These anti-incumbency effects examine an electoral disadvantage for the same individual or party in the next election. This theoretically relies on voters making assessments of the particular candidate or party (Jensenius and Suryanarayan Reference Jensenius and Suryanarayan2022). The findings in this section reveal that assessments of candidates of a particular identity can inform how voters view candidates from that identity in the next election, especially in ethnically divided democracies like India. This suggests that an incumbency disadvantage and the representation trap are not mutually exclusive explanations. Rather, in some ways, the findings related to the representation trap may help elucidate another mechanism for why some candidates or parties may face a disadvantage when they field a minority candidate.
Robustness and Contextualizing the Findings
The main RD findings generally hold in a series of robustness checks. Section D of the Supplementary Material provides an RD plot for each outcome; it shows that the results are generally robust to different bandwidths and models with and without covariates, and reports donut-hole RD robustness tests. In Section D of the Supplementary Material, I contextualize the findings by discussing how they can be interpreted in the context of the decline of the Congress Party (Chhibber Reference Chhibber2001; Dasgupta Reference Dasgupta2018) and the rise of regional parties (Ziegfeld Reference Ziegfeld2016), which I see as key contextual factors that contribute to the results.
INDIVIDUAL-LEVEL CHANGES IN VOTING BEHAVIOR
While the election data provide evidence for aggregate outcomes, there is value in triangulating across various methods. I use an original survey to study individual-level changes in voting behavior among Muslims and Hindus and provide additional evidence of divisions and consolidation.
Survey Data and Design
I administered an original face-to-face survey of 2,436 Muslim and 2,422 Hindu voters in the states of Uttar Pradesh and Bihar across 83 assembly constituencies (ACs). This represents one of the largest political surveys of Muslims in India.Footnote 17 Section E of the Supplementary Material describes the sampling, ethical considerations, and details of my survey, and presents the demographic characteristics of the sample.
I use the survey to test whether Muslim voters will be more likely to split their vote across Muslim candidates when they have a Muslim MLA, and whether Hindu voters who previously voted for a Muslim would be more likely to switch to the BJP after having a Muslim MLA. I collect vote choice for state assembly elections for the past 10 years.Footnote 18 For Muslim voters, I create a binary variable that indicates whether they voted for a Muslim candidate who did not finish in the top two of the six candidates included in the survey.Footnote 19 This variable measures a Muslim voter’s willingness to support a coethnic candidate who is less likely to receive votes from most Muslims. For Hindus, I created a binary variable to indicate whether they supported the BJP. My theory predicts that Hindus who previously voted for a Muslim will switch to the BJP candidate, so I focus on this subset.
Paired Constituency Design
The first design uses surveys across jurisdictional boundaries. I survey voters in villages or urban areas on either side of AC boundaries who are similar in most ways except their exposure to a Muslim MLA (see Figure 3 for an example from the district of Bijnor). I select bordering ACs that did and did not elect a Muslim MLA in 2012 for Uttar Pradesh and in 2015 for Bihar.Footnote
20 The survey covered 83 ACs—43 that had a Muslim MLA during the study period and 40 that did not. I then examine how having a Muslim MLA at time t (2012 for Uttar Pradesh and 2015 for Bihar) affected an individual’s reported voting behavior at time
$ t+1 $
 (2017 for Uttar Pradesh and 2020 for Bihar). The baseline model uses fixed effects for the sets of neighboring ACs I compare; additional models add control variables. Standard errors are clustered at the AC level because that is the level of “treatment” (whether or not there is a Muslim MLA). Sections E and F of the Supplementary Material detail the sampling across borders and balance statistics to illustrate that for most variables, respondents and locations with and without a Muslim MLA are not statistically significantly different.Footnote
21
Example of a Survey across Constituency Boundaries
Note: The figure provides an example of the method used for the survey nested in the natural experiment. Villages were selected on either side of constituency borders with and without a Muslim MLA. This example is from the four sampled ACs in Bijnor district in Uttar Pradesh.

Figure 3. Long description
A geographical map of Bijnor district in Uttar Pradesh divided into several Assembly Constituencies or A C s.
Legend in the Northeast quadrant:
* Dark gray shading: A C with 2012 Hindu M L A.
* Light gray shading: A C with 2012 Muslim M L A.
* White shading: A C s not Sampled.
* Open circle: Sampled Villages.
Distribution of sampled A C s:
* West: Bijnor A C is shaded dark gray. Two sampled villages are marked with open circles along its Southern border.
* Southwest: Chandpur A C is shaded light gray.
* East: Dhampur A C is shaded dark gray. Two sampled villages are marked with open circles along its Southeastern border.
* Northeast: Barhapur A C is shaded light gray.
The remaining central and Northern areas of the map are white, indicating they were not part of the survey sample. The map is overlaid on a light gray grid.
All Election Correlations
The second approach moves beyond the paired constituency research design. This means that instead of only focusing on electoral behavior for the 2017 election in Uttar Pradesh and the 2020 election in Bihar, I also look at voting in 2022 in Uttar Pradesh and 2015 in Bihar. These models do not have fixed effects for the groups of neighboring ACs because they are no longer tested as a cross-border comparison. Rather, they simply examine the correlation between having a Muslim incumbent MLA elected in t and individual voting behavior in
$ t+1 $
 . The baseline model regresses voting behavior on whether the AC has a sitting Muslim MLA; additional models add control variables. In Section F of the Supplementary Material, I conduct a series of placebo tests to show that the survey evidence holds only for the theoretically relevant groups.
Muslim Voting Behavior
Figure 4 reports the results from both the models for the paired constituency design and the models for all election correlations. Across all models, I find that having a Muslim representative significantly increases the likelihood that a Muslim voter will support a non-top Muslim candidate, which illustrates that the Muslim vote splits. The baseline model with the paired constituency design indicates that Muslim voters with a Muslim MLA are, on average, 16 percentage points more likely to vote for a non-top Muslim candidate compared to those just across the AC boundary with a Hindu MLA. This represents about a half a standard deviation increase from the overall mean of Muslims voting for non-top Muslim candidates. This positive effect generally holds with varying statistical significance when adding individual-level control variables, when controlling for the number of Muslim candidates, and when examining correlations across the full set of elections asked about in the survey.Footnote 22 Past studies on voting in India detect only modest evidence of strategic voting and find that Indian voters sometimes believe their preferred party is likely to win in their district (Heath and Ziegfeld Reference Heath and Ziegfeld2022). The finding that Muslims vote for candidates below the top two after a Muslim win illustrates how representation can contribute to less coordinated voting.
Impact of Having a Muslim MLA on Muslims’ Likelihood of Voting for Non-Top Muslim Candidates
Note: The thick lines denote 90% confidence intervals, and the thin lines denote 95% confidence intervals.

Figure 4. Long description
A multi-panel coefficient plot with two horizontal panels. The x-axis for both panels is labeled Coefficient for Having a Muslim M L A, ranging from minus 0.1 to 0.4. A vertical dashed line marks the zero point. The y-axis lists three models from top to bottom: Baseline Model, Adding Individual Level Controls, and Adding Control for Number of Muslim Candidates in A C.
Left Panel: Paired Constituency Design Effect.
* Baseline Model: Point estimate 0.164 with confidence intervals extending from approximately 0.02 to 0.34.
* Adding Individual Level Controls: Point estimate 0.172 with confidence intervals from approximately 0.03 to 0.34.
* Adding Control for Number of Muslim Candidates in A C: Point estimate 0.144 with confidence intervals from approximately minus 0.05 to 0.34.
Right Panel: All Elections Correlation.
* Baseline Model: Point estimate 0.076 with confidence intervals from approximately 0.01 to 0.15.
* Adding Individual Level Controls: Point estimate 0.077 with confidence intervals from approximately 0.01 to 0.15.
* Adding Control for Number of Muslim Candidates in A C: Point estimate 0.069 with confidence intervals from approximately minus 0.01 to 0.15.
Hindu Voting Behavior
The observable implication for Muslim representation on Hindus is that Hindus’ political behavior will be more structured on their dominant group identity, leading to consolidation for the BJP. A hard test of this is examining whether Hindu voters who previously voted for a Muslim candidate switched over to voting for the BJP after having a Muslim representative. I test this through the paired constituency design and all election correlations with results in Figure 5. Across all models, I find that having a Muslim MLA increases the likelihood that a Hindu who previously voted for a Muslim candidate will switch to the BJP. The baseline model with the paired constituency design indicates that former Muslim-voting Hindus with a Muslim MLA are, on average, 32 percentage points more likely to vote for the BJP. This represents a 0.63-standard-deviation increase from the overall mean of Hindus who previously supported a Muslim voting for the BJP.
Impact of Having a Muslim MLA on Former Muslim-Voting Hindus’ Likelihood of Voting for the BJP
Note: The thick lines denote 90% confidence intervals, and the thin lines denote 95% confidence intervals.

Figure 5. Long description
The image consists of two horizontal coefficient plots. The X-axis for both is labeled Coefficient for Having a Muslim M L A, with a scale from negative 0.2 to 0.6 and a vertical dashed line at 0.0 representing the null effect. The Y-axis lists two categories: Baseline Model at the top and Adding Individual Level Controls at the bottom.
* Left Panel: Paired Constituency Design Effect.
- Baseline Model: A point estimate of 0.315. The thick 90 percent confidence interval spans approximately 0.15 to 0.48, and the thin 95 percent confidence interval spans approximately 0.12 to 0.51.
- Adding Individual Level Controls: A point estimate of 0.106. The thick 90 percent confidence interval spans approximately negative 0.03 to 0.24, and the thin 95 percent confidence interval spans approximately negative 0.06 to 0.27.
* Right Panel: All Election Correlation.
- Baseline Model: A point estimate of 0.196. The thick 90 percent confidence interval spans approximately 0.08 to 0.31, and the thin 95 percent confidence interval spans approximately 0.05 to 0.34.
- Adding Individual Level Controls: A point estimate of 0.173. The thick 90 percent confidence interval spans approximately 0.04 to 0.31, and the thin 95 percent confidence interval spans approximately 0.01 to 0.33.
WHY MUSLIMS DIVIDE AND HINDUS CONSOLIDATE
In this section, I use qualitative and quantitative evidence to describe and test the causal mechanisms underlying Muslim division and Hindu consolidation. The qualitative evidence is drawn from nearly 150 elite and voter interviews and ethnographic observations at party meetings and election rallies. In Section G of the Supplementary Material, I discuss how the qualitative evidence relates to the quantitative evidence, the case selection process for the ACs and voters I focus on, and the ethical considerations related to my fieldwork. Drawing on this in-depth fieldwork, I find that Muslims divide on sub-identities due to unmet expectations and the mobilization of challenger elites, and Hindus consolidate because of perceptions of declining dominance and majoritarian mobilization.
I then test the mechanisms derived from qualitative fieldwork using a preregistered, ethnographically informed vignette experiment as part of my original survey in Uttar Pradesh and Bihar. In Section H of the Supplementary Material, I present all models prespecified in the pre-analysis plan, which I do not deviate from. The experiment reveals that when voters are told that an MLA prioritizes his sub-identity over his broader religious identity, Muslims become more likely to be electorally divided. Moreover, Hindu voters support the majoritarian BJP candidate, especially when they are told the sitting Muslim MLA only worked for his religious community. These treatments seek to mirror the information that voters may receive from elites.
Unmet Expectations and Challenger Elite Entry
My fieldwork reveals that when challenger elites emerge, parties nominate Muslim candidates with different sub-identities (e.g., caste and sect). In-depth accounts of the 2012 elections in the district of Meerut reveal how Muslim sub-identities helped boost the number of Muslim candidates. In 2007, an AC in Meerut elected a Muslim candidate from the Uttar Pradesh United Democratic Front Party (UP UDF). There was only one other Muslim candidate among the top six finishers despite Meerut’s sizable Muslim population. By the 2012 election, the AC was split into two constituencies: Meerut A and Meerut B.Footnote 23 Their shared history of a Muslim win in 2007 encouraged intra-Muslim challenger elites to emerge and influenced who non-BJP parties decided to field.
The Muslim MLA elected in 2007 was from the Qureshi jati. Voters from his sub-identity highlighted that “Reaching him and his people was not hard” and “his people tried to help, they did not just take our vote and then never do anything in our community.”Footnote 24 However, voters from a different jati described the MLA as “too focused on his people and his business.”Footnote 25
As Table 4 reports, in the 2012 election, five of the top six candidates were Muslim in Meerut A and four of the six were Muslim in Meerut B. I collected information on these past candidates’ jati during my fieldwork and verified it with the SPINPER Project (2024). Parties fielded more Muslim candidates in both constituencies, but also fielded Muslims of different jatis. A party official in Meerut A explained, “We may not be able to win all the upper caste Muslim votes that [the UP UDF] won, but with an OBC, we can get some of that section of the Muslim society and we would surely get Ansari votes.”Footnote 26 The Samajwadi Party (SP) and Bahujan Samaj Party (BSP) decided to field an Ansari, hoping to obtain that portion of the Muslim vote to combine with the votes they traditionally receive. Similarly, the Congress Party ran a Qureshi candidate to attract OBC votes in addition to some UC Muslims, who have traditionally supported the party. In Meerut B, a similar dynamic emerged; votes were split among four Muslim candidates (one Saifi, one Gaddi, one Qureshi, and one Ansari).
2012 Assembly Candidates in Two Assembly Constituencies in Meerut

Table 4. Long description
The table consists of five columns: Constituency, Position, Party, Vote share, and Religion/Jati.
For Meerut A:
* Position 1: B J P candidate, 38.04 percent, Hindu.
* Position 2: S P candidate, 34.54 percent, Muslim, Ansari (O B C).
* Position 3: I N C candidate, 17.80 percent, Muslim, Qureshi (O B C).
* Position 4: B S P candidate, 7.35 percent, Muslim, Ansari (O B C).
* Position 5: I N D candidate, 0.44 percent, Muslim plus.
* Position 6: P E C P candidate, 0.42 percent, Muslim, Sheikh (U C).
For Meerut B:
* Position 1: B J P candidate, 32.79 percent, Hindu.
* Position 2: B S P candidate, 28.31 percent, Muslim, Qureshi (O B C).
* Position 3: S P candidate, 22.49 percent, Muslim, Gaddi (O B C).
* Position 4: R L D candidate, 11.52 percent, Muslim, Saifi (O B C).
* Position 5: P E C P candidate, 1.25 percent, Muslim, Ansari (O B C).
* Position 6: I N D candidate, 0.70 percent, Hindu.
A footnote indicates that the plus symbol denotes a candidate whose jati identity could not be verified.
Note:
$ {}^{+} $
 Election results are from the Trivedi Centre for Political Data. I was unable to verify the jati identity of this candidate because the candidate ran as an independent and individuals I interviewed in Meerut were not familiar with the candidate.
The SP candidate who was the runner-up in Meerut A emerged as a key figure in the Muslim community before running. He highlighted his work for the people of his jati: “my people knew they would come to me and I would at least try to help.”Footnote 27 Helping members of the Ansari community boosted his prominence; he was confident they would support him. However, he partly attributed his loss in 2012 to Muslim vote splitting, stating that “with so many Muslim candidates, each Muslim could vote for their exact jati.”Footnote 28 He believed he could get most of the Ansari votes given his engagement with them, and that the other Ansari candidate fielded by the BSP would primarily receive votes from Hindu Dalits who were loyal to the BSP. Ultimately, the two Ansari candidates split some members of the Muslim community.
The SP third-place candidate in Meerut B in 2012 noted the prevalence of Muslim vote splitting in this election too. He asserted that the previous Muslim win changed voter behavior: “When a Qureshi sees a Qureshi, he will want to vote for Qureshi; when a Gaddi sees a Gaddi, he will want to vote for a Gaddi.”Footnote 29 A party official added that Muslims “feel comfortable” when they have a Muslim MLA and “when they are comfortable, they will want to vote for a Muslim of their group, not a Muslim of the other group.”Footnote 30 These accounts from Meerut A and Meerut B detail how new candidates emerge and are differentiated on sub-identities like jati, highlighting how divisions are activated.
With more Muslim candidates differentiated on jati, why do Muslim voters fail to coordinate and end up splitting their vote after having a Muslim representative? My argument highlights that politicians can often struggle to deliver to all sub-groups within their broad identity group. Minority politicians in particular have to balance prioritizing their coethnics and other dominant group members who they also rely on electorally. If they only prioritize their coethnics, the dominant group may mobilize against them. They also face challenger coethnics who may have secured a political footing among some sub-groups (like the SP runner-up in Meerut A). These constraints can make a Muslim MLA more likely to have to compete based on their sub-identity as well. I argue that Muslim voters who experience this sub-identity favoritism may feel that their high expectations of having a Muslim representative are unmet, making vote splitting more likely.
Having a Muslim MLA can generate a feeling of discontent among some Muslim voters if their coethnic MLA did not provide the help to their religious group that they expected. Feelings of discontent due to a lack of responsiveness can be further exacerbated if the Muslim MLA appears to only prioritize his or her sub-identity, such as paying attention primarily to members of their jati or sect. A Muslim interviewee summarized this trend: “if the Muslim MLA is treating some Muslims like his son and some Muslims like his step-son then we will not want to support him.”Footnote 31
Qualitative evidence from voter interviews suggests that Muslim voters may be more likely to consider voting for other Muslim candidates or a candidate of their jati if their Muslim MLA lets them down. Having a Muslim MLA gives Muslim voters information about how a coethnic will represent them. This is clear when comparing qualitative interviews with Muslims in constituencies that did and did not have a Muslim MLA. For example, in one constituency in Aligarh district, a Muslim voter said the Muslim MLA from 2012 to 2017 “did not even come back here after he won. He became a ‘big man’ and I could not reach him when I wanted help with even getting a ration card.”Footnote
32 A Muslim voter from a different but nearby constituency in Aligarh district (who had a Hindu MLA) spoke hopefully about how a Muslim MLA could improve his village: “If we had one of our brothers, like in [the AC in Aligarh district], for our MLA the condition here would be better.”Footnote
33 A Muslim voter from one constituency in the district of Meerut positively evaluated an SP MLA, stating that when he approached the MLA, “he helped every time” and he “built roads and fenced the Muslim cemetery.”Footnote
34 However, this voter later reflected on the importance of his shared jati with the MLA: “There is a strange connection that binds us. Like two Muslims have a connection on the level of being a Muslim. Similarly, there is added connection based on caste
$ \dots $
 He will support the lobby of our own caste.”Footnote
35
, Footnote
36
I use a preregistered vignette experiment, informed by qualitative evidence (Thachil Reference Thachil2018), to test how a Muslim MLA’s behavior in office impacts Muslim voters’ likelihood of voting based on their sub-identity in the next election. Enumerators presented the respondents with a hypothetical situation in which their current MLA is either Muslim or Hindu and the MLA’s work targets either the general population, the MLA’s religious group, or the MLA’s caste group. The experimental variation is therefore the religion of the MLA and who they targeted when in office (e.g., Muslim who worked for his caste group, Hindu who worked for his religious group, etc.).
The example vignette is: “Imagine that an election is happening soon. The current MLA is Muslim. This MLA has worked on providing water pumps for areas where people of their religious community live. Here are the candidate options for the upcoming election. Which one would you be most likely to vote for?” Respondents were presented with three candidate options to vote for in the next election: a Hindu BJP candidate with a randomized jati, a Muslim candidate from the major opposition party (the SP in Uttar Pradesh and the RJD in Bihar) with a randomized jati, and a third candidate who is of the same religion and jati as the respondent (collected earlier in the survey) but from a randomized party that is active, though less prominent, in both states. They were then reminded of the MLA and their indicated work.
I create a binary variable for whether the Muslim respondents said they would vote for the third candidate (the same-jati Muslim), reflecting a willingness to split from other Muslim voters. This variable also captures a Muslim’s preference for a candidate of their sub-identity who would struggle to obtain a majority of Muslim votes. Section H of the Supplementary Material presents the full results in accordance with the preregistered specification and discusses additional hypotheses tested. Using the preregistered specification, Figure 6 shows that when Muslim MLAs prioritize their jati rather than their religious group, voters are 3.2 percentage points more likely to split their vote and support the same-jati candidate.
Effect of MLA Behavior on Muslims Voting for Same-Jati Candidate

Loss of Majority Dominance and Majoritarian Mobilization
Elite and voter interviews suggest that after a Muslim gains power, Hindu voters are more likely to perceive a loss in their dominance and the Hindu nationalist BJP seeks to mobilize voters on majoritarianism, specifically targeting the sitting Muslim MLA. Examining mobilization after the election of a Muslim candidate in Meerut reveals this dynamic. In Meerut A, the BJP accused the Muslim MLA of religious favoritism in an attempt to consolidate Hindu votes. One party worker criticized the MLA’s business: “He had a meat company, so the voters were told this and then they knew that he only cared for Muslims’ practices.”Footnote
37 Selling meat in North India is a contentious religious issue, as Hindus believe cows are sacred; they have passed cow slaughter legislation and set up gau rakshas (cow protection groups). Linking any politician to the meat industry is a way to highlight their religious affiliation, opening the door to perceptions of religious favoritism that can be used to mobilize majoritarianism. Another political official described how the Muslim MLA’s tenure demonstrated to Hindus that Muslims “acted out” under a coethnic MLA: “His children and his followers and the other Muslim youth would do whatever they pleased
$ \dots $
 they were involved in all forms of mischief in the community
$ \dots $
 his people were involved in attacking a police constable during his rule.”Footnote
38
Having a Muslim MLA provides information to Hindu voters about what it is like to have a non-coethnic represent them. A voter in Meerut expressed similar sentiments about minority group behavior being different under a minority MLA: “It is like they can do whatever they want, the rules won’t apply to them.”Footnote 39 Another voter emphasized that “access to his [the Muslim MLA’s] people was harder then, now there is no trouble getting in touch with the party.”Footnote 40 In 2007, Bijnor AC’s Muslim MLA was praised by Muslim voters for building roads in a village just outside the main city.Footnote 41 However, a Hindu voter contended that while he did construct one road in the village, it was intentionally “constructed leading to the mosque” and made the “mosque accessible to the highway.”Footnote 42 These individuals emphasize how Hindu voters viewed Muslim MLAs as engaging in religious favoritism when carrying out development projects. These voter perceptions and accusations against the Muslim MLA helped maintain the BJP’s support and convinced some Hindus who previously voted for a Muslim candidate to switch to the BJP. This example further highlights how majoritarian targeting of the sitting Muslim MLA can impact the perceptions of Muslim politicians more generally.
I test this logic using the same vignette experiment as described above. For Hindus, I create a binary variable for whether the Hindu respondents say they would vote for the BJP candidate, reflecting support for majoritarianism. We should theoretically expect an increase in Hindus voting for the BJP when they are told the Muslim MLA helped his religious group (a regular method of MLA targeting used by the party) compared to a Muslim MLA who helped all of his constituents. Figure 7 shows that the mean level of Hindu support for the BJP candidate is 67.6% for the “Muslim, Helped All” treatment and significantly greater at 78.3% for the “Muslims, Helped Religion” treatment.
Effect of MLA Behavior on Hindus Voting for the BJP

DISCUSSION AND CONCLUSION
This article highlights minority political power as a key factor shaping the role identity plays in the political behavior of both minority and dominant groups. While previous accounts emphasize demographic and institutional drivers of ethnic politics, I offer a dynamic argument. I argue that representation itself can shift the nature of identity-based voting, generating two perils of power: a minority divided on sub-identities and a majority consolidated on a dominant group identity. Where these come together, they can produce a representation trap in which minority power creates conditions that ultimately harm the group’s electoral prospects. I demonstrate these dynamics through a mixed-methods study of Muslims in India, a context that holds electoral institutions and other factors largely constant while allowing the full causal logic to be examined in one setting.
The argument’s core insight, that minority power can restructure minority political behavior around sub-identities and dominant group behavior around an overarching identity, likely travels beyond India, though its electoral consequences will vary by context. In two-party systems, challenger dynamics may play out in primaries, with losing sub-groups disengaging in the general election while dominant group consolidation still occurs. In proportional representation systems, minority divisions may produce smaller sub-identity parties rather than the loss of minority power outright, while dominant group consolidation can still shift seats toward majoritarian parties.
Cases across contexts highlight some of these dynamics. The activation of a dominant group identity is seen among white Americans after the election of a Black candidate to the presidency in the United States (Jardina Reference Jardina2019) and among natives and ethnic majorities in Europe after the political ascendance of immigrants and ethnic minorities (Bustikova Reference Bustikova2019; Zonszein and Grossman Reference Zonszein and Grossman2024). The activation of sub-identities among minorities after minority ascension to power is present across a range of cases. In India, Dalit representation through parties like the BSP has prioritized particular sub-castes such as the Chamars over the broader group (Chandra Reference Chandra2007), and reserved seats for SCs appear to undermine mobilization on the overarching SC identity, making sub-identity appeals more likely (Chauchard Reference Chauchard2017; Jensenius Reference Jensenius2017; Vaishnav Reference Vaishnav2017b). In the United Kingdom, Pakistani representation in parts of Birmingham has reflected a prioritization of particular biraderis rather than the broader community (Dancygier Reference Dancygier2017). In the United States, divisions between African Americans and Afro-Caribbeans in New York City reflect disagreements over descriptive representation and the limits of cross-sub-group representation (Rogers Reference Rogers2004). And in Jordan, political coordination breaks down across clans and families within broader tribal umbrellas (Buttorff Reference Buttorff2015).
This article describes the short-term representation trap caused by gaining power; it does not theorize how the process plays out in the long term. On the one hand, elites and voters can learn from this process and seek to prevent its recurrence. However, the representation trap dynamic can also occur again in the same place. For example, if parties believe that religious polarization is no longer high, they may field a Muslim candidate again several cycles later. Moreover, not all voters recognize that if they split their vote, they may lose out on having a coethnic candidate. Some voters may also vote for a Muslim of a different sub-identity to send a message to the existing Muslim leadership that their sub-group should not be left behind. Even if some Muslim voters learn to coordinate, the emergence of new challenger elites and the activation of sub-identities can create a subset of the population that doubles down on this identity and develops jati-based group consciousness. For example, current Muslim caste politics involves mobilizing around jati associations and pushing for jati-based accommodations, even while Muslims may vote in a more consolidated way since the BJP’s 2019 win. Regardless of how the process reoccurs, when it does, majoritarian parties may convince more dominant group voters that having a minority representative could disadvantage them. This process can heighten majoritarianism slowly over time and activate divisions within the minority. It can eventually generate a political system in which fielding a minority group member will be an unlikely strategy, as dominant group voters will not support a minority candidate.
SUPPLEMENTARY MATERIAL
The supplementary material for this article can be found at https://doi.org/10.1017/S0003055426101774.
DATA AVAILABILITY STATEMENT
Research documentation and data that support the findings of this study are openly available at the American Political Science Review Dataverse: https://doi.org/10.7910/DVN/4UR5DY.
ACKNOWLEDGEMENTS
I am very grateful for comments, advice, and support from Jeremy Weinstein, Soledad Artiz Prillaman, David Laitin, Jim Fearon, and Saad Gulzar. I thank Natalya Adam-Rahman, Paige Bollen, Rachel Brulé, Melani Cammett, Anirvan Chowdhury, Nikhar Gaikwad, Natalia Garbiras-Diaz, Jens Hainmueller, Zuhad Hai, Alisha Holland, Soyoung Lee, Taeku Lee, Rachel Lienesch, Sebastian Lucek, Noah Nathan, Gareth Nellis, Dan Posner, Niloufer Siddiqui, Shikhar Singh, Prerna Singh, Tariq Thachil, Sarah Thompson, Milan Vaishnav, Ashutosh Varshney, and Steven Wilkinson for helpful comments and suggestions. I am grateful to Gilles Verniers and the Trivedi Centre for Political Data (TCPD) at Ashoka University for hosting me during fieldwork, sharing data, and providing feedback. I also thank Ved Prakash Sharma and the Across survey team for their excellent support in fielding the survey. I thank Noor Fatima, Aqib Faraz, Asad Malik, Ashok Meena, Hamza Khan, Ibrahim Qadri, Aaqib Qayoom, and Ankit Singh for excellent research and field assistance. I thank Sugat Chaturvedi for assistance with the name to religion algorithm. I am grateful for the feedback I received on this work from the Inclusive Democracy and Development (ID2) Lab, Stanford CDDRL, MPSA 2022/2023 Annual Meeting, APSA 2022/2023 Annual Meeting, AALIMS 2023 Conference, ASREC 2023 Conference, Harvard-Brown Joint Seminar on South Asian Politics, and workshop presentations at various universities.
FUNDING STATEMENT
I am grateful for generous funding from APSA’s Religion and Politics Section, Abbasi Program in Islamic Studies, Stanford Center for South Asia, Stanford Institute for Research in the Social Sciences, King Center on Global Development, Stanford Iranian Studies Program, Freeman Spogli Institute, and Stanford Vice Provost of Graduate Education.
CONFLICT OF INTEREST
The author declares no ethical issues or conflicts of interest in this research.
ETHICAL STANDARDS
The author declares the human subjects research in this article was reviewed and approved by Stanford University and certificate numbers are provided in the Supplementary Material. The author affirms that this article adheres to the principles concerning research with human participants laid out in APSA’s Principles and Guidance on Human Subject Research (2020).

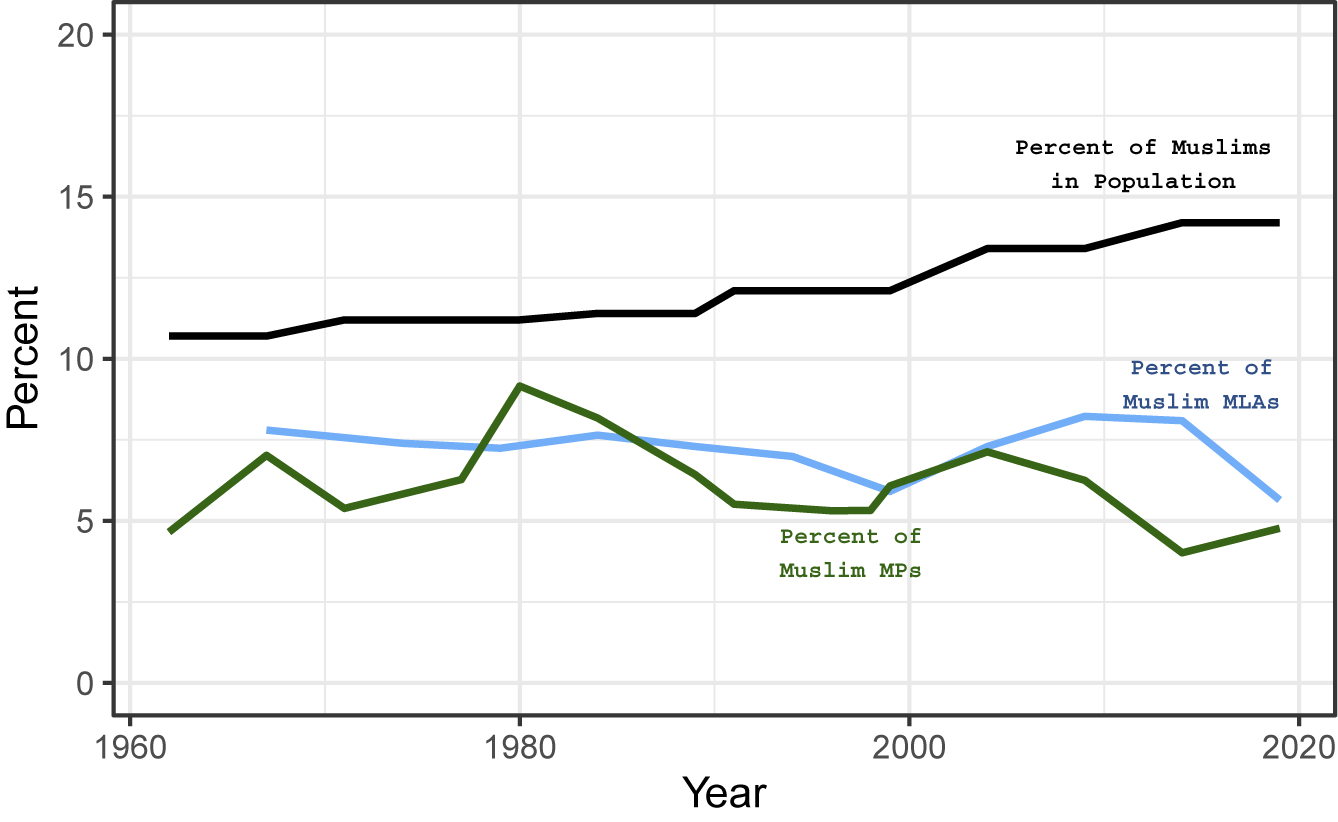
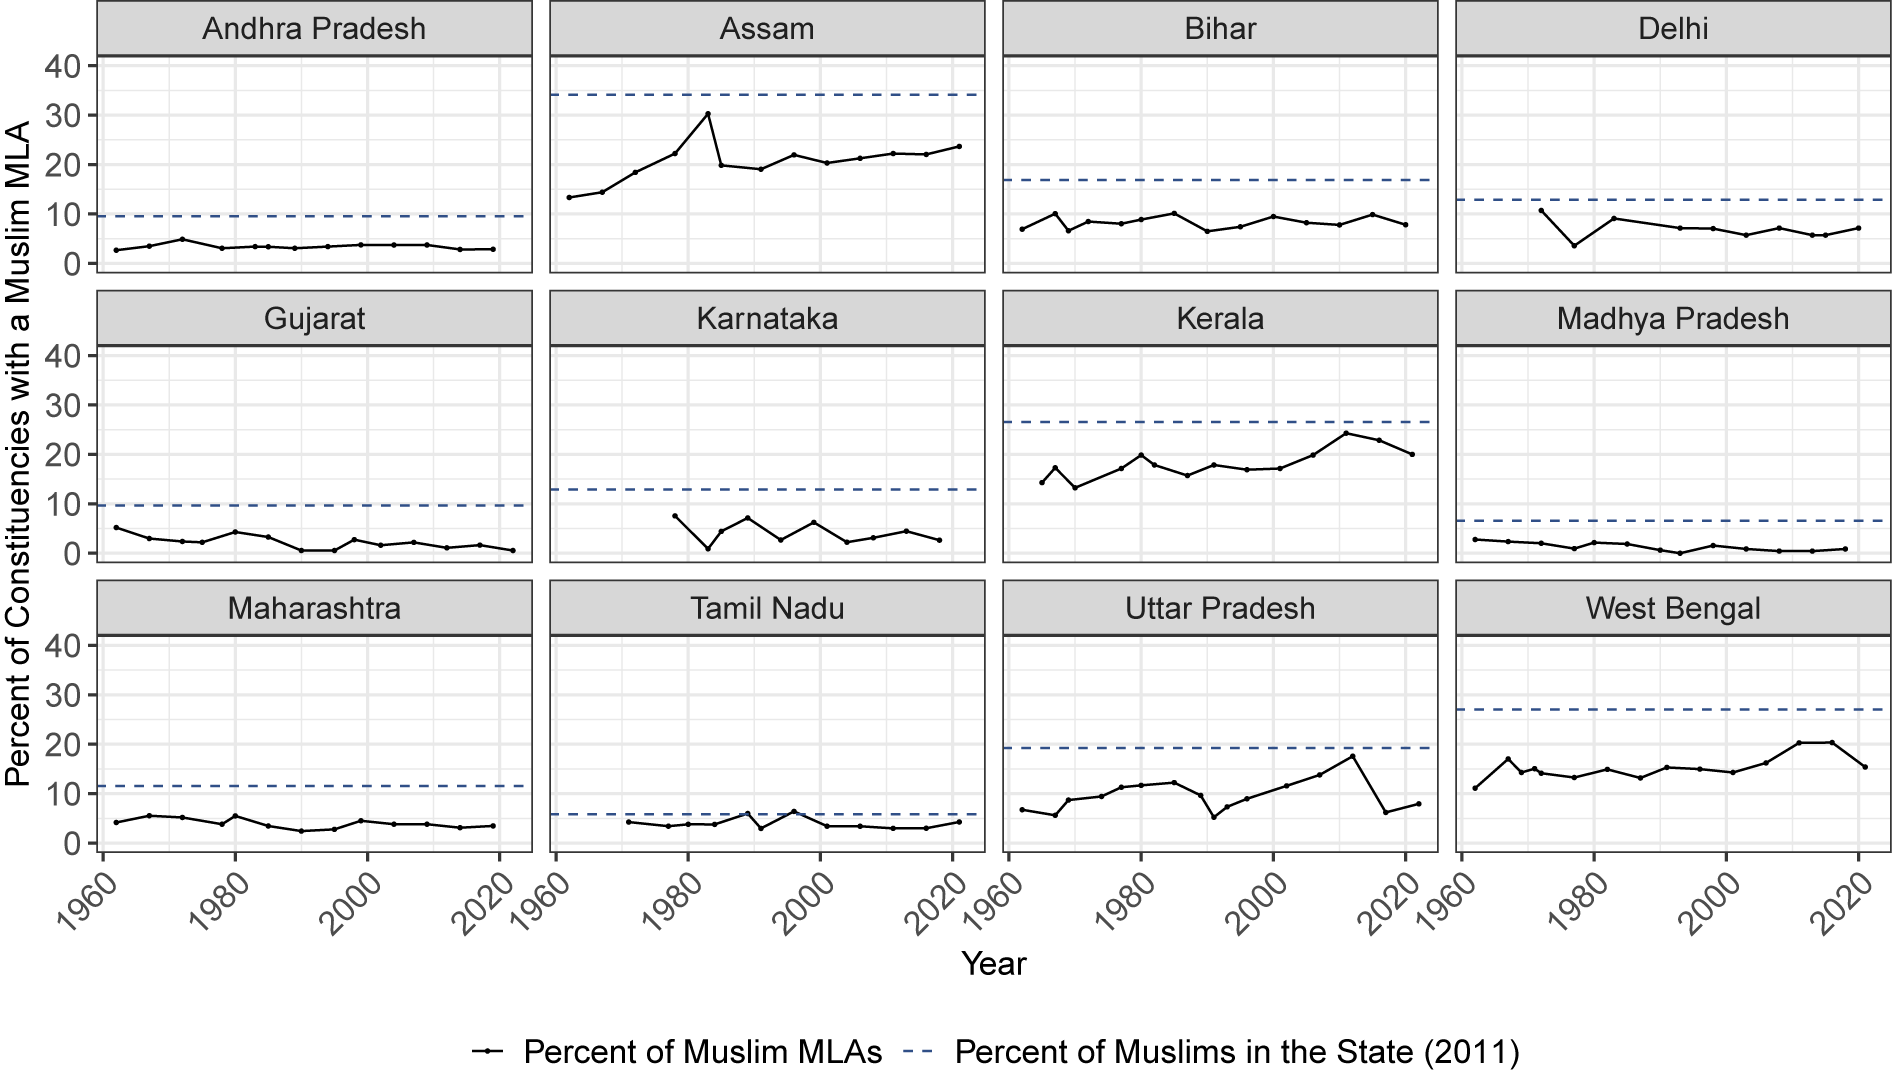
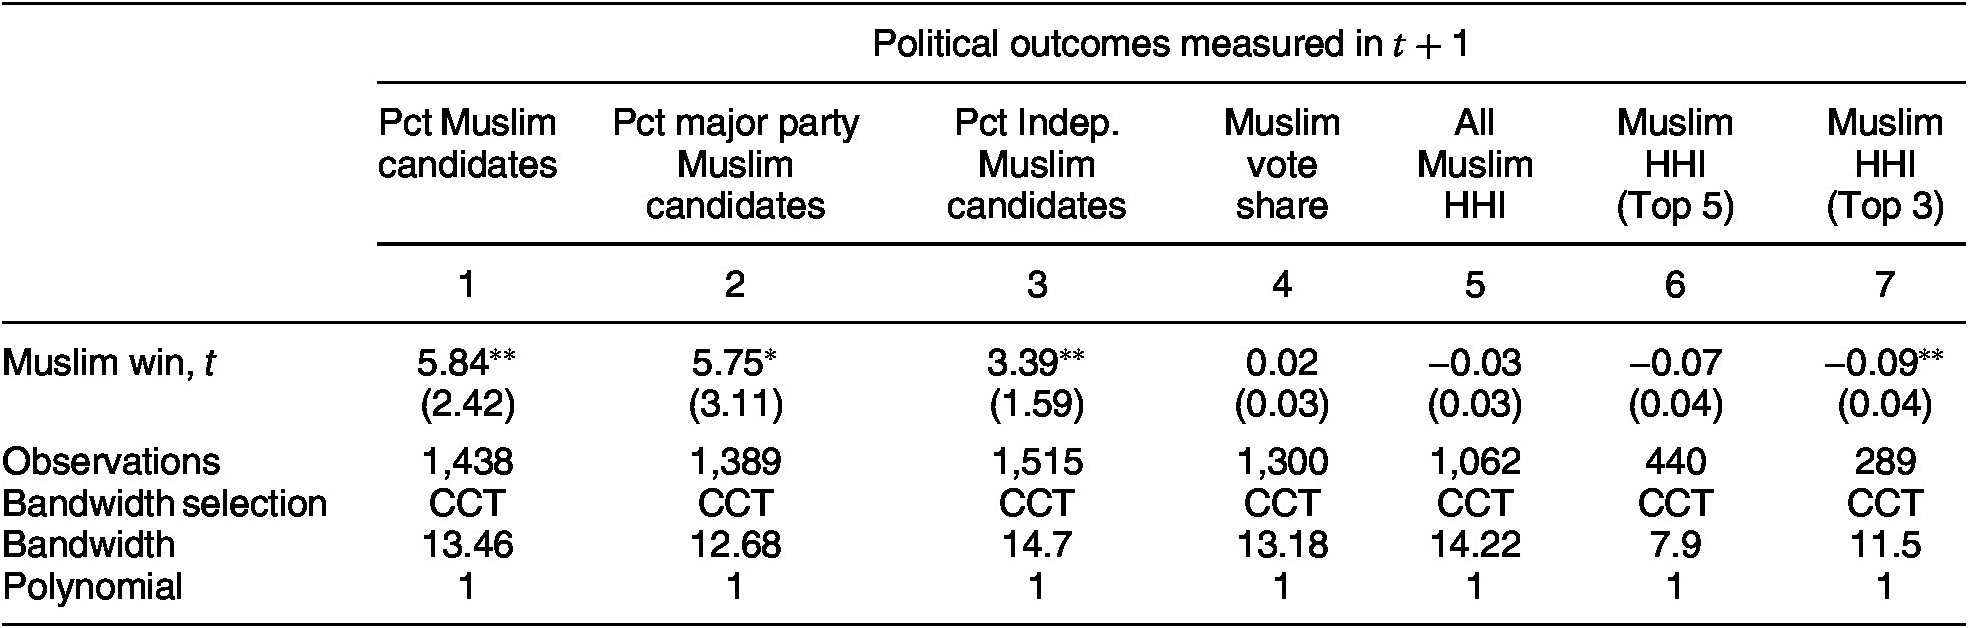

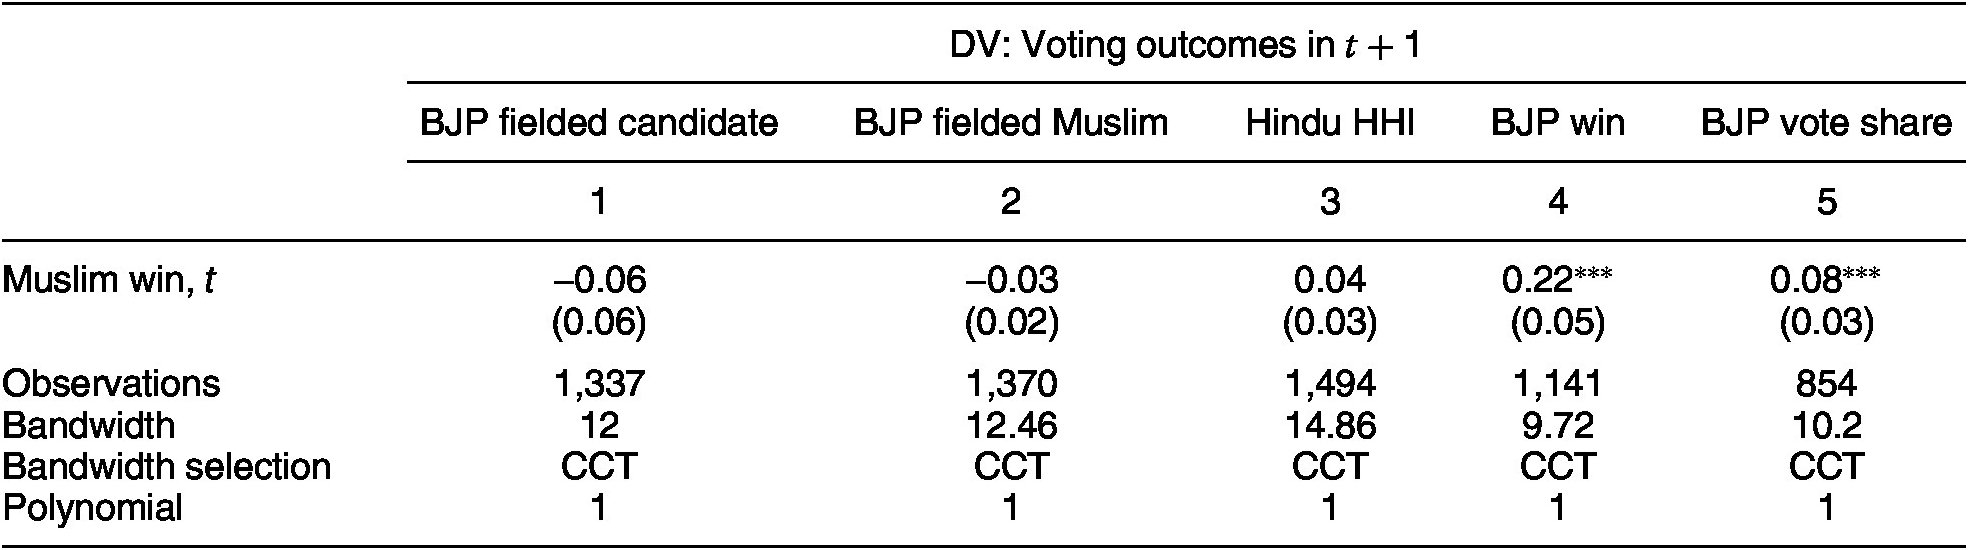

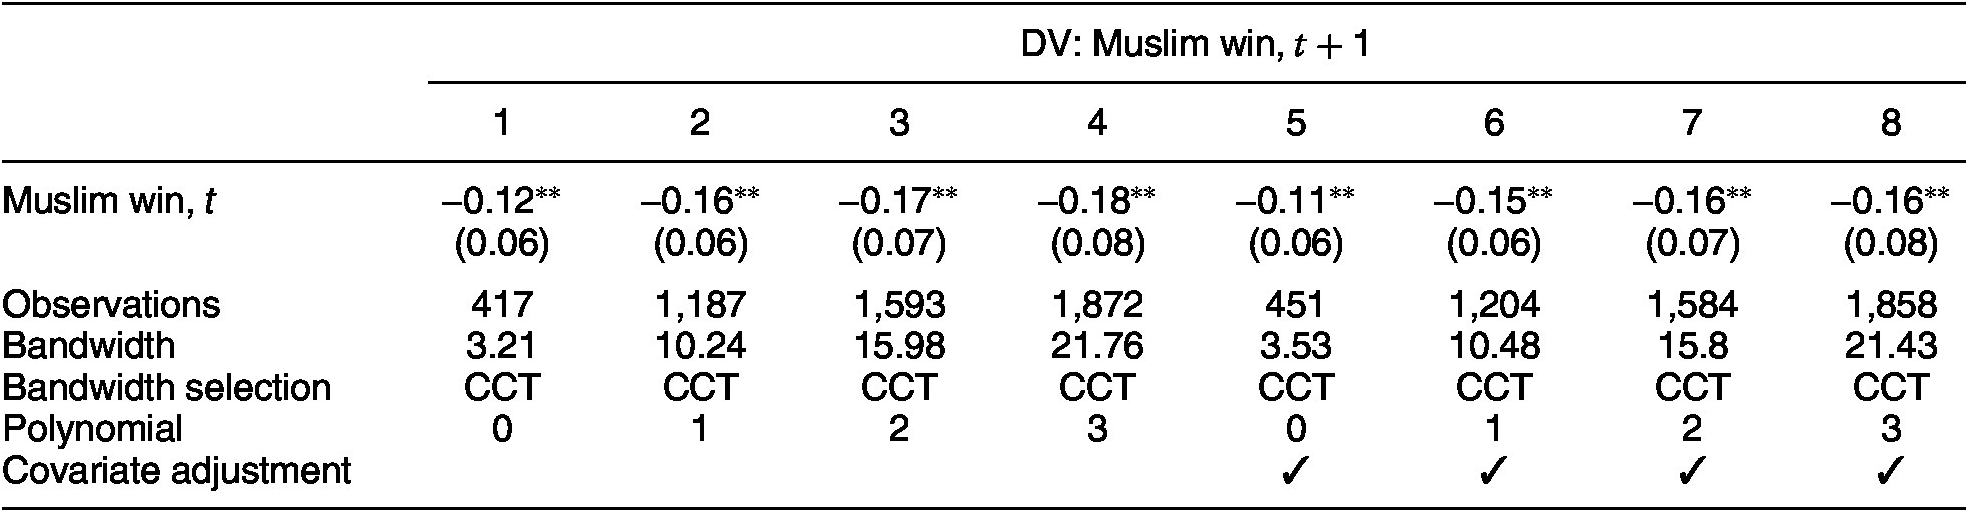

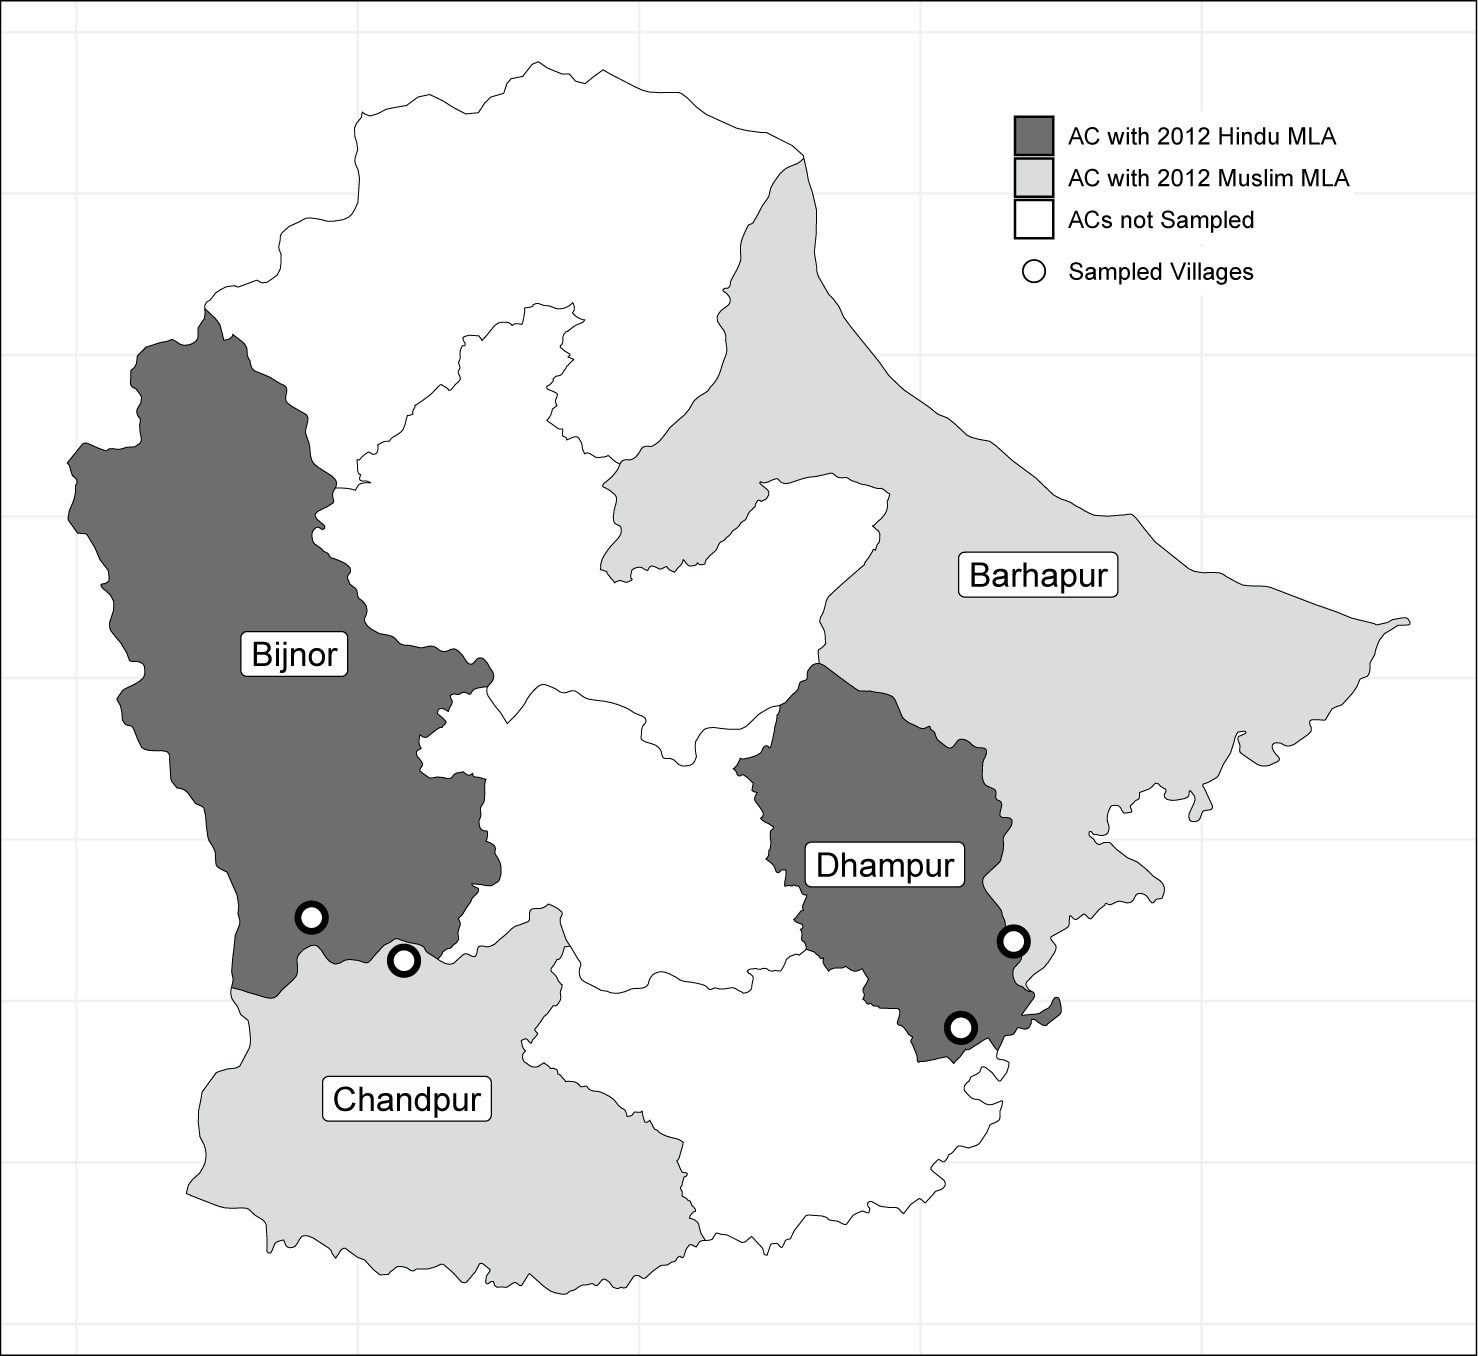
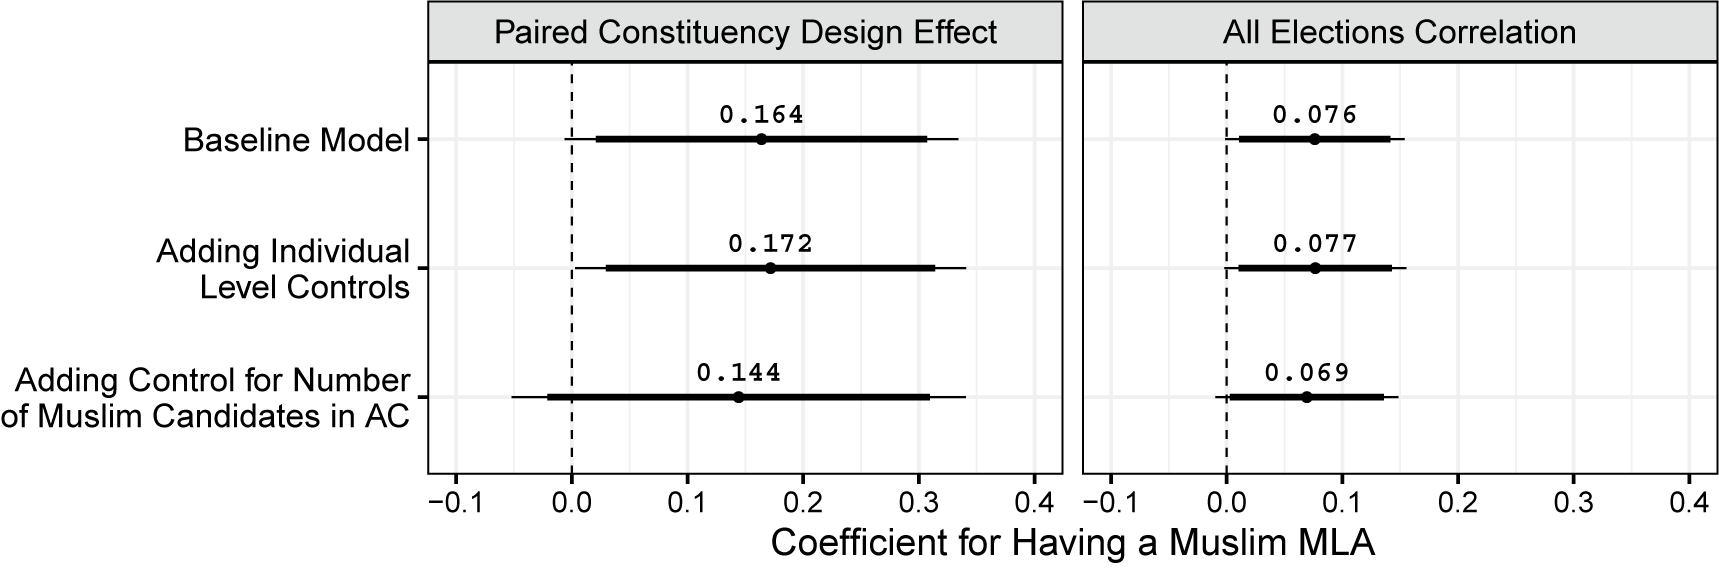
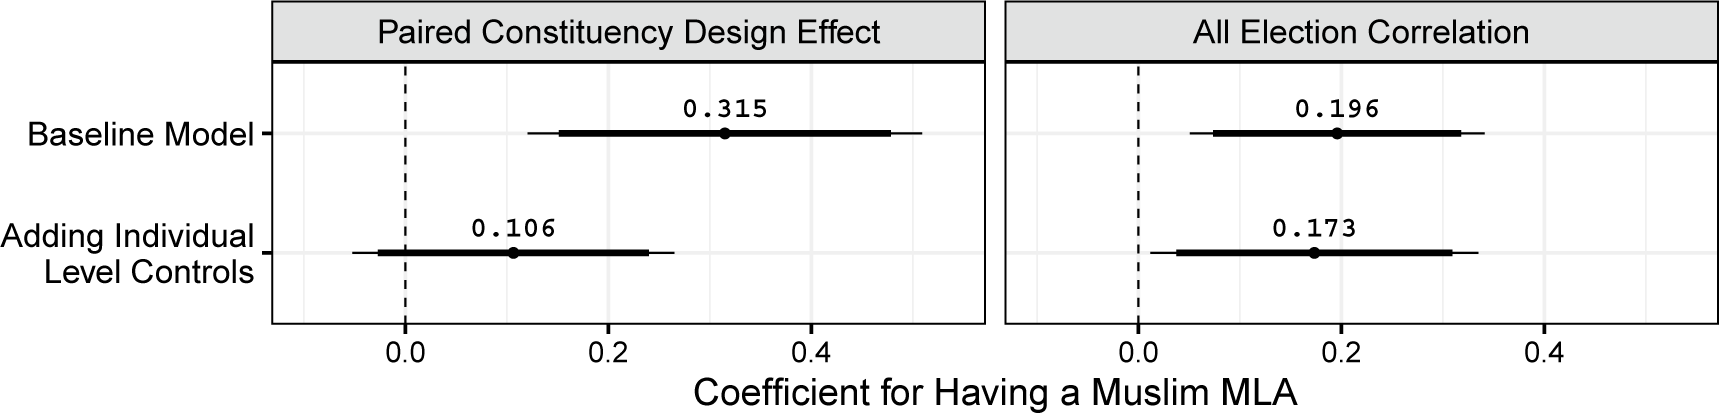
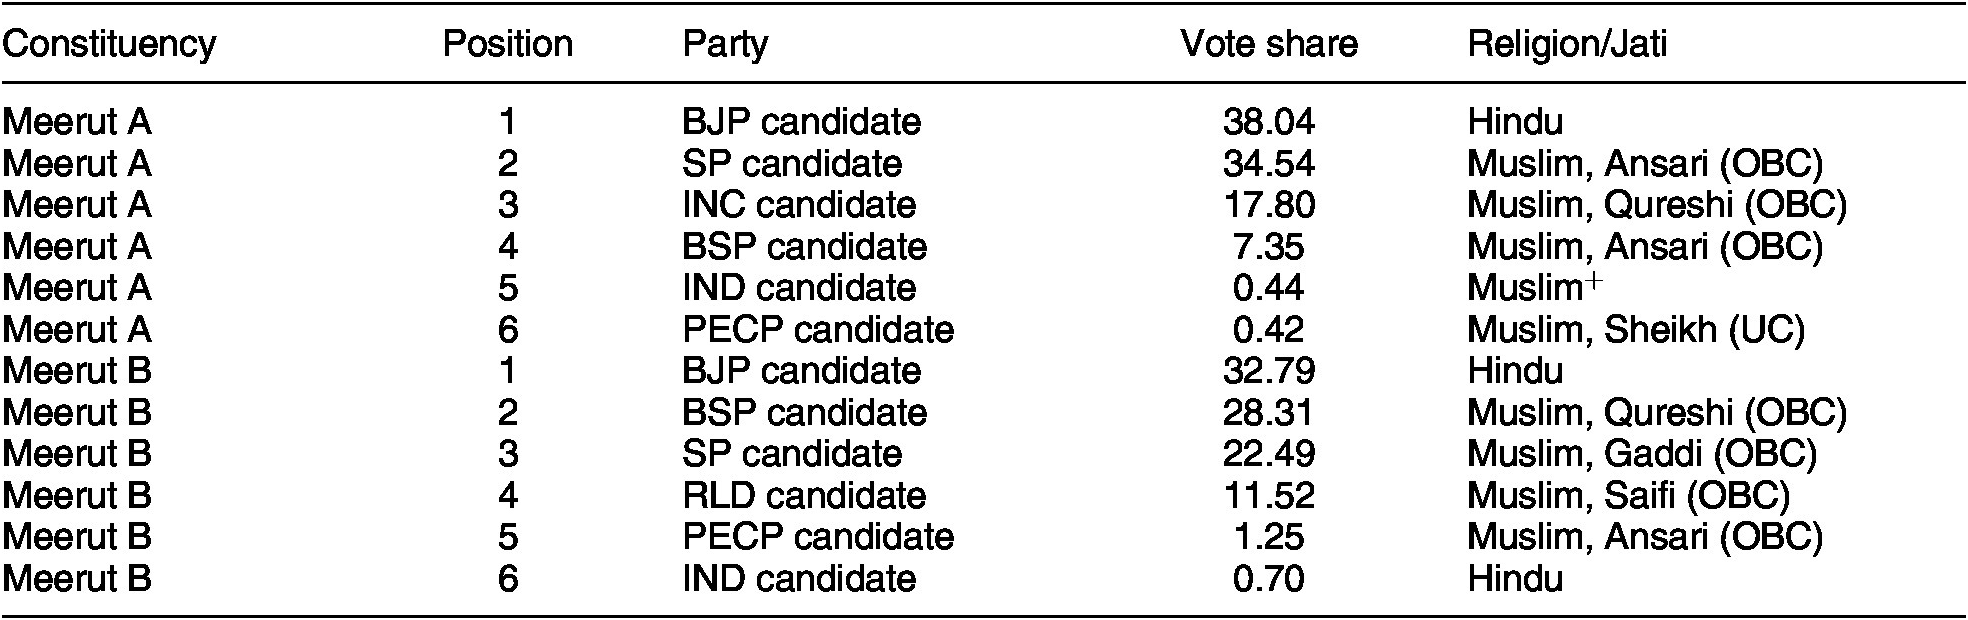
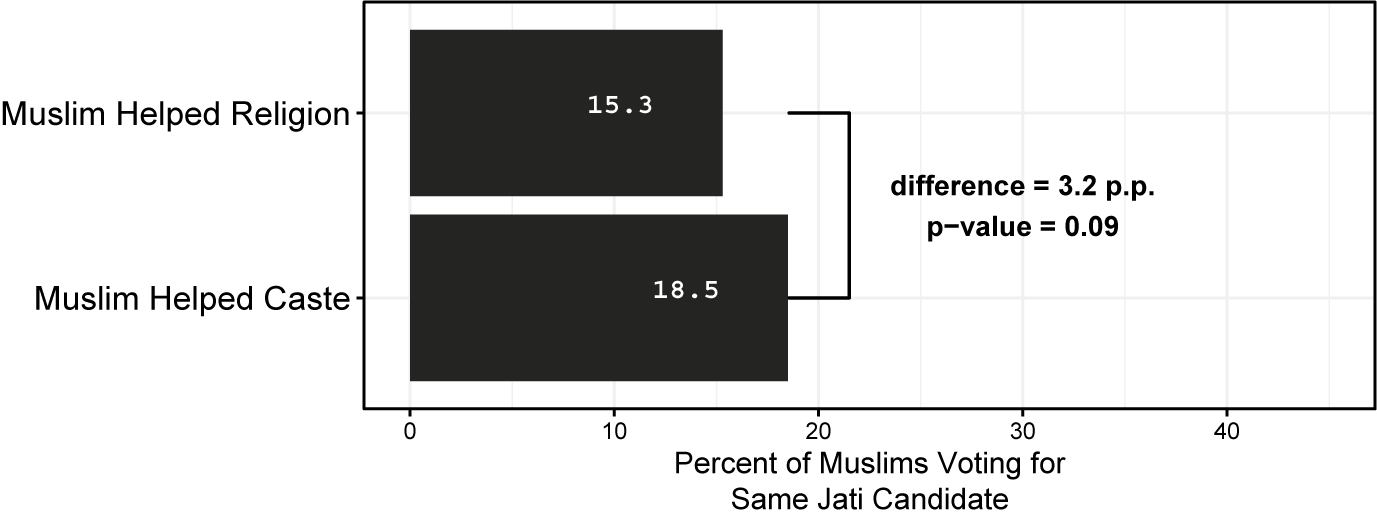
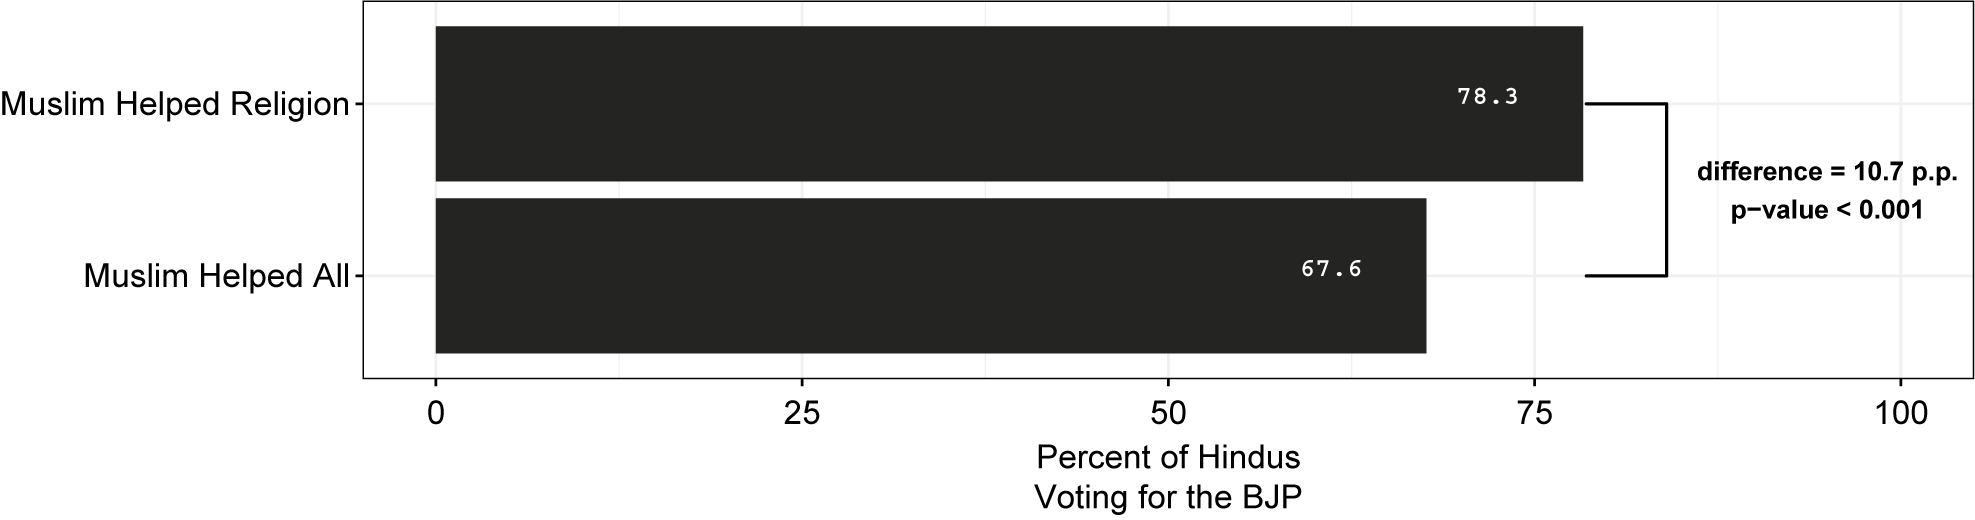


 Open access


Comments
No Comments have been published for this article.