
Introduction
Reducing air pollution and carbon dioxide emission is of great scientific and technologic essence. Thermoelectric (TE) power generation technology enables direct conversion of waste heat into electrical power, and is probably one of the most promising directions in this avenue. A temperature gradient applied on TE materials induces charge carrier diffusion, which in turn gives rise to electrical voltage between the hot and cold poles, thus converting heat flux into electrical power. TE devices are compact with no moving parts, noiseless, and environmentally safe.[Reference Tritt and Subramanian1] A typical TE device comprises several n- and p-type modules connected electrically in series and thermally in parallel; it is, therefore, of great technologic importance to develop both types of TE materials. Nowadays, the commonly used TE materials are chalcogenide-based compounds such as PbTe,[Reference Lalonde, Pei, Wang and Snyder2, Reference Liu, Hu, Zhang, Deng and Han3] which are expensive and unstable at elevated temperatures. Conversely, TE oxides exhibit significant benefits having structural and chemical stability over a wide temperature range. They are also environmentally friendly and relatively inexpensive.[Reference Koumoto, Funahashi, Guilmeau, Miyazaki, Weidenkaff, Wang and Wan4] They exhibit, however, a major shortcoming, that is, their relatively low performance.
The dimensionless “figure of merit”, ZT, expressed by:
 $$ZT = \displaystyle{{S^2 \sigma T} \over {\kappa _{\rm e} + \kappa _{\rm l}}}, $$
denotes the thermodynamic conversion efficiency of a TE material. Here T is the absolute temperature, S is the Seebeck coefficient, σ is the electrical conductivity, and κ e and κ l are the electronic and lattice components of thermal conductivity, respectively. The TE “power factor” (PF) is defined by S 2σ. Typical oxides are characterized by ZT values ranging between 0.1 (e.g., CaMnO3) and 0.3 (e.g., Al-doped ZnO) for elevated temperatures.[Reference Tritt and Subramanian1, Reference Koumoto, Funahashi, Guilmeau, Miyazaki, Weidenkaff, Wang and Wan4, Reference Koumoto, Wang, Zhang, Kosuga and Funahashi5] The highest ZT values of p-type layered cobalt oxides, such as NaxCo2O4[Reference Terasaki, Sasago and Uchinokura6, Reference He, Liu and Funahashi7] and Ca3Co4O9,[Reference Masset, Michel, Maignan, Hervieu, Toulemonde, Studer, Raveau and Hejtmanek8] approach 1 at 1000 K, whereas those of the best n-type TE oxides barely exceed 0.8.[Reference Koumoto, Wang, Zhang, Kosuga and Funahashi5, Reference He, Liu and Funahashi7] It is, therefore, of great scientific and technologic interest to improve TE performance of existing TE oxides and to develop new ones.
The most common way to enhance TE performance is increasing their PF with simultaneous reduction of their thermal conductivity. This is usually implemented by doping or microstructuring.[Reference Amouyal9, Reference Mori10] Unfortunately, this process is difficult to optimize due to the inter-dependent values of electrical conductivity and Seebeck coefficient, so that σ increases while S decreases upon increase of the charge carrier concentration. Moreover, manipulation by electron scattering is extremely challenging. The most common electron-scattering mechanisms are deformation potential by acoustic and optical phonons, polar scattering by optical phonons, and short-range deformation and Coulomb potentials exerted by vacancies.[Reference Huang and Kaviany11] Doping affects all of these contributions by band structure and effective mass variations. Therefore, a systematic study of the effects of doping is essential to understand transport mechanisms, with expected implications for enhancing TE conversion efficiency. Of prime importance is developing theoretical procedures with considerable predictive power; in this context, the density functional theory (DFT) establishes a robust basis.[Reference Martin12–Reference Tsujii and Mori16] This approach provides reasonable accuracy in the prediction of physical observables with reasonable computational cost.[Reference Martin12–Reference Tsujii and Mori16] It, however, does not provide adequate description for highly correlated systems.[Reference Iv, Janz, Gali and Abrikosov17] The hybrid formalism enables improving the exchange-correlation energy, whereas the Hubbard-corrected DFT approximation (DFT + U) is widely used to handle strongly interacting particles (see[Reference Iv, Janz, Gali and Abrikosov17] and references therein). Unfortunately, neither hybrid functionals nor DFT + U provide adequate description of electronic band structure of correlated point defects in most semiconductors.[Reference Iv, Janz, Gali and Abrikosov17] Moreover, these approaches increase substantially the computational cost of DFT calculations and could be hardly employed to study the doping process. Therefore, a systematic study of the feasibility limits of DFT for description of TE materials, as well as for developing alternative solution to this problem, is of a great scientific and technologic importance.
Herein, we study the electronic properties of Ni-doped ZnO applying a combination of DFT calculations and experimental approaches.[Reference Koresh and Amouyal18] Zinc oxide is intrinsically an n-type semiconductor with E g~3.3 eV at 27 °C, having the Wurtzite P63mc space-group symmetry.[Reference He, Liu and Funahashi7, Reference Özgür, Alivov, Liu, Teke, Reshchikov, Doğan, Avrutin, Cho and Morkoç19–Reference Colder, Guilmeau, Harnois, Marinel, Retoux and Savary21] We calculate the electronic properties of Ni-doped ZnO compounds applying DFT combined with the Boltzmann transport equation (BTE).[Reference Madsen and Singh22] We use DFT + U to represent the effects of fine features of the electronic band structure near the Fermi level (E F) on σ and S. We also investigate the effects of Ni-doping level on electronic relaxation time and how the latter depends on temperature.
Computational and experimental methods
We perform DFT calculations for the paramagnetic state of the Ni-doped ZnO phase using the projector-augmented wave method as implemented for a planar wave basis set, employing the VASP (Vienna ab initio Simulation Package).[Reference Kresse23] Being a wide band gap semiconductor (~3.3 eV),[Reference Janotti, Walle and De24] DFT hardly provides an adequate description for the band structure and band gap value of ZnO.[Reference Janotti, Walle and De24, Reference Azmin, Syafiq, Kamil, Fariz and Taib25] Employing the DFT + U approximation provides partial solution,[Reference Janotti, Walle and De24–Reference Mohammadi26] with some discrepancy between theoretical and experimental values.[Reference Mohammadi26, Reference Von Barth and Hedin27] Moreover, the band gap does not depend substantially on the U-parameter for U = 4 eV or greater. Hybrid functionals,[Reference Heyd, Scuseria, Ernzerhof, Heyd, Scuseria and Ernzerhof28] in turn, enable improvement of the accuracy of the exchange-correlation energy, and provide better agreement between calculated and experimental band gap values; these calculations are, however, extremely expensive in terms of computational time and can be barely applied for calculation made for supercells as described further below. We, therefore, consider the exchange-correlation energy in the framework of the classical local spin density approximation (LDA),[Reference Von Barth and Hedin27] applying the Hubbard U-correction to consider the strong correlation between the Zn-3d and Ni-3d electrons,[Reference Himmetoglu, Floris, De Gironcoli and Cococcioni29] using separate hybrid functional HSE06 as a reference point for band gap correction.[Reference Heyd, Scuseria, Ernzerhof, Heyd, Scuseria and Ernzerhof28] We use U = 5.5 eV and J = 1.1 eV values, which provide reasonable agreement with computational results available in the literature.[Reference Yaakob, Hussin, Taib, Kudin, Hassan, Ali and Yahya14] A high-density (>0.2/Å) k-mesh grid with an energy cut-off of 520 eV for the valence electronic wave functions’ expansion is applied for total energy calculations. A pseudopotentials representing the valence state configuration was set with the 3d and 4s states for Zn and Ni and 2s and 2p states for O. We set a convergence criterion of 10−5 eV for geometry optimization with lattice relaxation down to an extra fine 0.001 eV/Å force threshold.[Reference Wallace30] We determine the temperature-dependent electronic transport coefficients based on DFT calculations of the density of states (DOS) and applying the semi-classical BTE in a procedure detailed by us elsewhere.[Reference Baranovskiy and Amouyal31–Reference Joseph and Amouyal33] Herein, we employ the commonly used constant electron relaxation time (τ e) approximation (RTA),[Reference Madsen and Singh22, Reference Allen and Trivedi34, Reference Allen, Pickett and Krakauer35] assuming that τ e is band- and temperature-independent and isotropic. This approach is realized in the “BoltzTrap” code,[Reference Madsen and Singh22] which is known to provide good agreement with the experimental data for practical applications.[Reference Joseph and Amouyal33, Reference Zhang, Lu, Zhang and Zhang36, Reference Wang, Chen, Cui, Niu, Wang, Wang, Ma and Zou37]
It is noteworthy that τ e is determined by the ratio between a charge carrier energy, εi k, of a given band index, i, and electron wave vector, k, and the typical vibrational energy per atom, about k BT,[Reference Seeger38] where k B is the Boltzmann constant. Moreover, there are evidence that strong temperature dependence of τ e may govern the S(T) and σ(T) behavior.[Reference Baranovskiy and Amouyal31, Reference Hao, Shi, Dravid, Kanatzidis and Wolverton39] Hence, detailed investigation of the temperature and energy dependences of τ e can shed light on the mechanisms of electron scattering. Direct determination of the electronic scattering mechanism is, however, very challenging, due to the variety of electron scattering mechanisms mentioned above,[Reference Huang and Kaviany11] which are affected by doping. Therefore, to evaluate the influence of various scattering mechanisms, the S(T) and σ(T) dependences were calculated assuming that the electron relaxation time is a phenomenologic function of temperature solely [Eq. (2)] or of both temperature and energy [Eq. (3)].
 $$\tau _{\rm e} = \tau _0 + A{\rm e}^{ - (T - T_0 /B)}, $$
 $$\displaystyle{\hbar \over {\tau _{\rm e}}} = \displaystyle{{\pi W^2} \over 6}g(\varepsilon ) + C\displaystyle{{(k_{\rm B} T)^2} \over {\varepsilon - E_{\rm F}}}. $$
Equation (2) represents the universal exponential dependence applied by us earlier for CaMnO3,[Reference Baranovskiy and Amouyal31] which contains the four fitting parameters τ 0, A, B, and T 0. Here τ 0 and A denote the high- and low-temperature limits of τ e, respectively, and B represents decrease rate of τ e with temperature. Equation (3) consists of two different contributions: the first one denotes the effects of electron–electron scattering, while the second one reflects the temperature dependence.[Reference Bouzerar, Thébaud, Adessi, Debord, Apreutesei, Bachelet and Pailhès40] W and C are fitting parameters representing electron–electron and electron–phonon interactions, respectively. C depends on the Thomas–Fermi screening length, charge carrier concentration, and the topology of the Fermi surface, and cannot be simply evaluated. W, in turn, can be determined from the σ(T → 0) limit.[Reference Bouzerar, Thébaud, Adessi, Debord, Apreutesei, Bachelet and Pailhès40]
Pure and 3 at.% Ni-doped ZnO compounds are produced applying a solid-state reaction of ZnO and Ni-salts by sintering, including powder compaction into green bodies, which are fired at 750 °C for 1 h in air to form NiO. Subsequently, we sinter the pellets in air at 1400 °C for 5 h for densification and to dissolve Ni2+ ions in the ZnO-matrix, followed by air quenching to prevent uncontrolled precipitation of primary NiO-phase. Finally, we perform aging heat treatments in air at 750, 800, and 900 °C for several durations. Then, we measure electrical conductivity and Seebeck coefficients of all samples for a wide temperature range. These values are further utilized as reference data points for the calculated transport coefficients. A detailed description of the experimental procedures is given elsewhere.[Reference Koresh and Amouyal18]
Results and discussion
Determination of electronic transport properties
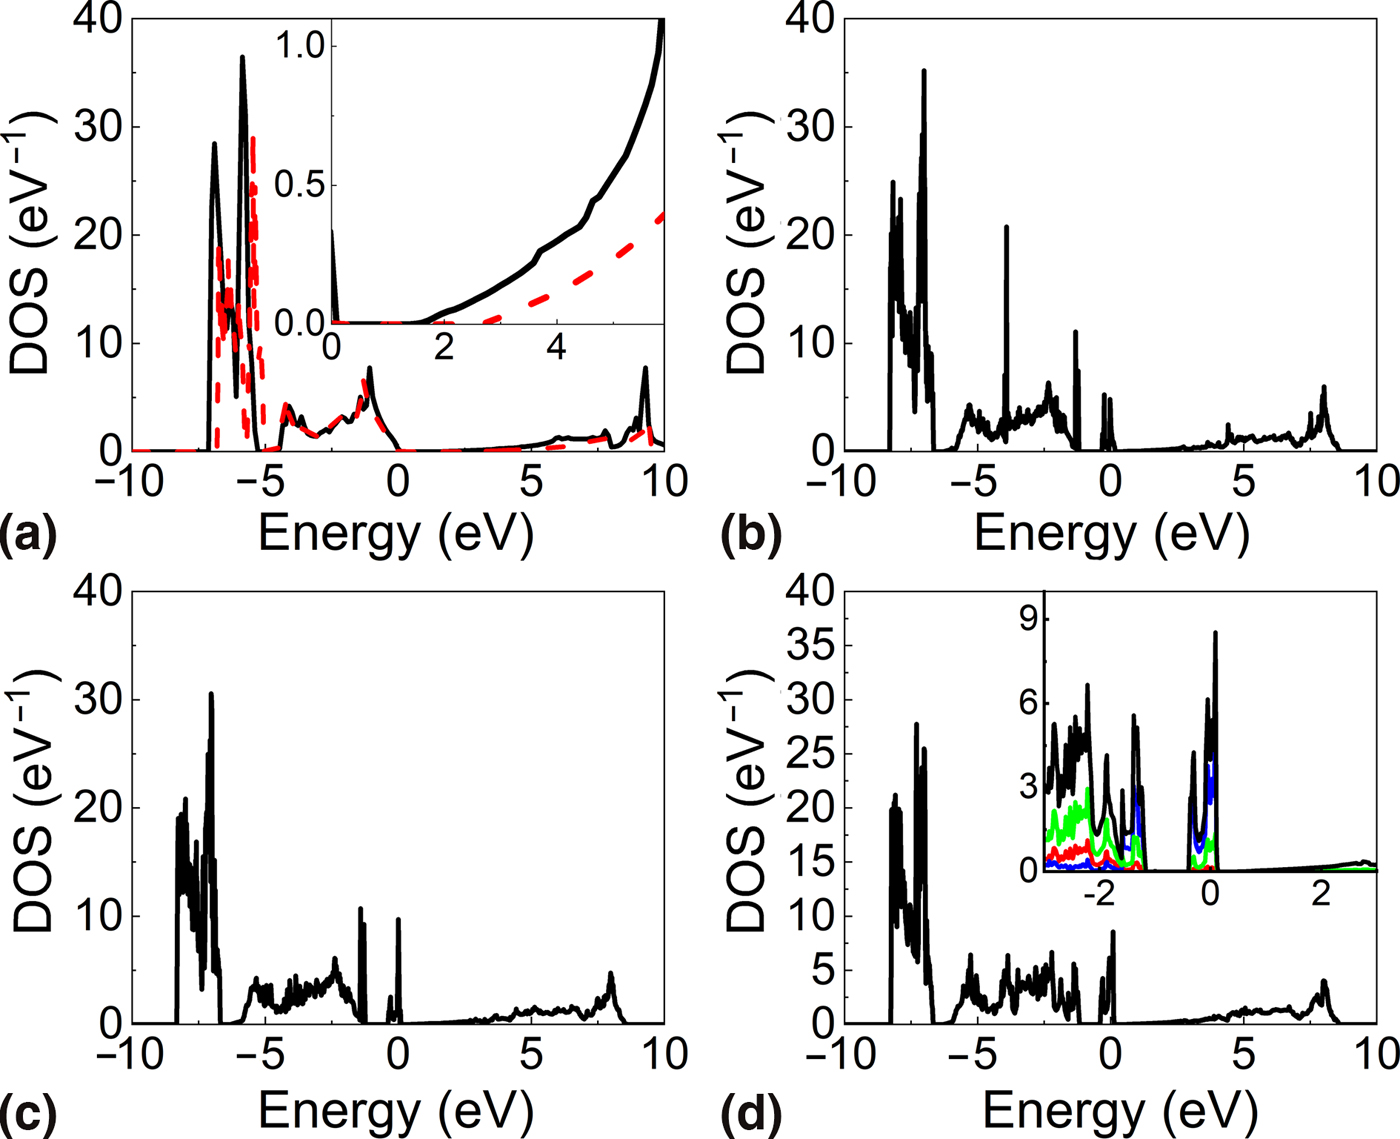
We perform DFT calculations for the pure and Ni-doped ZnO compounds by constructing a series of supercells containing 4, 8, and 12 primitive cells, where Ni atoms arbitrarily substitute for Zn atoms. In this manner, a series of structures corresponding to the doping levels of 6.25, 3.125, and 2.08 at.% Ni were obtained, respectively. Electronic band structures and DOS are calculated for these pure and Ni-doped structures. Figure 1 shows the calculated DOS for the (a) pure and (b) 2.08, (c) 3.125, and (d) 6.25 at.% Ni-doped ZnO structures.
The electronic density of states (DOS) per primitive cell calculated for the (a) pure ZnO applying LDA + U (solid black line) and HSE06 (dashed red line) and ZnO doped with (b) 2.08 at.% Ni, (c) 3.125 at.% Ni, and (d) 6.25 at.% Ni. The Fermi level corresponds to E = 0. The inset in (d) indicates the total (black line) and partial contributions to the DOS from the Zn d states (red line), O p states (green line), and Ni d states (blue line).
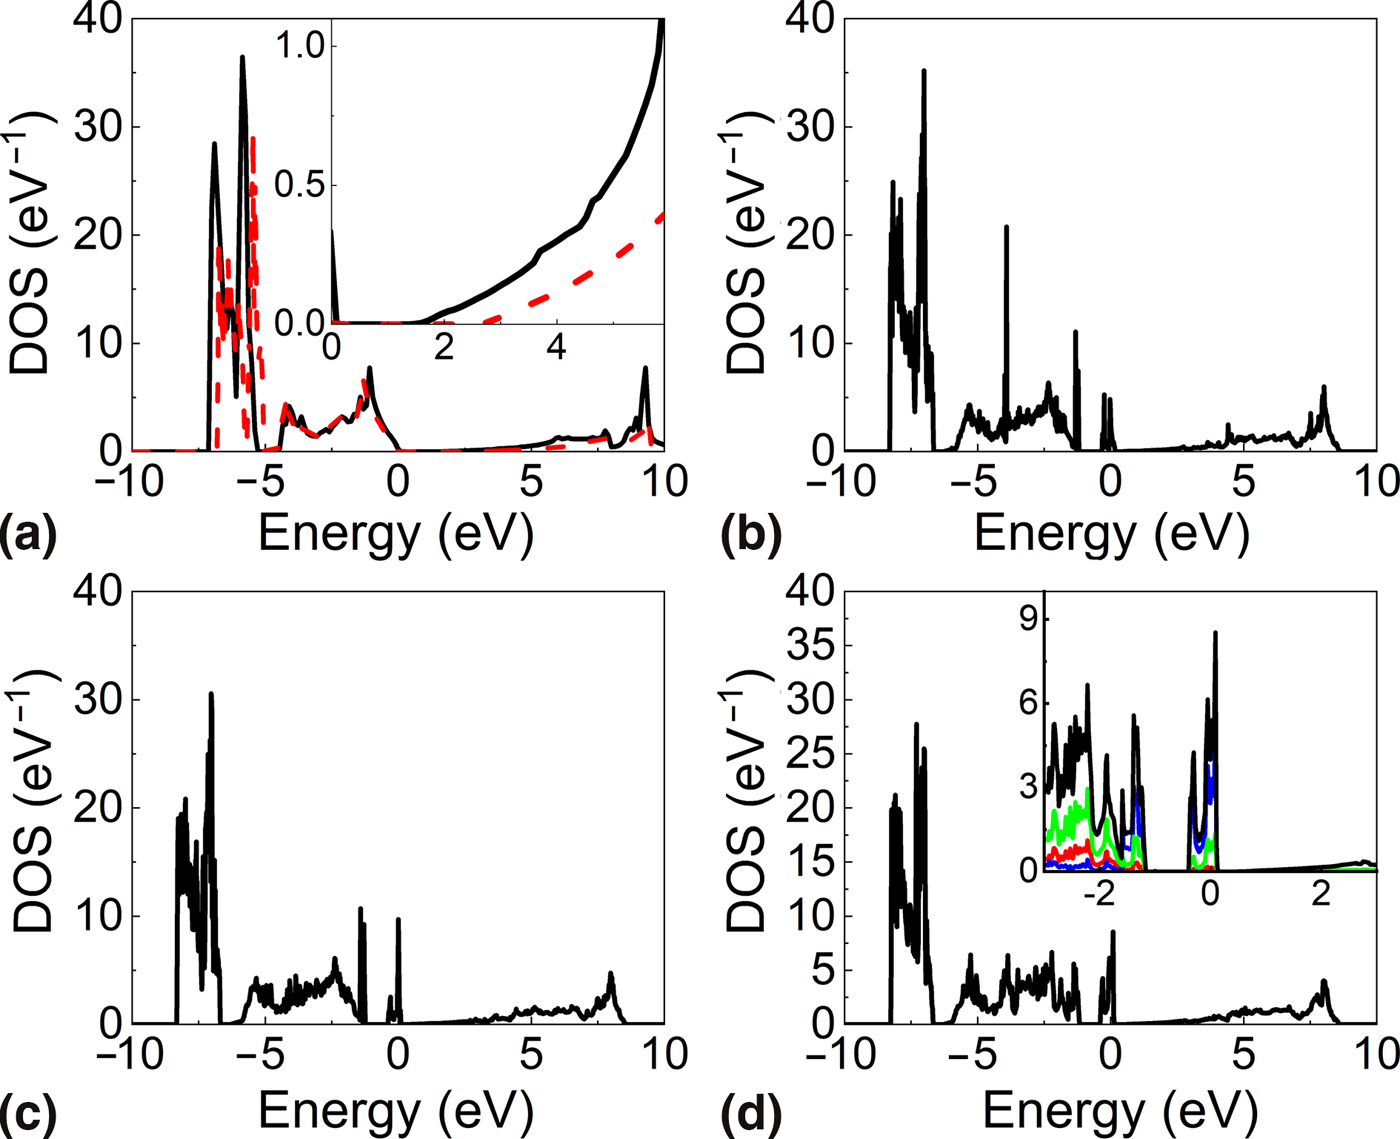
Our LDA + U results indicate that ZnO is a semiconductor with a direct band gap of about 1.5 eV. This value is typical for LDA + U calculations,[Reference Janotti, Walle and De24–Reference Mohammadi26] which underestimate E g with respect to the experimental value of E g = 3.3 eV.[Reference Janotti, Walle and De24] Implementation of the HSE06 hybrid functional increases the calculated band gap value up to 2.7 eV [Fig. 1(a)]. Simultaneously, other parameters of electronic spectrum such as effective masses and corresponding transport coefficients are found to be very similar when calculated using either LDA + U or HSE06 functionals. Therefore, for the sake of simplicity, we carry out LDA + U calculations for Ni-doped structures keeping in mind the necessity of E F correction applying the procedure described below.
Our calculations reveal that the upper part of the valence band is dominated by O p- and Zn d-orbitals, whereas the lower part of the conduction band is mainly formed by O p- and Zn s-electrons. These results are in good agreement with those reported in the literature.[Reference Janotti, Walle and De24–Reference Mohammadi26] The inset in Fig. 1(d) indicates the partial contributions of the Zn d-states, O p-states, and Ni d-states to the total DOS.
It is shown that Ni-doping results in the appearance of a sharp resonance peak inside the band gap, originating mainly from partial contribution of Ni d-electrons, with small contribution from the O p-states. Moreover, the intensity of this peak increases with increasing Ni concentration. Additionally, Ni d-electrons dominate in the upper part of the valence band. This attests that the Ni-dopant acts as electron donor and increases the electrons concentration. Conversely, the contribution of Zn to the partial DOS at the vicinity of the resonance peak is negligible.
Comparison with experimental trends is very instructive, keeping in mind that aging heat treatments performed for Ni-supersaturated ZnO reduces the average concentration of Ni in the matrix from the nominal 3 at.% to lower values. Since Ni-dopants act as electron donors, aging reduces σ and increases S.[Reference Koresh and Amouyal18] To simulate ab initio depletion of Ni from the ZnO-matrix due to aging, we shift the calculated DOS to a Fermi level corresponding to the actual dopant concentration in accordance with the experimentally acquired temperature-dependent Seebeck coefficients. We utilize S to represent fitting to experimental data, since it reflects the charge carrier polarity and concentration, and is sensitive to the position of E F in particular, however independent of τ e in first approximation (RTA). The resulting shift of E F is −0.406 eV for all doped samples and 1.25 eV for the pure ZnO.
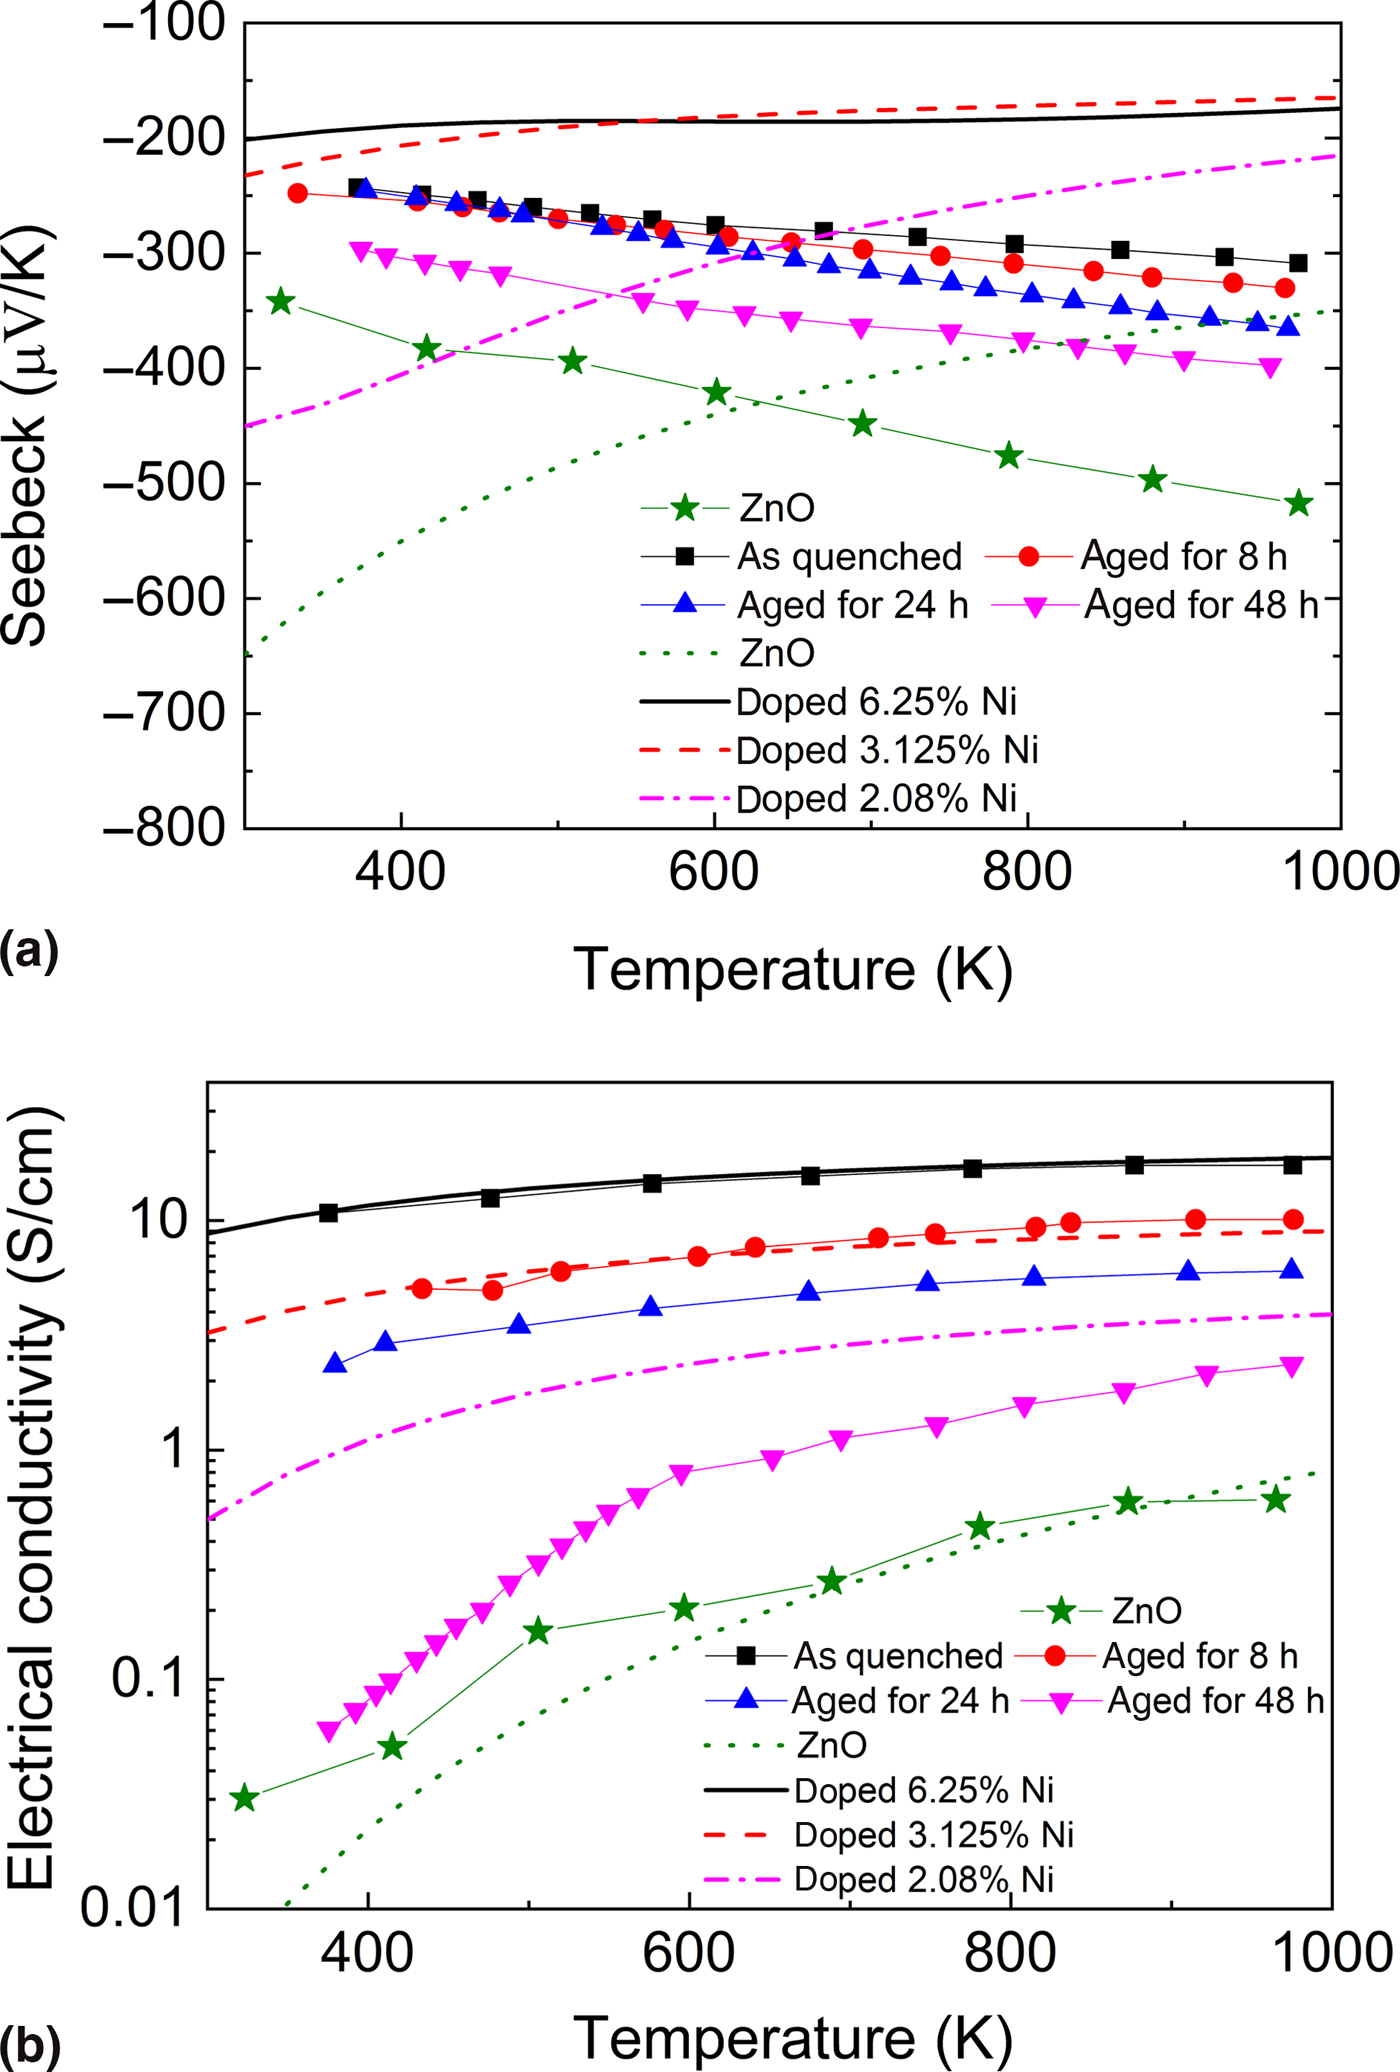
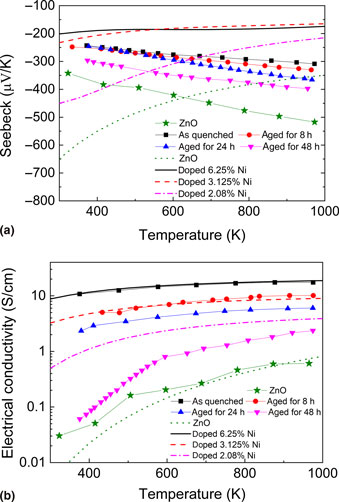
Figure 2(a) displays the temperature-dependent S-values calculated for Ni-doped ZnO as curves, next to the experimental data points measured by Koresh and Amouyal[Reference Koresh and Amouyal18] for the series of Ni-doped samples aged at 750 °C. All samples exhibit S < 0, indicative of n-type nature. Pure ZnO exhibits the highest |S|-values, whereas the as-quenched ones possess the lowest values through the entire temperature range. In addition, |S| increases with aging time. These results are consistent with our calculated trend, indicating the increase of |S|-values with decreasing Ni concentration.
The temperature-dependent (a) Seebeck coefficients and (b) electrical conductivity calculated for Ni-doped ZnO, marked as curves for 6.25 (black solid line), 3.125 (red dash line), and 2.08 at.% Ni (magenta dash-dot line), as well as pure ZnO (olive dotted line). For comparison, the experimental datasets for the pure and as-quenched ZnO samples and for the samples aged for 8, 24, and 48 h are presented, marked by olive stars, black squares, red circles, blue up-triangles, and magenta down-triangles, respectively.

Following the way we determined E F based on the experimental S-values, we are able to evaluate the temperature dependence of electrical conductivity using the BTE. As recalled, σ(T) depends on τ e, and the latter cannot be directly quantified from first principles. Therefore, adjusting the calculated σ(T) to the experimental data reported by Koresh and Amouyal[Reference Koresh and Amouyal18] enables us evaluate τ e = 0.2 fs. This value of electronic relaxation time seems to be reasonable for oxides at elevated temperatures, and agrees well with the result obtained for CaMnO3.[Reference Baranovskiy and Amouyal31] The σ(T) datasets are presented in Fig. 2(b). It is shown that the higher the Ni concentration (or, in other words, the shorter the aging time) is, the higher its electrical conductivity is. The lowest σ values are found for pure ZnO both experimentally and theoretically. Concurrently, the highest electrical conductivities are featured by samples with highest Ni concentrations. Consequently, the as-quenched sample possesses the lowest |S| and the highest σ-values, whereas for ZnO the situation is opposite. The aged samples, in turn, represent the reduction of the Ni concentration in the ZnO-matrix due to the formation of NiO-precipitates.[Reference Koresh and Amouyal18]
Evaluation of the electron relaxation times
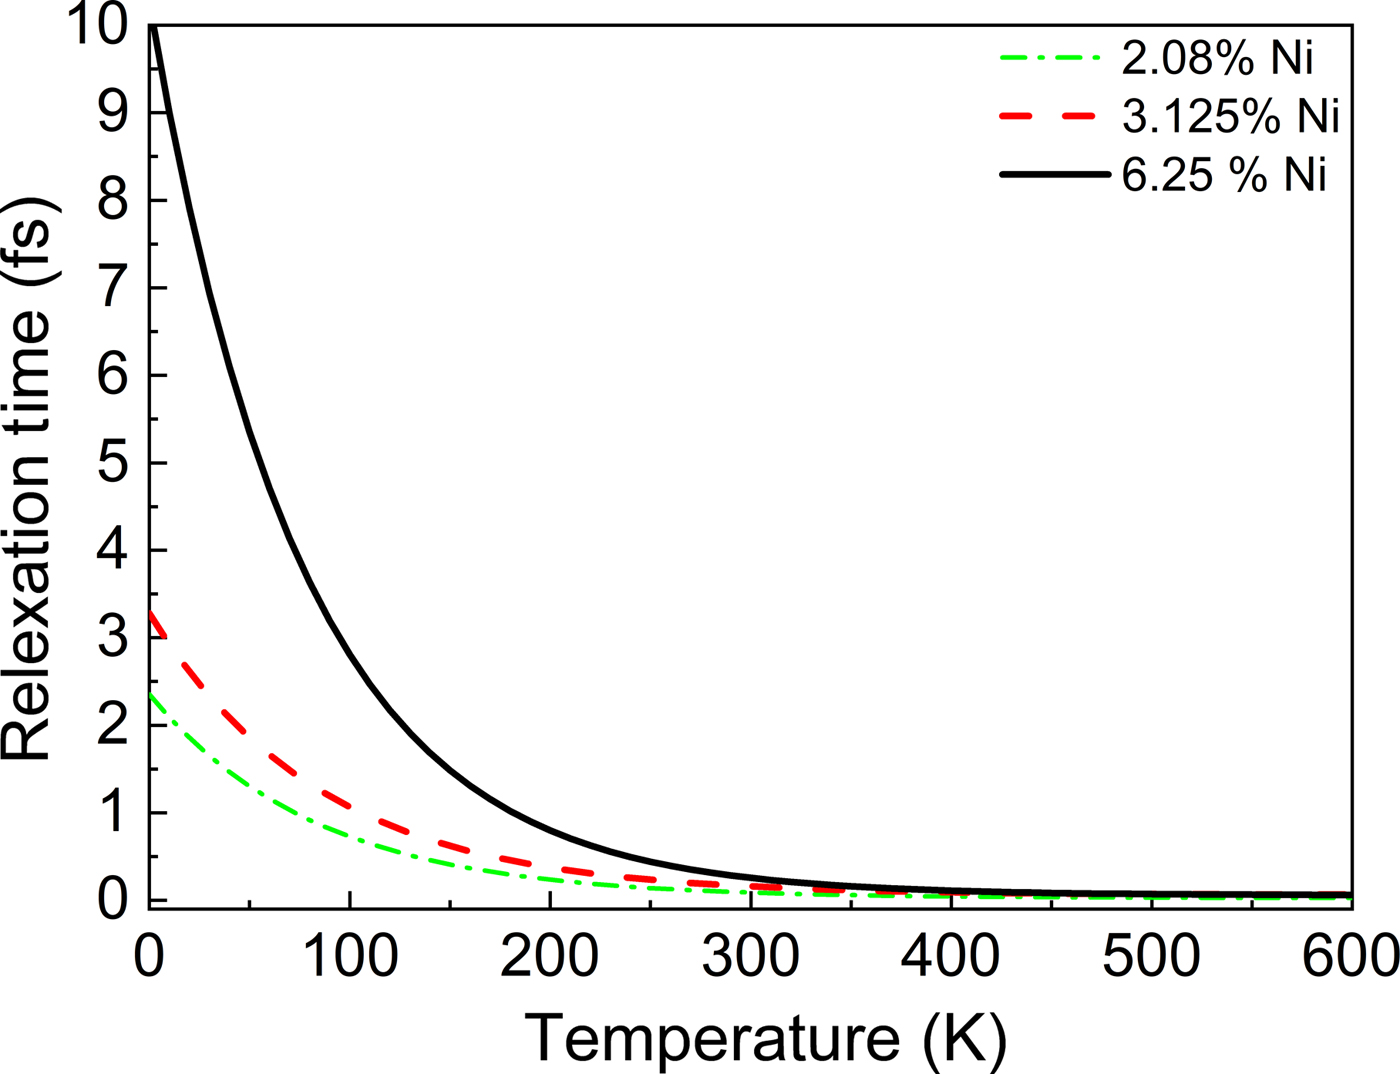
Although the theoretical σ(T) and S(T) dependences that are evaluated applying the constant RTA qualitatively agree with those measured experimentally and shed light on the role of Ni as a dopant, quantitative differences between theoretical and experimental data exist yet. We associate them to the temperature dependence of τ e. To address this issue, we recalculate σ(T) and S(T) applying the BTE, considering the temperature dependence of τ e(T) [Eq. (2)]. We evaluate τ e(T) by adjusting the calculated σ-values to the experimental ones for every individual experimental data point. Thus, τ e is treated applying the constant RTA for each temperature.[Reference Madsen and Singh22, Reference Baranovskiy and Amouyal31, Reference Allen and Trivedi34, Reference Allen, Pickett and Krakauer35] The explicit temperature-dependent expressions for τ e of ZnO with different Ni concentrations are presented in Fig. 3.
The temperature-dependent electron relaxation times, τ e (T), as derived from the analysis of the experimental and calculated temperature-dependent forms of the electrical conductivity, plotted for ZnO doped with 6.25 (black solid line), 3.125 (red dash line), and 2.08 at.% Ni (green dash dot line).
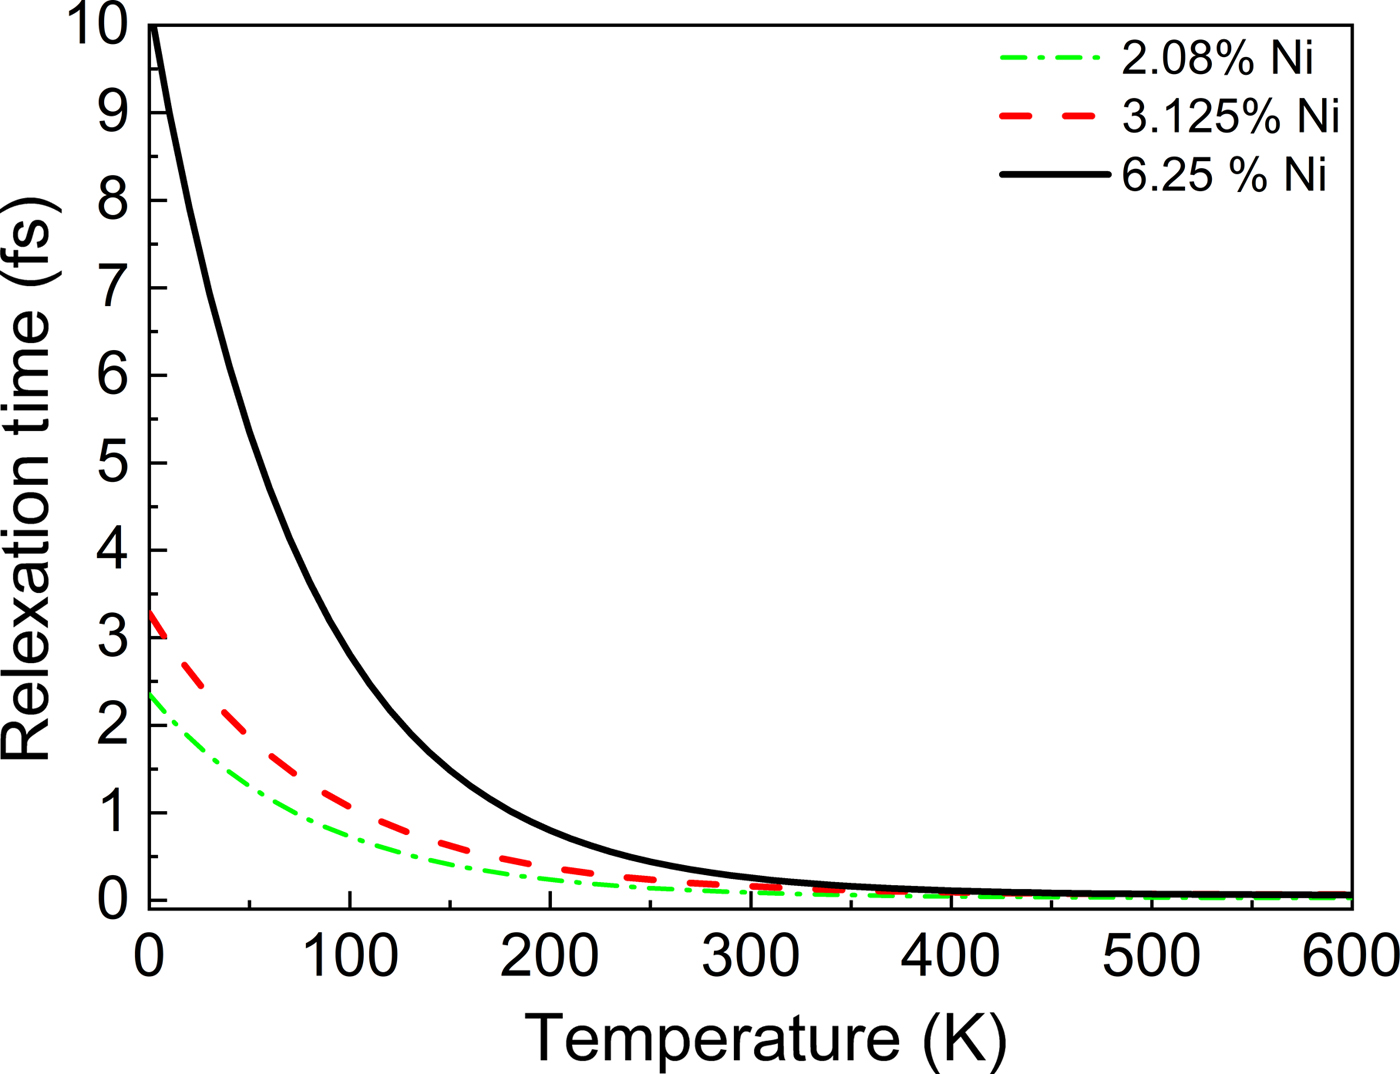
As expected, τ e(T) strongly decreases with temperature. Moreover, a fundamental difference in the τ e(T) behavior between low temperatures (below 400 K) and higher temperatures is observed. Whereas for temperatures above 400 K, the electron relaxation times are nearly temperature independent and are close to each other for the three Ni concentrations, for lower temperatures the τ e(T) values exhibit stronger temperature and concentration dependences in a way that τ e decreases with both temperature and Ni-concentration. Typical numerical values as well as fitting parameters evaluated from Eq. (2) appear in Table I, e.g., τ e evaluated for 0 and 1000 K differ by ~2 orders of magnitude. This trend can be associated with the rise of partial Ni d-electronic DOS near the Fermi level [Fig. 1(d)]. It should be mentioned that the τ e(0 K) values evaluated in the present contribution are found to be in rather good agreement with available experimental data,[Reference Brida, Gadermaier, Polli, Kabanov, Mihailovic, Cerullo, Tsen, Song, Betz and Elezzabi41, Reference Bennemann42] although the τ e values determined in this study are somewhat shorter than typical values determined for metals (~10−14 s).[Reference Brida, Gadermaier, Polli, Kabanov, Mihailovic, Cerullo, Tsen, Song, Betz and Elezzabi41, Reference Bennemann42] This is indicative of strong electron–phonon interactions and possible effects of additional scattering mechanisms untypical for metals.

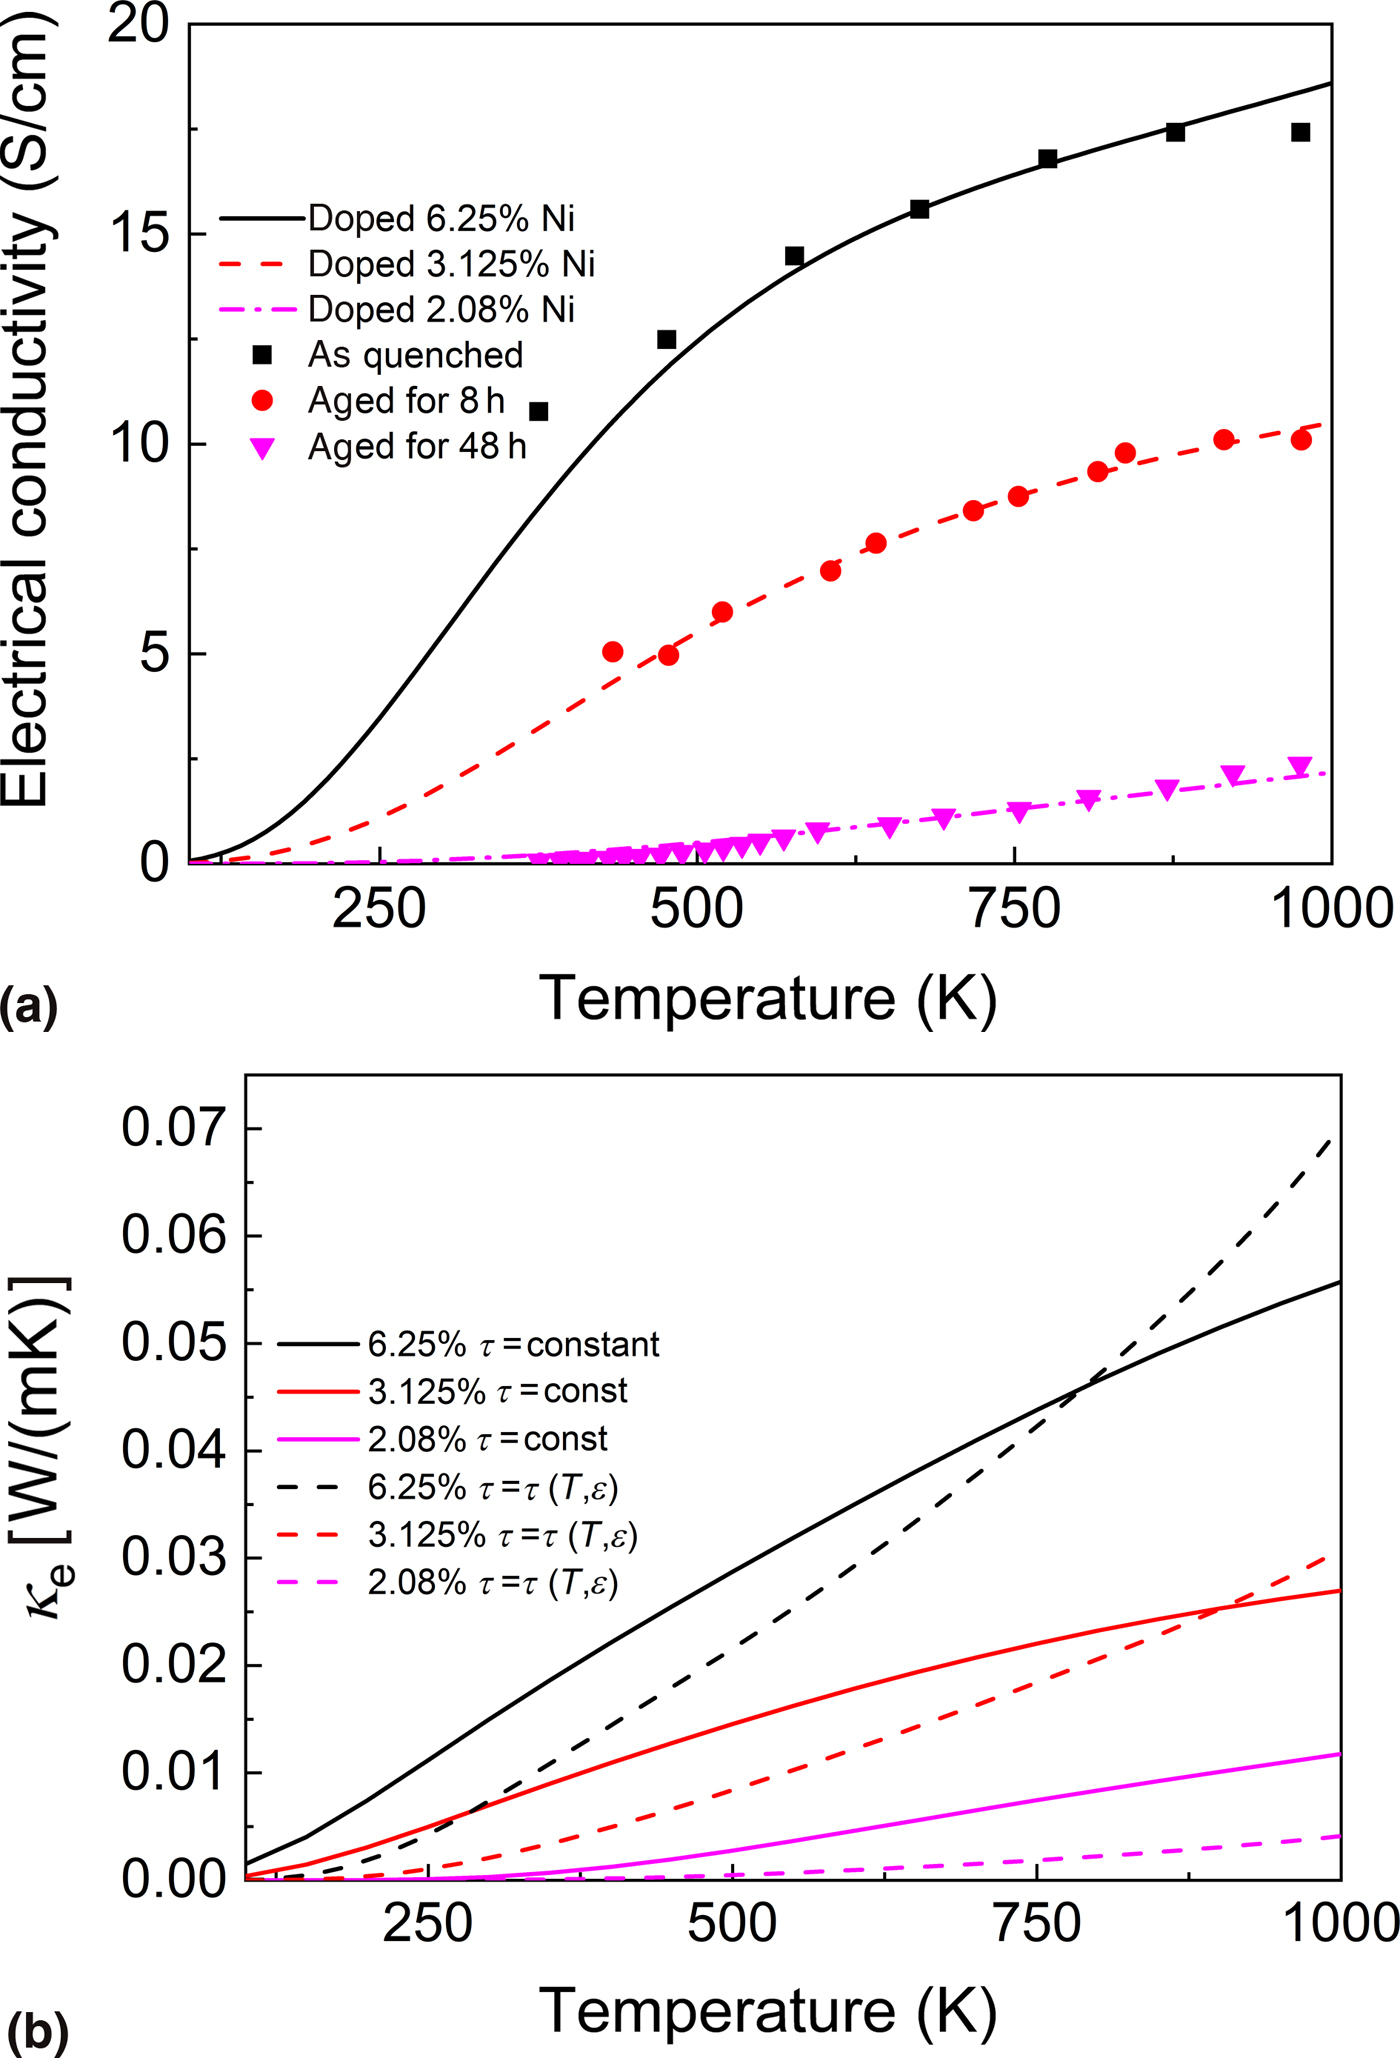
To shed light on the origin of this trend, we will now consider both energy and temperature effects, as reflected in Eq. (3). The first term in Eq. (3) denotes the temperature-independent effect of disorder resulting from doping and the presence of other point defects, while the second one is the temperature-dependent part, originating from electron–phonon scattering.[Reference Bouzerar, Thébaud, Adessi, Debord, Apreutesei, Bachelet and Pailhès40] The fitting parameters evaluated from Eq. (3) appear in Table I. The parameter W is responsible for temperature-independent scattering, and decreases monotonously with increasing dopant concentration. This should result in the rise of the low-temperature part of τ e, in agreement with the results shown in Fig. 3 and Table I. At the same time, the C parameter, which is responsible for the temperature-dependent processes, is found to be identical for the samples doped with 3.125 and 2.08 at.% Ni. As for the sample doped with 6.25 at.% Ni, C is somewhat larger than for the previous two, which can be associated to the influence of residual stresses and deviations from stoichiometry due to quenching. These trends indicate that electron conduction at temperatures lower than 400 K in Ni-doped ZnO is governed by the electronic structure in the vicinity of the Fermi level, particularly by the partial contribution from Ni d-electrons. Conversely, electron scattering at T > 400 K is completely dominated by thermal processes and does not depend on the dopant concentration. It should be noted that both low- and high-temperature values of electronic relaxation time determined in this study, as well as the τ e(T) dependence, agrees well with those available in the literature.[Reference Baranovskiy and Amouyal31, Reference Hao, Shi, Dravid, Kanatzidis and Wolverton39] Fig. 4(a) presents the σ(T) values derived based on the temperature and energy-dependent τ e, as reflected by Eq. (3).
The temperature-dependent (a) electrical conductivity and (b) electronic component of thermal conductivity calculated for ZnO doped with 6.25 (black solid line), 3.125 (red dash line), and 2.08 at.% Ni (magenta dash-dot line), assuming τ e =τ e(T, ε). For comparison, experimental dataset for the as-quenched sample and samples aged for 8 and 48 h are presented, marked by black squares, red circles, and magenta down-triangles, respectively.
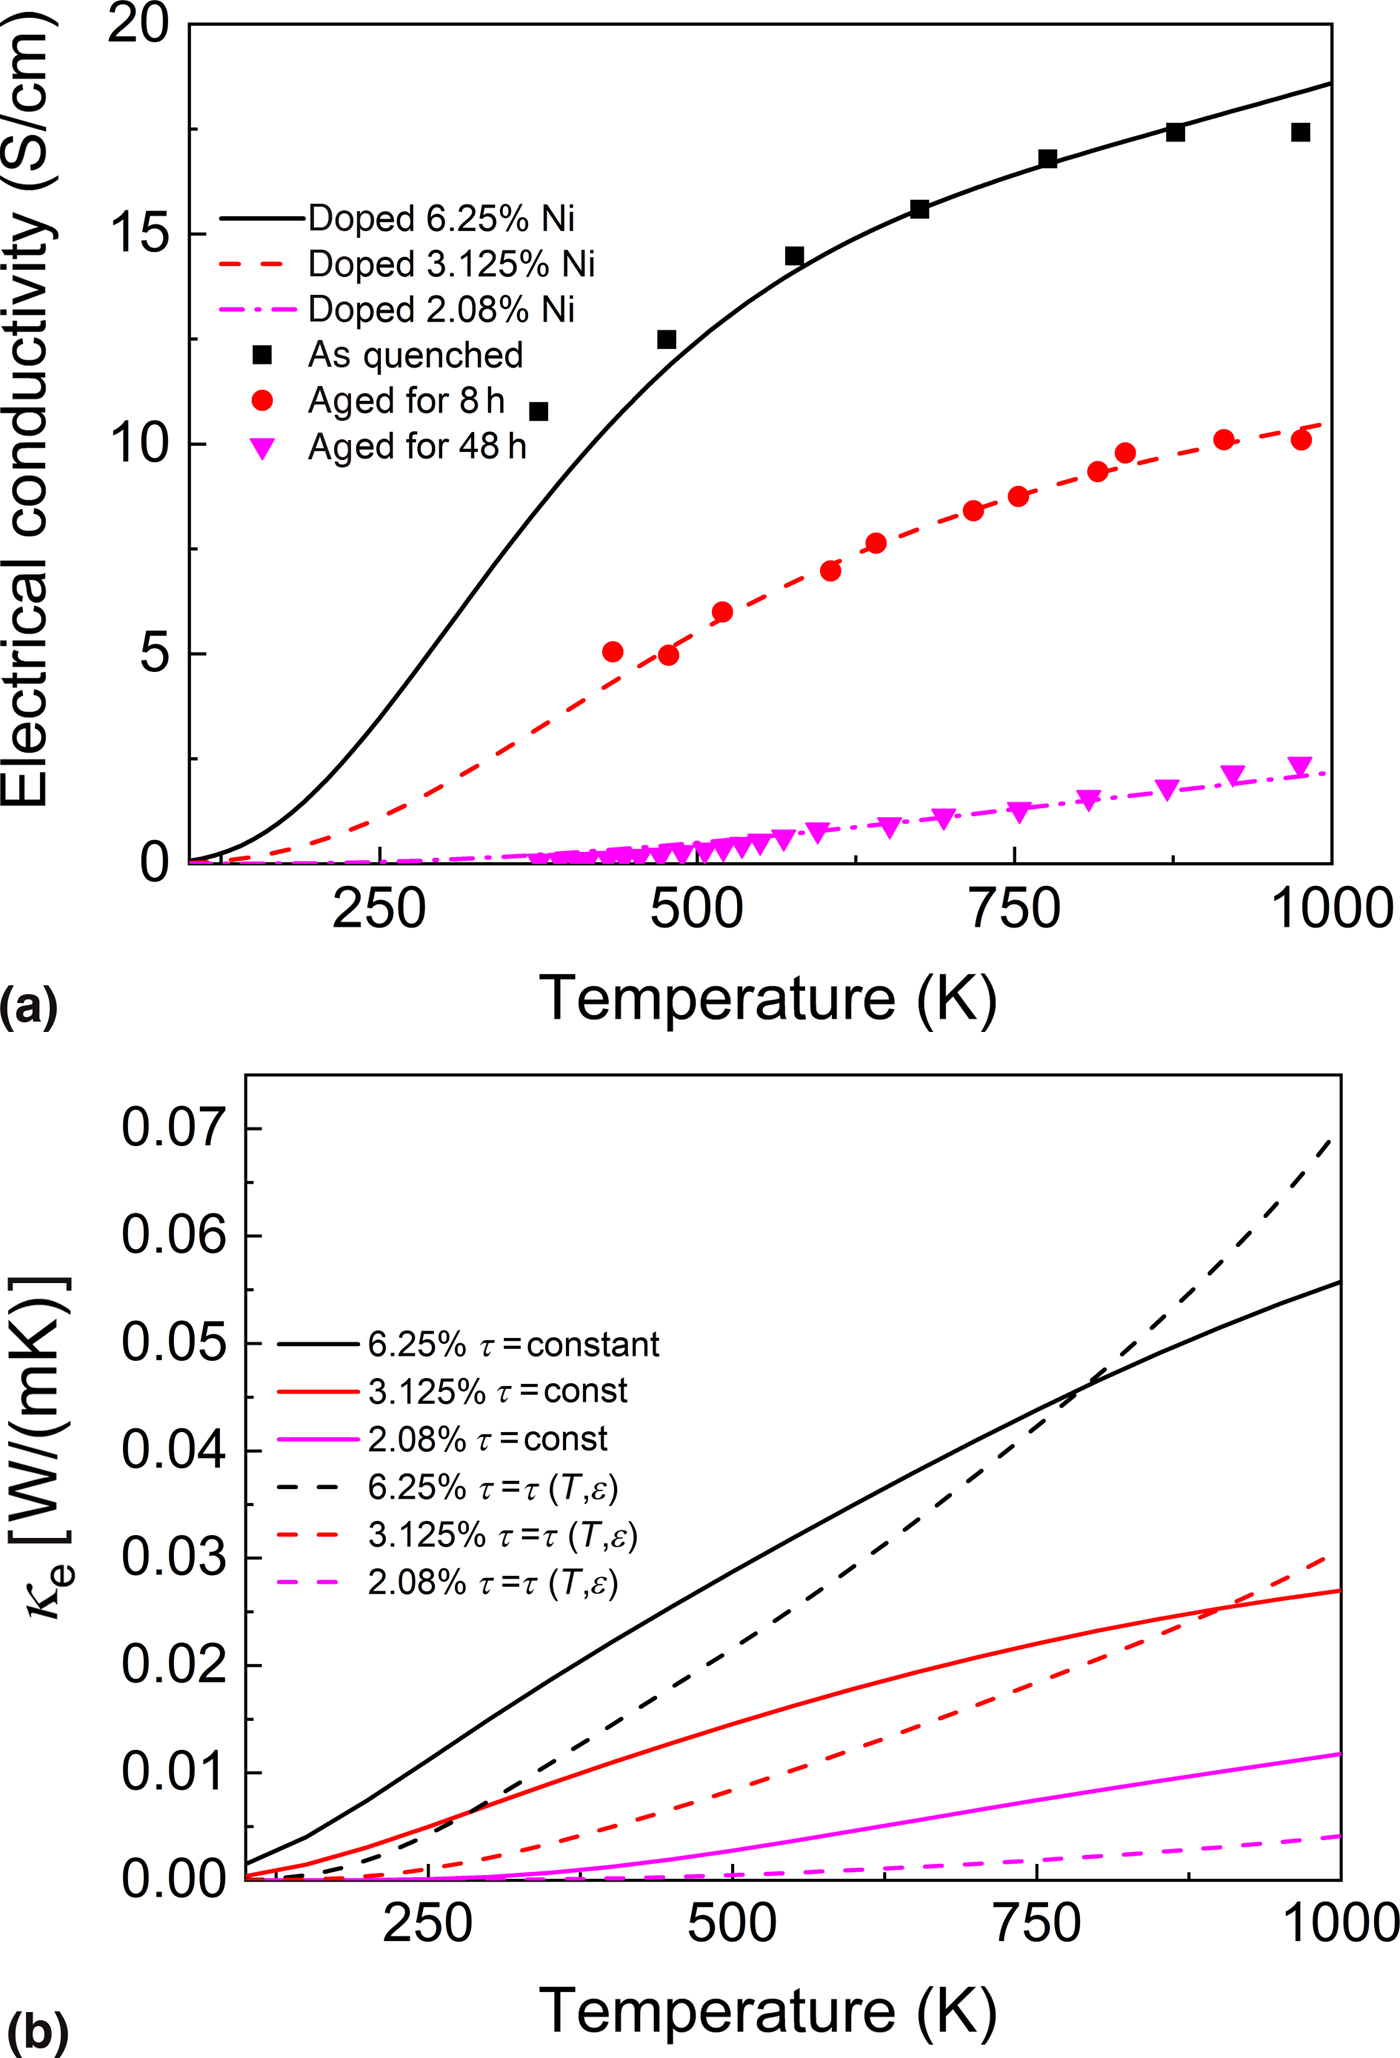
The calculated magnitudes are plotted on top of the experimental ones measured by Koresh and Amouyal[Reference Koresh and Amouyal18] indicating better accuracy with respect to those determined using the constant RTA. It is indicated that both temperature and energy dependences of τ e are necessary to obtain good agreement between theoretical and experimental conductivities, which is obtained for all concentrations and for the entire temperature range. It is also inferred from Fig. 4(a) that better agreement is obtained for longer annealing times, which may be associated to the relief of internal stains in the ZnO-matrix upon aging, where the degree of Ni-supersaturation decreases.
Our result is very instructive to further improve the TE performance of the ZnO system. Taking into account that σ is proportional to τ e (within the RTA),[Reference Madsen and Singh22, Reference Allen and Trivedi34, Reference Allen, Pickett and Krakauer35] our strategy should be increasing τ e. This can be realized through the increase of the parameters A and B [see Eq. (2)]. The first one is found to be proportional to the dopant concentration, while the second one seems to be governed by dopant type. Therefore, altering the type and amount of resonance dopants can result in electrical conductivity enhancement through controlled τ e manipulation, instead of the conventional way of increasing the charge carrier concentration. This may result in substantial improvement of TE conversion efficiency due to simultaneous rise of both σ and S values. In addition, particular attention should be paid to the investigation of the effects of magnetic impurities, especially for low temperatures. For instance, there is evidence that magnetic ion doping enhances the TE properties.[Reference Tsujii and Mori16, Reference Ahmed and Tsujii43–Reference Takaki, Kobayashi, Shimono, Kobayashi, Hirose, Tsujii and Mori45]
It should be noted that none of the above approaches improves considerably the agreement between experimental and calculated S(T) dependences, possibly since the Seebeck coefficient in this system is strongly anisotropic, which is not treated in our approach.[Reference Koresh and Amouyal18]
Evaluation of the Lorenz number
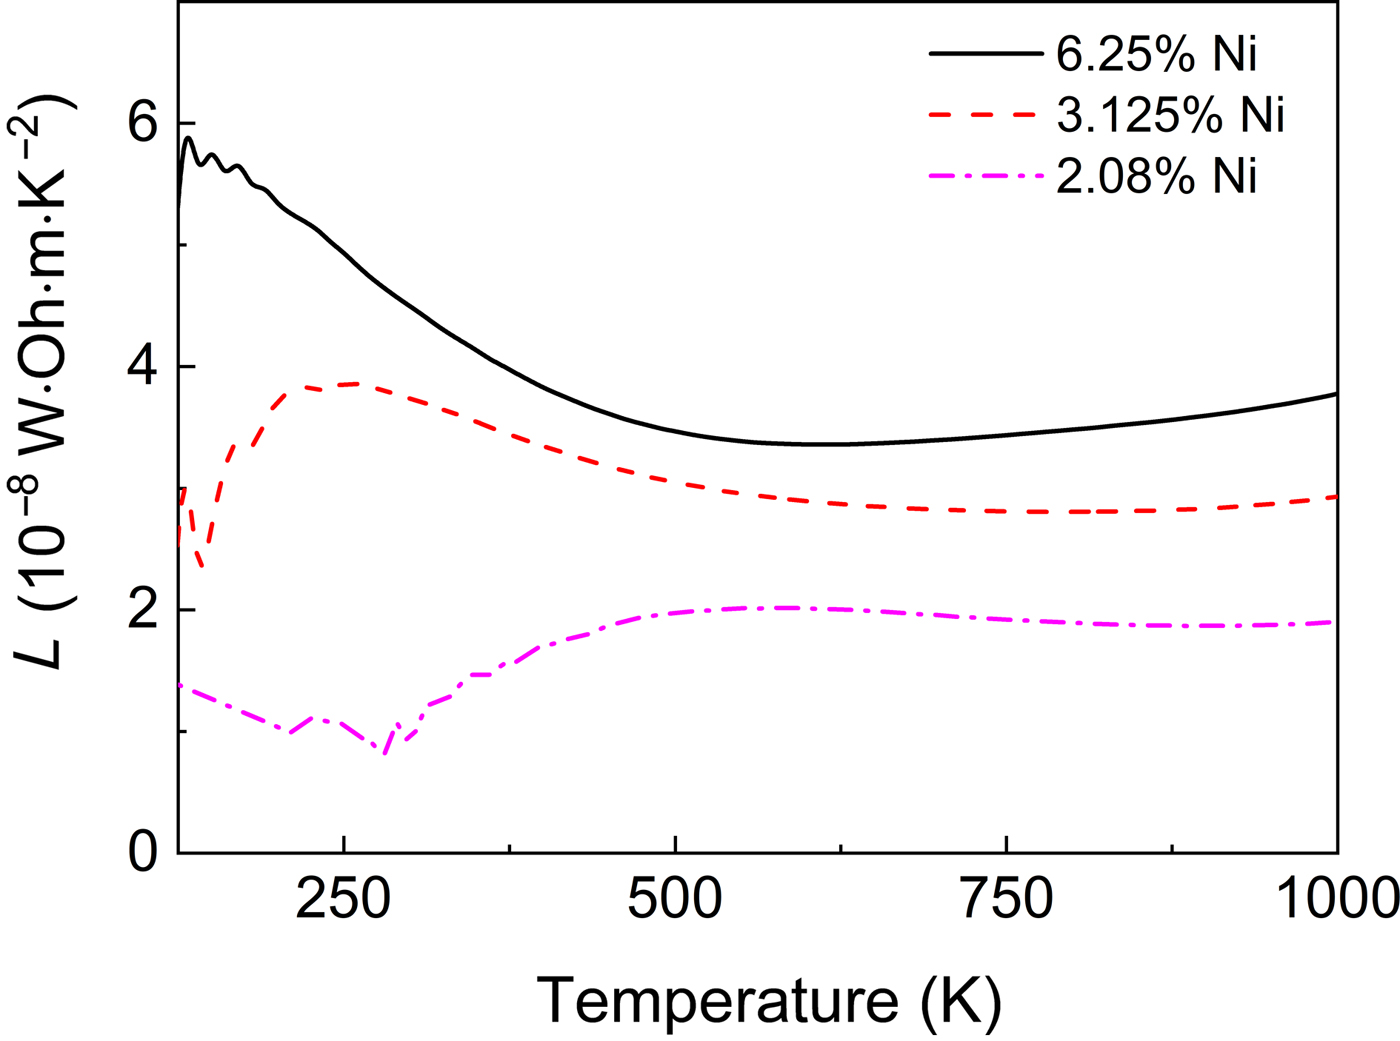
The calculated σ(T) magnitudes enable us analyze the electronic part of thermal conductivity, κ e(T), applying the BTE and Wiedemann–Franz (W–F) approaches, thereby evaluating the Lorenz number, L, as detailed elsewhere.[Reference Baranovskiy and Amouyal31] The results appear in Fig. 4(b). The values derived assuming τ e = τ e(T,ε) (dash lines) are slightly lower than those obtained applying the constant RTA, in full accordance with the electrical conductivity results. The L(T) dependences evaluated based on the W–F approximation are displayed in Fig. 5.
The temperature-dependent Lorenz number calculated for ZnO doped with 6.25 (black solid line), 3.125 Ni (red dash line), and 2.08 at.% Ni (magenta dash-dot line).
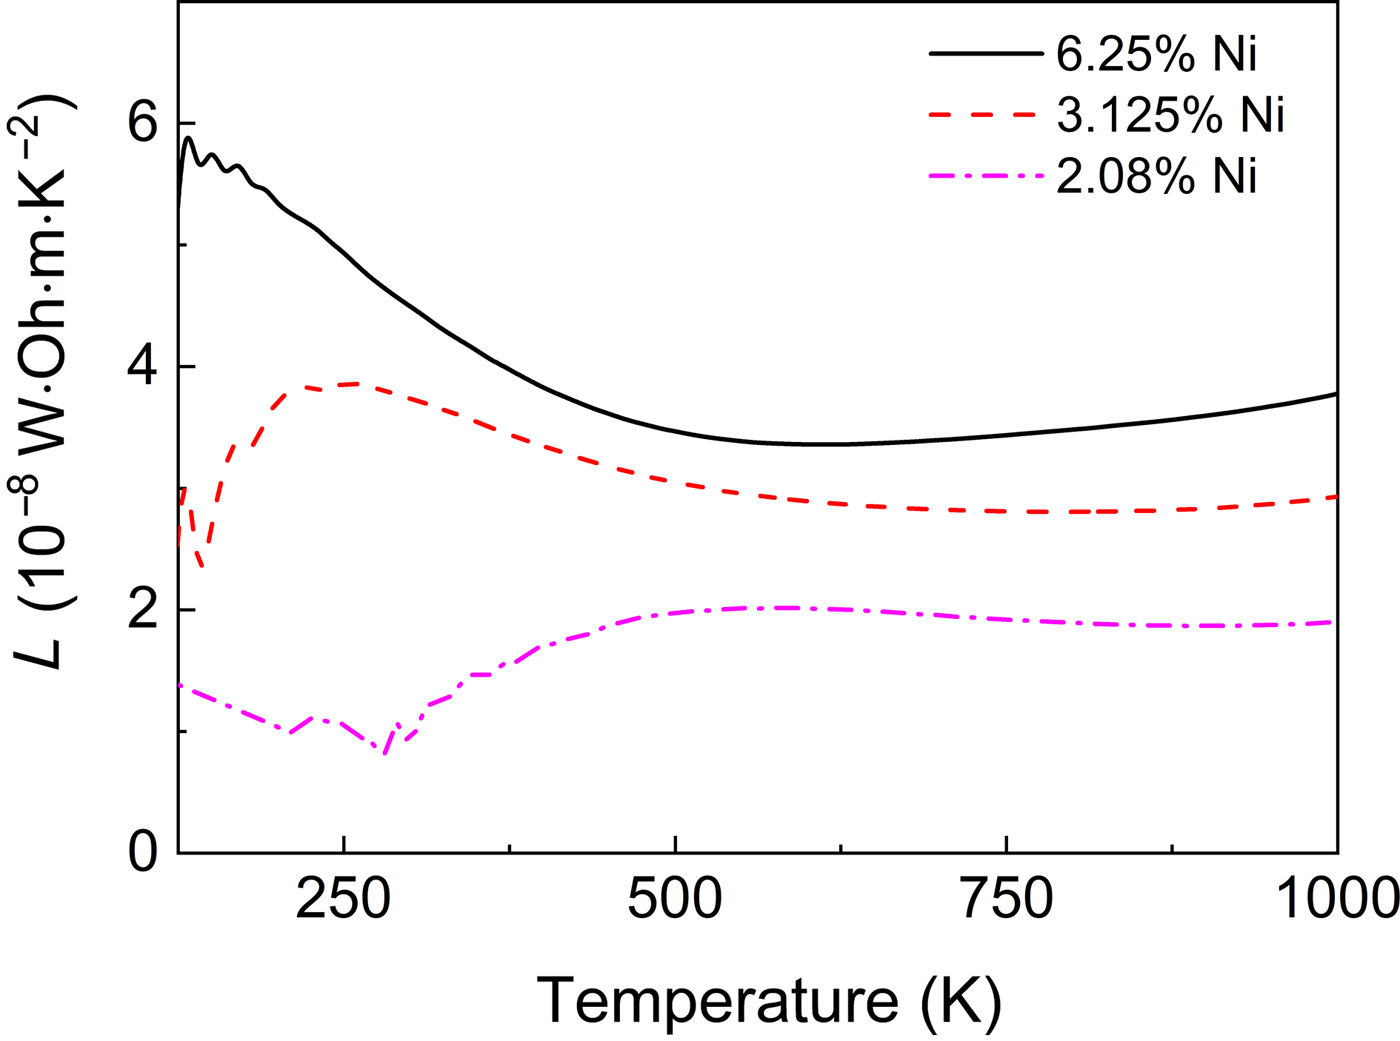
For adequately high temperatures, the Lorenz number is almost constant for all concentrations, where its absolute value increases monotonously with the Ni concentration, and for 6.25 at.% Ni, it remarkably exceeds the classical value of L 0 = 2.44 × 10⁻⁸ W.Ω.K−2. Then, L increases upon cooling, and reaches a maximum value at ~100 K. Such L(T) behavior is typical for Kondo systems with states localized in the vicinity of E F[Reference Kowalczyk, Falkowski and Toliński46]; however, in some cases, the higher Lorenz number is due to impurities.[Reference Kowalczyk, Falkowski and Toliński46] In this study, resonant Ni d-electron near the Fermi level accounts for Kondo-like behavior of the Lorenz number. This hypothesis is corroborated by the fact that 3.125 at.% doping demonstrates similar L(T) behavior, whereas further decrease of Ni concentration completely diminishes this effect (Fig. 5).
Conclusions
We calculate electronic transport properties of Ni-doped ZnO from first principles, and show that the upper part of the valence band is dominated by Ni d-, O p-, and Zn d-orbitals, whereas the lower part of the conduction band is mainly formed by O p- and Zn s-electrons. Ni-dopant acts as an electron donor and raises the charge carrier concentration. Ni-doping results in the appearance of a sharp resonant peak inside the band gap mainly due to partial contribution of Ni d- and O p-electrons. We calculate the Seebeck coefficients, electrical conductivity, and electronic part of thermal conductivity applying the Boltzmann transport theory, and compare them with experimentally measured transport coefficients, resulting in exact values of the Fermi energies and electron relaxation times. We find that electronic transport properties above 400 K are dominated by thermal scattering, whereas for lower temperatures, they are governed by Ni impurities. The calculated Lorenz number increases monotonously with increasing Ni concentration with a maximum around 100 K. Deviations from the W–F behavior may be associated with Kondo-like resonant peak at the vicinity of E F formed by Ni d-orbitals, which is typical for strongly correlated systems. This study shows how the combination between computational and experimental approaches yields quantitative information on electron relaxation times as well as better insights on electronic transport in TE ZnO compounds.
Acknowledgments
This study is carried out with generous support from the Ministry of Immigrant Absorption––Israel. Partial support from the Israeli Ministry of Energy as well as the Grand Technion Energy Program (GTEP) is acknowledged. The authors are grateful to Prof. Igor Abrikosov of Linköping University, Sweden, and the National University of Science and Technology (MISIS), Russia, for helpful discussions.