1. INTRODUCTION
In pedestrian navigation, integrating GPS with Dead Reckoning (DR) sensors, to provide a self-contained Pedestrian Navigation System (PNS), is a very promising method to provide a seamless outdoor/indoor positioning solution without any requirement for extra infrastructures or fingerprint databases. The PNS always adopts the Pedestrian Dead Reckoning (PDR) algorithm to calculate a relative position and bridge the gaps when GPS outages occur (Chen et al, Reference Chen, Chen, Pei, Chen, Kuusniemi, Liu, Leppäkoski and Takala2009a; Cho and Park, Reference Cho and Park2006; Fang et al, Reference Fang, Antsaklis, Montestruque, McMickell, Lemmon, Sun, Fang, Koutroulis, Haenggi, Xie and Xie2005; Godha et al, Reference Godha, Lachapelle and Cannon2006; Grejner-Brzezinska et al, Reference Grejner-Brzezinska, Toth and Moafipoor2007; Ladetto, Reference Ladetto2000; Levi and Judd, Reference Levi and Judd1999; Retscher, Reference Retscher2007). Taking advantage of human physiological characteristics, the PDR typically utilizes accelerometers to detect the stride occurrence and to estimate the stride length, gyros and digital compasses to obtain the walking heading, and barometers to sense the changes in height. However, since all of these sensors currently applied in PNS measure the physical quantities of the pedestrian's locomotion with respect to the involved environment, such as the Earth's gravity and magnetic field, as well as the atmospheric pressure field, the performance of the sensors is influenced by the relevant environments. For example, in indoor environments, there are too many magnetic disturbances for digital compasses, while the drift error of inexpensive gyros degrades the positioning accuracy after a few minutes.
To be totally different from the signals mentioned above in nature, the electromyography (EMG) signal is a typical kind of biomedical signal that measures electrical potentials generated by the muscle contractions of the human body, not the physical quantity with respect to the environment. Therefore, it is relatively independent and less sensitive to the ambient environment, especially in conditions where these environment-related physical quantities may be distorted, for example, in the weightless condition that limb kinematics are relatively invariant in various modes of locomotion, the patterns of muscle activities required to produce those kinematic patterns can vary considerably (Ivanenko et al. Reference Ivanenko, Poppele and Lacquaniti2004). Since the EMG signal can reveal muscle activities during human locomotion, we believe that when a pedestrian is walking, we could get the speed and azimuth or angular rate from the EMG signal and establish a relative positioning system with sufficient accuracy, based only on one type of such biological signal. Therefore, our motivation is to explore a novel means to realize an accurate and reliable positioning solution, which is based on one type of sensor for two applications (speed and azimuth) and is less sensitive to the environment in the surroundings of the sensors. Furthermore, the potentials of the EMG signal in gesture recognition, fatigue detection and other biomedical applications provide the possibility of utilizing several suitable sensors to establish a comprehensive context-awareness system (for example, getting the position and gesture altogether). Our paper is focused on how the EMG technology can be used for speed estimation and evaluating its performance in PDR through several comparative field tests with the accelerometer-based method.
The paper is organized as follows. A brief background is given first to include the principle of PDR and the explanation of basic characteristics about the EMG technology as well as its applications. Several typical accelerometer-based models that derive the pedestrian's speed are reviewed. Following this, the EMG-based method is described, including the setup of the EMG equipment, pre-processing procedure, stride detection and stride length estimation. Then details of the comparative experiments between the two kinds of methods are presented, followed by the conclusions and future work.
2. BACKGROUND
2.1. Pedestrian Dead Reckoning
When a pedestrian is walking, her/his gait shows a cyclic pattern, especially from the waveform of acceleration. A gait cycle is defined as a fundamental unit to describe the gait during ambulation, which occurs from the time when the heel of one foot strikes the ground to the time at which the same foot contacts the ground again. A stride is synonymous to one gait cycle, and is equal to two steps, which is from the heel strike of one foot to the heel strike of the opposite foot (Chai Reference Chai2004). The patterns of gait are different due to various placements of PNS mounted on the user's body. If the device is mounted on the user's trunk, the pattern is periodic according to every step (Chen et al. Reference Chen, Chen, Pei, Chen, Kuusniemi, Liu, Leppäkoski and Takala2009a; Fang et al. Reference Fang, Antsaklis, Montestruque, McMickell, Lemmon, Sun, Fang, Koutroulis, Haenggi, Xie and Xie2005; Ladetto Reference Ladetto2000); while on the lower limb, it circulates per stride (Godha et al. Reference Godha, Lachapelle and Cannon2006). In this paper, the EMG sensors are mounted on the legs, while the accelerometer is mounted on the waist. Since the rhythms of these two kinds of signals are not the same, for the sake of simplicity and avoiding the confusion between the stride and step, we uniformly take the stride to explain the principle of related methods, except a special indication.
As introduced before, there are three key procedures for PDR: stride detection, stride length estimation and heading determination. Once the procedures are implemented, the position of the PDR solution is propagated via the following equation:
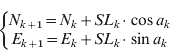
where N k and E k are the North and East coordinates, SL k is the stride length and a k is the heading (azimuth) at epoch k. Suppose the stride frequency is SF k, then the speed at current stride is calculated by:

And the speed at every second can be linearly interpolated with the lengths of involved strides.
2.2. Sensing Muscle Activities with EMG
There are more than 600 muscles in a human body, which are classified by three types: skeletal muscles, smooth muscles and cardiac muscles. The skeletal muscles are made up of muscle fibres attached to the bone by tendons and their contractions are responsible for the movements of the human body. To contract a muscle, the brain sends an electrical signal to motor neurons which conduct messages in the form of nerve impulses from one part of the body to the other, and then the motor neurons transmit electrical impulses known as action potentials to the adjoining muscle fibres causing the muscle to contract (Reaz et al. Reference Reaz, Hussain and Mohd-Yasin2006; Saponas et al. Reference Saponas, Tan, Morris and Balakrishnan2008). The EMG technology is applied to detect the electrical potentials generated during the contractions of muscles. Surface EMG sensors are used for measuring the electrical signal from muscle tissues in a non-intrusive manner, which is more practical than the invasive mode in most applications, such as neuromuscular diagnostics, rehabilitation, prosthetics, ergonomics and modern human-computer interaction (Chen et al. Reference Chen, Zhang, Zhao, Yang, Lantz and Wang2007; Saponas et al. Reference Saponas, Tan, Morris and Balakrishnan2008; Zhang et al. Reference Zhang, Chen, Wang, Yang, Lantz and Wang2009). For more details on EMG, please see Cram et al. Reference Cram, Kasman and Holtz1998.
When walking, relevant muscles of the pedestrian would be contracted and generate electrical potentials periodically, which can be recorded by the EMG sensors. The patterns of the EMG signal are distinct, depending on the tester's gender, age and health condition, the placement of EMG electrodes, and so on. Therefore, utilizing the EMG technology in gait analysis attracts extensive research in the literature (Anders et al. Reference Anders, Wagner, Puta, Grassme, Petrovitch and Scholle2007; Campanini et al. Reference Campanini, Merlo, Degola, Merletti, Vezzosi and Farina2007; Ivanenko et al. Reference Ivanenko, Poppele and Lacquaniti2004). But almost all of them are for clinical purposes. Introducing the EMG signal into pedestrian navigation is a brand-new application. The EMG signal can be used for stride detection, stride length estimation, and thus determination of the speed, based on the fact that when a pedestrian is walking, the EMG signal is periodical and its intensity directly reflects the force exerted by the legs.
3. SPEED ESTIMATION METHODS BASED ON ACCELEROMETERS
In classical Inertial Navigation Systems (INS), the speed is calculated by integration of the acceleration. This methodology is not applicable for PDR due to the instrument errors of low-cost accelerometers, alignment of navigation platform during walking, computation complexity and so forth. Therefore, most of the researchers in this area resort to detecting the stride and estimating the stride length for determination of the speed indirectly.
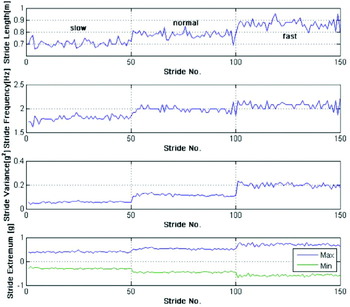
To detect a stride, there are many effective methods, such as zero-crossing (Beauregard and Haas, Reference Beauregard and Haas2006; Käppi et al, Reference Käppi, Syrjärinne and Saarinen2001), peak detection (Fang et al, Reference Fang, Antsaklis, Montestruque, McMickell, Lemmon, Sun, Fang, Koutroulis, Haenggi, Xie and Xie2005; Ladetto, Reference Ladetto2000; Levi and Judd, Reference Levi and Judd1999), autocorrelation (Weimann and Abwerzger, Reference Weimann and Abwerzger2007), stance-phase detection (Cho and Park, Reference Cho and Park2006; Godha et al, Reference Godha, Lachapelle and Cannon2006), FFT (Levi and Judd, Reference Levi and Judd1999), and a method of adopting an impact switch mounted on the user's shoes to measure the steps directly (Grejner-Brzezinska et al, Reference Grejner-Brzezinska, Toth and Moafipoor2007). And the corresponding stride length is typically determined according to different models that can be grouped into four kinds: constant/quasi-constant model, linear model, nonlinear model, and Artificial Intelligence (AI) model. Most of the models are established on the basis of good correlation between the walking speed and some statistical features of acceleration, such as stride frequency, maximum or minimum value per stride, variance per stride, etc. One example is illustrated in Figure 1, which depicts some relevant features when the pedestrian walked at self-selected slow, normal and fast speeds. Obviously, once the stride length is estimated, the speed is easily determined according to (2). Hence in the following, we emphasize the introduction of some typical examples of the four kinds of stride length models.
Statistical features of acceleration under different speeds.

3.1. Constant/Quasi-Constant Model
This kind of model is the simplest one that assumes stride length is a constant (Judd Reference Judd1997) or a quasi-constant (Godha et al. Reference Godha, Lachapelle and Cannon2006, Mezentsev Reference Mezentsev2005). The constant is pre-defined or online obtained from GPS. For example, in Godha et al. Reference Godha, Lachapelle and Cannon2006, the stride length is assumed as a random walking process. When GPS outage is encountered, the stride length is fixed to the last computed one from GPS:

A more flexible model is the look-up table, which stores a few levels of stride length. The estimated stride length is chosen according to the user's locomotion mode, time duration of each stride, etc (Vildjiounaite et al, Reference Vildjiounaite, Malm, Kaartinen and Alahuhta2002).
3.2. Linear Model
To the best of the authors' knowledge, Levi and Judd first proposed the idea of stride detection and stride length estimation in pedestrian navigation (Levi and Judd Reference Levi and Judd1999). They established a model based on a linear relationship between the stride frequency and stride length. Furthermore, in Ladetto Reference Ladetto2000, a two-parameter linear model is proposed:

where SF is stride frequency, SV is stride variance, and w is Gaussian noise, A, B and C are the regression coefficients. Other linear models are similar to (4) and at most different in choosing specific statistical variables (Käppi et al. Reference Käppi, Syrjärinne and Saarinen2001, Leppäkoski et al. Reference Leppäkoski, Käppi, Syrjärinne and Takala2002).
3.3. Nonlinear Model
Since there is not enough evidence to testify to the linear relationship between stride length and some statistical features, some researchers also adopt various nonlinear models. In Fang et al, 2005, the stride length is modelled as:

where A max(or A min) is the maximum (or minimum) acceleration at a stride and K is the coefficient. In this model it is easy to implement real-time estimation algorithms due to only one parameter. In Tome et al, 2008, the stride length is modelled as a simple inverse pendulum, and is calculated from the trigonometric relation:

where the angle a is computed by integrating the angular rate rotation of the shank during one stride, and L is the length of the user's leg. Another empirical nonlinear model is introduced in Kim et al, Reference Kim, Jang, Hwang and Park2004.
3.4. Artificial Intelligence Model
For an AI approach, the main advantage is that there is no need to figure out an exact mapping relationship among these variables. In addition, these AI models are more flexible and adaptive to be applied in various locomotion patterns and different ground conditions, rather than the other three types above. In Cho and Park Reference Cho and Park2006, an Artificial Neural Network (ANN) is utilized for estimating the stride length, with the inputs: stride frequency, variance of the acceleration per stride and terrain slope. And in Beauregard and Haas Reference Beauregard and Haas2006, four features are adopted in the ANN, that is, the maximum, minimum value, variance and integral of the acceleration per stride. The team of Prof. Grejner-Brzezinska developed a 6-input ANN to derive stride length (Grejner-Brzezinska et al, Reference Grejner-Brzezinska, Toth and Moafipoor2007), and then introduced Fuzzy Logic into recognizing the pedestrian's locomotion pattern, for the sake of upgrading the adaptability of the estimation model in the actual navigation (Moafipoor et al, Reference Moafipoor, Grejner-Brzezinska and Toth2008).
4. NOVEL SPEED ESTIMATION METHOD USING EMG SIGNAL
Since this is a new attempt to use the EMG signal for pedestrian navigation, it is necessary to explore which muscle is suitable for speed assessment, and how to realize the specific algorithms of stride detection and stride length estimation on the basis of the characteristics of this kind of signal. The details are presented as follows.
4.1. EMG Equipment and Setup
To record the EMG data, an EMG measurement system is used, which supports up to 16 wired or wireless active surface EMG sensors (or channels) and contains built-in amplifiers of 40–80 dB gain. Each EMG sensor consists of a pair of line-shaped differential electrodes with 1 mm×10 mm contact area and 10 mm inter-electrode distance. The sampling rate was set to 1 kHz.
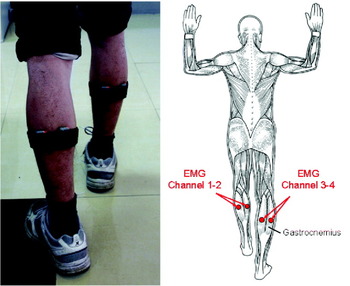
In the first few experiments, several EMG sensors were attached to different muscles in both the left and right legs. From the empirical results and some conclusions in the literature (Campanini et al, Reference Campanini, Merlo, Degola, Merletti, Vezzosi and Farina2007; Ivanenko et al, Reference Ivanenko, Poppele and Lacquaniti2004), when the pedestrian is walking, the pattern of the EMG signal from the surface skin of the calf (Gastrocnemius) is more visible than the ones from other muscles. Therefore, to sense the walking strikes, at least two EMG sensors are required to be attached to the Gastrocnemius in either the left or right leg as shown in Figure 2.
The setup of EMG sensors (The background of the right-hand-side figure is obtained from http://www.answers.com/topic/muscle).

In addition, based on our experiences gained from extensive tests, stride patterns are more visible and stable from the EMG signal of the right leg than that from the left leg, especially under different speeds. The reason is that when a pedestrian is walking, one leg always contributes more than the other one for keeping or adjusting the speed. And most people are right-legged, just like right-handed, including the testers in our experiments. Hence, in this paper, all EMG signals are referred to the ones collected from the sensors attached to the right leg, though we have also collected the EMG signals from the left leg.
4.2. EMG Signal Pre-processing
Since the measurements from EMG sensors have been amplified, the amplitude of the EMG signal cannot stand for the actual value of the muscular electrical signal. But the value of the signal can represent the level of muscle activities directly. Before applying the EMG signal for stride detection and stride length estimation, they should be pre-processed with the following procedures (Zhang et al. Reference Zhang, Chen, Wang, Yang, Lantz and Wang2009):
• calculate the sum of the signals at each epoch from all channels with:
(7)
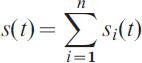
where i is the index of the data channel, n is the number of EMG channels that is two in our case, s i(t) is the measurement from the i-th channel at epoch t, s(t) is the sum of the measurements from all channels at epoch t, and
• calculate the smoothed square signal using a sliding window with the window size of m as:
(8)
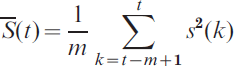
the size m of the sliding window has been chosen as 64 (equivalent to 0·064 second) in our computation by taking the practice and performance into account. The objective of applying a sliding window on the raw data is to reduce the vibration in the raw data.
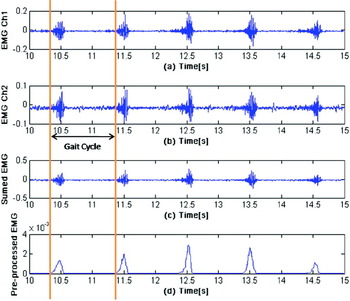
Figure 3 shows a typical example of processing the EMG data, which illustrates that after pre-processing, the cyclic pattern is more obvious and easier to detect than that of the raw data, and the bursting part of each stride indicates the moment that the leg is about to leave the ground during a gait cycle (Ivanenko et al, Reference Ivanenko, Poppele and Lacquaniti2004).
A typical example of pre-processing the EMG signal: (top trace) raw EMG signal from channel 1; (second trace) raw EMG signal from channel 2; (third trace) summed EMG signal; (bottom trace) pre-processed EMG signal.

4.3. Stride Detection
Considering the unique pattern of the EMG signal, a peak detection algorithm is adopted, which includes two main constraints:
• the pre-processed EMG signal should be larger than a threshold, which is designed for avoiding the false detection due to body oscillation, and
• the time interval between two adjacent peaks should be larger than a timing threshold, considering that the stride frequency would not be higher than 2Hz in a walking status.
Based on this algorithm, the detection accuracy can typically reach higher than 99%, which will be demonstrated in section 5.3.
4.4. Stride Length Estimation
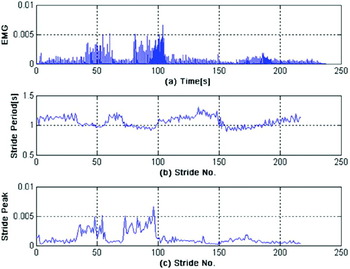
Referring to the experiences and methods from acceleration-based models, several tests were conducted to explore the correlation between the speed and some statistical features of the EMG signal. In these tests, the tester was required to walk along a straight line a few times at self-selected slow, normal and fast walking speeds, as well as at a continuously changing speed. Some statistical features of the EMG signal in these tests indicate a strongly correlative relationship with the speed, especially the stride period and the maximum value of the EMG signal per stride (or stride peak). For example, Figure 4 illustrates one of the tests that the tester walked for about 200 metres at a continuously changing speed. We can learn from it that when the speed is changed, the stride period and stride peak are varied correspondingly. Therefore, considering the cross correlation between these features and the algorithmic complexity, only the stride period and stride peak are adopted in the EMG-based stride length model, and a linear equation is established as follows:

where SL is stride length, ST is stride period, and SP is stride peak. A, B and C are the estimated coefficients which can be determined by a least square method or a Kalman filter during the training phase when the GPS signal is available. And once in a GPS denied environment, stride length is estimated via (9). Note that since the two features have different physical characteristics, the numerical value of stride peak is normalized before being utilized. Finally, the EMG-based speed is determined according to (2).
The EMG signal and statistical features when walking at a continuously changing speed: (top) pre-processed EMG signal; (centre) stride period; (bottom) stride peak.

5. COMPARATIVE EXPERIMENTS FOR THE TWO METHODS
5.1. Experiment Design
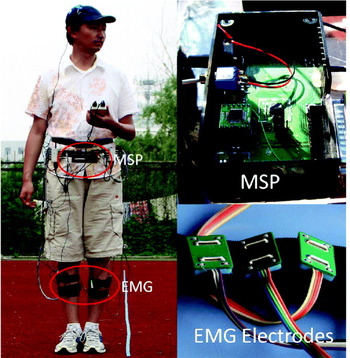
To validate the feasibility and effectiveness of the EMG-based method, and compare its performance in PDR with that of the accelerometer-based method, several field tests were conducted by three testers in the west campus of University of Science and Technology of China (USTC), using the EMG equipment and a self-developed low-cost Multi-Sensor Positioning (MSP) platform by the Finnish Geodetic Institute (FGI). The MSP includes a GPS chip (Fastrax iTrax03), a 3-axis accelerometer (VTI SCA3000), and a 2-axis digital compass (Honeywell HMC6352). For more details about the MSP, please see Chen et al. Reference Chen, Fu, Chen, Chen, Andrei, Kroger and Wang2009b. As shown in Figure 5, the EMG sensors were attached to the Gastrocnemius in both the left and right legs, and the MSP was mounted on the tester's abdominal area, with the GPS antenna fixed on top of a cap for maximum satellite visibility.
Placement of the EMG sensors and the MSP platform.

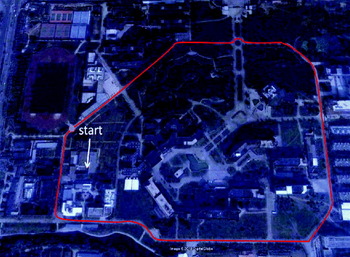
The testers were required to walk one round along track 1 of a sports field, and then turn to track 6 for another round. In addition, the first tester was asked to walk along a prescribed long-range trajectory around the campus as shown in Figure 6. Since the major objective of these tests is to compare the performance of the two kinds of speed estimation methods, we chose an open-sky environment to achieve a good GPS solution and avoid severe magnetic disturbances, and utilized the positioning outputs from the built-in Kalman filter of the GPS chip for training the stride/step length model in the training phase and as a reference in the navigation phase. Note that as mentioned in section 2.1, due to different placements of the two systems on the testers' body, the EMG system detects the stride occurrences, while the accelerometer in MSP senses the step strikes.
The nominal trajectory of the long-range test.

5.2. Comparative Algorithm Architecture and Time Synchronization
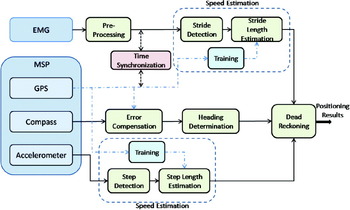
At the current stage of this research, the data of two systems were stored during the tests and post-processed later on. The comparative algorithm is realized as shown in Figure 7. The specific EMG-based algorithms for stride detection and stride length estimation are presented as above, while based on the accelerometer, step detection is implemented by a method combining sliding window, peak detection and zero-crossing (Chen et al, Reference Chen, Fu, Chen, Chen, Andrei, Kroger and Wang2009b), and the model in (5) is used for step length estimation. In the training phase, the speed from GPS is interpolated in accordance with the results of stride/step detection, and then is utilized to train the estimation models. Besides, the heading from GPS is used for calibrating the digital compass according to an adaptive approach (Chen et al, Reference Chen, Chen, Chen, Kuusniemi, Wang and Fu2010). Afterwards, relevant positioning results are calculated in the navigation phase, which would be demonstrated in the latter.
Architecture of the comparative algorithm.

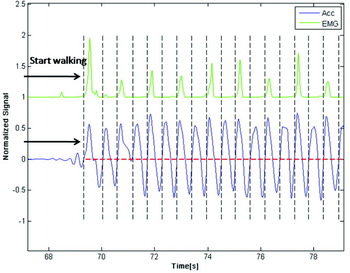
Time synchronization is important among these heterogeneous sensors. The microprocessor in the MSP has a master clock to keep the timing and control the data acquisition from each sensor at a regular rate (accelerometer 50 Hz, digital compass 10 Hz). Whenever the GPS fix is obtained, the master clock is synchronized to the GPS time. The EMG equipment has its own timing system. Its sampling rate can be up to 64 kHz, and was set to 1 kHz in our tests. To synchronize these two systems, an autonomous method was developed for detecting the starting point of the walking process in each system. The time offset of these two systems were then determined and applied to synchronize the measurements of these sensors. Due to the low walking speed, a synchronization error of 0·1 second can be ignored because it will cause a positioning error of a few centimetres (Mezentsev, Reference Mezentsev2005). Therefore, based on the precise GPS timing and the high sampling rate of the EMG signal, the synchronization accuracy is sufficient for pedestrian navigation. Figure 8 shows the time synchronization of the long-range test, and it also illustrates that one stride is equivalent to two steps.
Time synchronization between the EMG and MSP systems.

5.3. Experiment Results
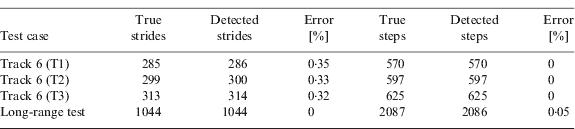
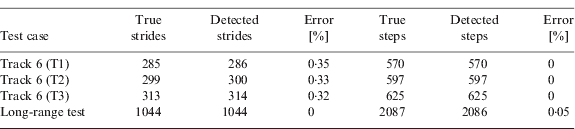
Table 1 lists the detection results of the second round along track 6 by the three testers, as well as that of the long-range test, based on the two types of signal separately. As shown, the accuracy of each method is higher than 99%. When stopping walking, some testers' muscles would still contract involuntarily for a while, which might cause a false detection based on the EMG-based method. Note that all the testers started walking with the right leg, and if they stopped at the right leg too, there would be one step difference between the actual steps and the double of the strides. Since the length of one step is not longer than 1 m, the error can be neglected when estimating the distance travelled.
Results of the stride/step detection.
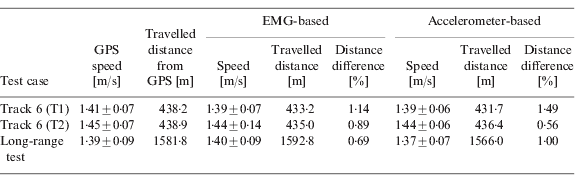
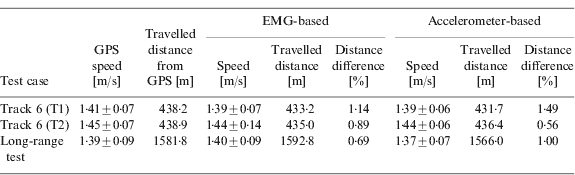
As mentioned before, the EMG-based method detects the stride occurrences, while the accelerometer-based one senses the step strikes. It is not convenient to compare the results of stride/step length estimation directly. Therefore, the two methods are compared in terms of the speed and total distance travelled. The results of these tests are listed in Table 2, except the test by tester 3, in which the poor geometric condition of satellite observability causes deterioration in GPS positioning accuracy so that the data from GPS are unsuitable for training the models and as a reference. The statistics in Table 2 demonstrate that the performance of the proposed EMG-based speed estimation method is comparable to that of the accelerometer-based method, and the difference of the travelled distance estimated by the EMG method is not beyond 1·5% in these tests, which is quite good in pedestrian navigation.
Estimation results of the speed and distance travelled.
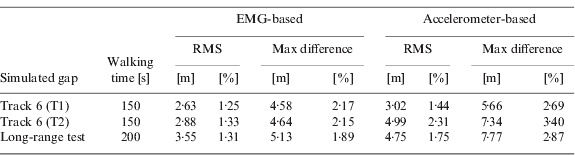
Furthermore, to evaluate the performance of the two methods in PDR, some simulated GPS gaps are intentionally introduced into the trajectory of track 6 as well as that of the long-range test. According to equation (1), the dead reckoning positions of the gaps are calculated with the stride/step length derived from both the EMG-based and accelerometer-based methods, and the compensated heading from the 2-axis digital compass.
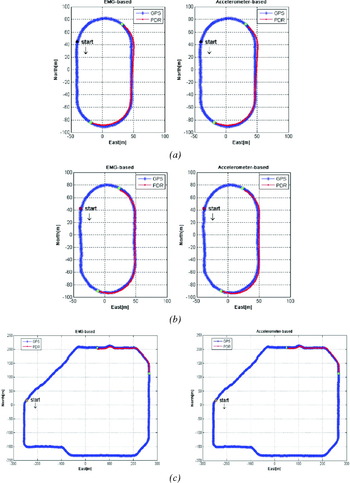
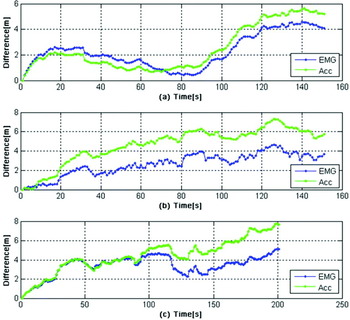
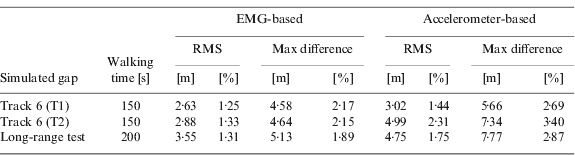
In Figure 9, the green points in the GPS trajectories indicate the start and stop points of the simulated gaps, and the PDR solutions of these two kinds are depicted in red separately. Figure 10 illustrates the corresponding horizontal position difference of these gaps between the GPS and the two kinds of PDR solutions. Table 3 lists the corresponding statistical results in detail. These results demonstrate that the PDR solution based on any kind of the two methods can achieve an acceptable performance under GPS-denied environments in a few minutes, comparable to that of GPS under open-sky environments.
Position results of the simulated GPS gaps: (a) along track 6 by tester 1; (b) along track 6 by tester 2; (c) along the long-range trajectory by tester 1.

Horizontal difference of the simulated GPS gaps between the GPS and PDR solutions: (top) along track 6 by tester 1; (centre) along track 6 by tester 2; (bottom) along the long-range trajectory by tester 1.

Positioning results of simulated GPS gaps.
6. CONCLUSIONS AND FUTURE WORK
Based on the fact that during walking, the contractions of muscles are cyclic and the intensity of the EMG signal directly represents the force exerted by the legs, a novel EMG-based stride detection and stride length estimation method is introduced in the paper. More details are focused on the setup of the EMG equipment, procedure of pre-processing the EMG signal, stride detection, and how to establish a simple but effective linear model for estimating the stride length. Several field tests were conducted to evaluate this proposed method, as well as to compare its performance in PDR with that of the accelerometer-based method. From these results, it can be concluded that the EMG-based speed estimation method in PDR is feasible and effective, and could be an alternative to the accelerometer-based method. Furthermore, the performance of the PDR solution that integrates the EMG-based stride length and the compensated heading from a 2-axis digital compass under short-term GPS outages can be comparable to that of the GPS under open-sky environments.
However, it cannot be asserted that the EMG-based method would be always superior to the one based on accelerometers, because in our tests, the walking dynamics of the testers are a little bit simple and the ground is even and level. For a thorough comparison, it should be conducted in scenarios with various walking dynamics and different ground conditions. Nevertheless, the potential of the EMG technology for speed estimation has been demonstrated, and as is known to all, actually the major problem in PDR is determination of heading, especially in indoor environments. Therefore, the next step is to utilize the EMG signal to aid the digital compass in discriminating the actual turning with magnetic disturbances, even in deriving the azimuth information solely from this kind of biomedical signal when the pedestrian is adjusting his/her walking direction, for achieving a seamless outdoor/indoor positioning solution with satisfactory accuracy.
ACKNOWLEDGEMENTS
The first author is sponsored by the China Scholarship Council and Finnish Geodetic Institute for his studies at the Finnish Geodetic Institute. The authors would like to thank Dr. Heidi Kuusniemi, Peiyuan Lei, Daixiang Wei, and Juan Cheng for their help in the paper.