




Introduction
Zinc (Zn) is an essential trace element that plays a critical role in numerous physiological and biochemical processes, including animal growth, development, reproduction, antioxidant defense, and immune function (Romeo et al. Reference Romeo, Vacchina and Legros2014). Zinc deficiency impairs immune competence, increasing susceptibility to pathogenic bacteria and enteric infections. It can also activate guanylate and adenylate cyclases, stimulate chloride secretion, cause diarrhea, and reduce nutrient absorption (Wapnir Reference Wapnir2000). Given the often-limited zinc content in conventional diets, zinc deficiency is common in livestock, necessitating dietary supplementation to support growth and production (Livingstone Reference Livingstone2015).
For decades, inorganic zinc sources such as zinc sulfate (ZnS) have been widely used in animal feeds due to their low cost. However, accumulating evidence indicates that organic zinc forms are more efficiently absorbed by intestinal epithelial cells than inorganic zinc (Antony Jesu Prabhu et al. Reference Antony Jesu Prabhu, Stewart and Silva2018; Glover and Hogstrand Reference Glover and Hogstrand2002). Organic zinc also minimizes interactions with phytate, thereby protecting essential micronutrients (e.g., vitamins and fatty acids) from oxidation and enhancing their bioavailability (Yang et al. Reference Yang, Wang and Lin2022). Consequently, stable amino acid-chelated zinc sources have been developed as alternatives to traditional inorganic forms (Huang et al. Reference Huang, Lu and Li2009; Yu et al. Reference Yu, Lu and Li2017).
In recent years, comparative studies of different amino acid-chelated zinc forms have demonstrated superior bioavailability, growth performance, immune regulation, and antioxidant capacity in broilers, pigs, and aquatic species relative to inorganic zinc (Baxter et al. Reference Baxter, Greene and Kidd2020; Hu et al. Reference Hu, Wang and Wu2022). Moderate chelation strength appears particularly advantageous for intestinal absorption and transporter expression (Hu et al. Reference Hu, Wang and Wu2022). Research has found that zinc hydroxymethionine (ZnM) has shown superior antioxidant and growth effects in broilers and pigs due to moderate chelation (Baxter et al. Reference Baxter, Greene and Kidd2020; Hu et al. Reference Hu, Wang and Wu2022); zinc valine (ZnV) offers variable bioavailability, often intermediate, with limited studies in swine (Zhang et al. Reference Zhang, Zhang and Peng2024); zinc glycine (ZnG) excels in absorption and immune modulation, widely applied in high-phytate poultry diets (Ma et al. Reference Ma, Niu and Feng2011). Nevertheless, while general differences in absorption between organic and inorganic zinc have been reported (Swain et al. Reference Swain, Rao and Rajendran2016), the relative transport efficiencies among specific organic chelates with varying chelation strengths remain inconsistent across studies, and their precise cellular mechanisms, including transporter interactions and metabolic regulation, are not fully elucidated (Schlegel et al. Reference Schlegel, Sauvant and Jondreville2013).
High dietary calcium is known to antagonize zinc absorption, primarily through competition for shared transport pathways or formation of insoluble complexes; this effect is generally more pronounced for inorganic than organic zinc (Bafundo et al. Reference Bafundo, Baker and Fitzgerald1984; Monica et al. Reference Monica, Lautaro and Fernando2018; Wood and Zheng Reference Wood and Zheng1997). Some evidence suggests that amino acid-chelated zinc may be less susceptible to high-calcium inhibition due to utilization of peptide or amino acid transporters (Sauer et al. Reference Sauer, Pfaender and Hagmeyer2017). However, although high-calcium models have shown reduced zinc bioavailability (Lönnerdal Reference Lönnerdal2000), the differential impacts on intracellular accumulation, time-dependent transcellular transport, and transcriptome-level molecular regulation across specific organic zinc sources have not been systematically compared in porcine intestinal models.
To address these gaps, the present study aimed to answer the following scientific question: How do specific amino acid-chelated organic zinc sources (ZnM, ZnV, and ZnG) with varying chelation strengths differ in intracellular accumulation, transcellular transport efficiency, and molecular regulatory mechanisms compared to inorganic ZnS in the porcine intestinal epithelial IPEC-J2 cell model, particularly under high-calcium conditions? The present study, therefore, used the porcine intestinal epithelial cell line IPEC-J2 as an in vitro model to compare intracellular accumulation and transcellular transport of ZnS with three organic sources: ZnM, ZnV, and ZnG with particular focus on high-calcium conditions. Transcriptome analysis was also performed to elucidate underlying genetic regulatory mechanisms and provide a theoretical basis for rational application of organic zinc in animal production.
Materials and methods
Cell and reagents
IPEC-J2 cells were purchased from the American Type Culture Collection (Manassas, USA) and maintained by the Institute of Subtropical Agriculture, Chinese Academy of Sciences. ZnS was purchased from Sigma (MO, USA), ZnM and ZnV were obtained from Xingjia Bio-Engineering (Changsha, China), and ZnG was purchased from Tanke Industry Group (Guangzhou, China).
IPEC-J2 cell culture
Frozen IPEC-J2 cells were rapidly thawed in a 37°C water bath, centrifuged at 1000 × g for 5 minutes, and resuspended in DMEM (Gibco, USA) supplemented with 10% fetal bovine serum (Gibco, USA), 1% glutamine (Meilun Biological, China), and 1% penicillin-streptomycin (Gibco, USA). Cells were seeded in 6-well plates (Corning, USA) with 2 mL complete medium per well and cultured at 37°C in 5% CO₂.
Apoptosis assay
Post-treatment apoptosis was assessed by flow cytometry using an Annexin V-FITC/PI Apoptosis Detection Kit (Beyotime Biotechnology, China) according to the manufacturer’s protocol.
Establishment of IPEC-J2 Transwell cell model
IPEC-J2 cells were seeded in a 6-well Transwell cell culture plate (Corning, USA). The cells were cultured for 12–14 days, and the resistance values were measured. Once the resistance values reached the desired state, the morphology of cell tight junctions was observed under a microscope (n = 3). The resistance was measured at 3, 6, 9, 12, and 24 hours (n = 3) after the initial measurement.
Intracellular and extracellular zinc quantification
For cells, 1 mL of 25 μM zinpyr-1 (Abcam, UK) dissolved in HBSS (HyClone, USA) (pH 7.4) was added to each well, and the cells were incubated at 37℃, 5% CO2 for 20 minutes. Subsequently, the dye solution was removed, and each well was washed three times with 1 mL of PBS (Gibco, USA). Finally, 1 mL of HBSS was added to each well. Fluorescence images were captured using a fluorescence microscope (DMI3000B, Leica, IT) with an excitation wavelength of 495 nm. Fluorescence images were imported into ImageJ for analysis to calculate the average fluorescence intensity per unit area. At least 10 measurements should be conducted for each statistical analysis. For medium analysis, 5 μL of the sample at different time points and different treatments was mixed with 98 μL of Zinpyr-1 (25 μM) in a black 96-well plate (Bioland, China). The mixture was incubated for 10–20 minutes, and the fluorescence value was read at an excitation wavelength of 495 nm and an emission wavelength of 525 nm using a microplate reader (Infinite M200 PRO, TECAN, CH). A standard curve was plotted for each sample analysis.
The transport amount and transport rate were calculated to analyze the transport absorption characteristics of zinc from different sources in the IPEC-J2 cell model:
 \begin{align*}\text{Transport rate (\%)} &=
\left(\text{Transport amount/Initial added amount}\right)
\times 100\end{align*}
The transport amount was calculated from basolateral (BL) zinc concentration multiplied by the volume of the BL compartment, and the initial added zinc amount was the total zinc content added to the apical side of the Transwell insert at the beginning of the experiment.
Cellular transcriptome sequencing
RNA Extraction: total RNA was extracted from organoids using TRIzol reagent (Invitrogen). RNA concentration was measured with a NanoDrop 2000 spectrophotometer (Thermo Fisher Scientific, USA), and integrity was assessed using an Agilent 2100 Bioanalyzer and LabChip GX (PerkinElmer, USA). Samples met library construction standards: total RNA ≥2 μg, concentration ≥40 ng/μL, volume ≥10 μL, OD260/280 ratio 1.7–2.5, OD260/230 ratio 0.5–2.5, and a normal 260 nm absorption peak. RNA integrity number was required to be ≥7 (for non-plant samples); for GX values of 6.0–6.4, assessment included 28S/18S ratio ≥1 and no or minimal baseline rise. Viscous, discolored, turbid, or insoluble samples were disqualified. For library construction, mRNA was purified and fragmented: mRNA Capture Beads were equilibrated for 30 minutes on a 4D rotator and mixed with total RNA. Samples were denatured at 65°C, incubated at room temperature for 5 minutes to bind mRNA, and placed on a magnetic rack to remove supernatant. Beads were washed, eluted with Tris Buffer at 80°C, rebound with Beads Binding Buffer, rewashed, and fragmented using Frag/Prime Buffer in a programmable thermal cycler, followed by low-temperature quenching. First-strand cDNA was synthesized by adding reverse transcription reagents to fragmented mRNA and running the program on a thermal cycler. Second-strand synthesis used RNase H/DNA Polymerase I for double-stranded cDNA extension, followed by ligation in a constant-temperature metal bath. Ligation products were purified. Purified products underwent PCR amplification with high-fidelity polymerase, followed by bead-mediated purification to yield high-purity libraries. Library quality was assessed using Qsep-400. Qualified libraries were sequenced on an Illumina NovaSeq 6000 platform.
Statistical analysis
Data were organized in Microsoft Excel and analyzed using SPSS 17.0. Visualization was performed with GraphPad Prism 8.0 and ImageJ. Differences between two groups were evaluated using an independent samples t-test, and differences among multiple groups were assessed using one-way ANOVA followed by post hoc tests. Results are presented as mean ± SD.
Results
Intracellular accumulation of different zinc sources
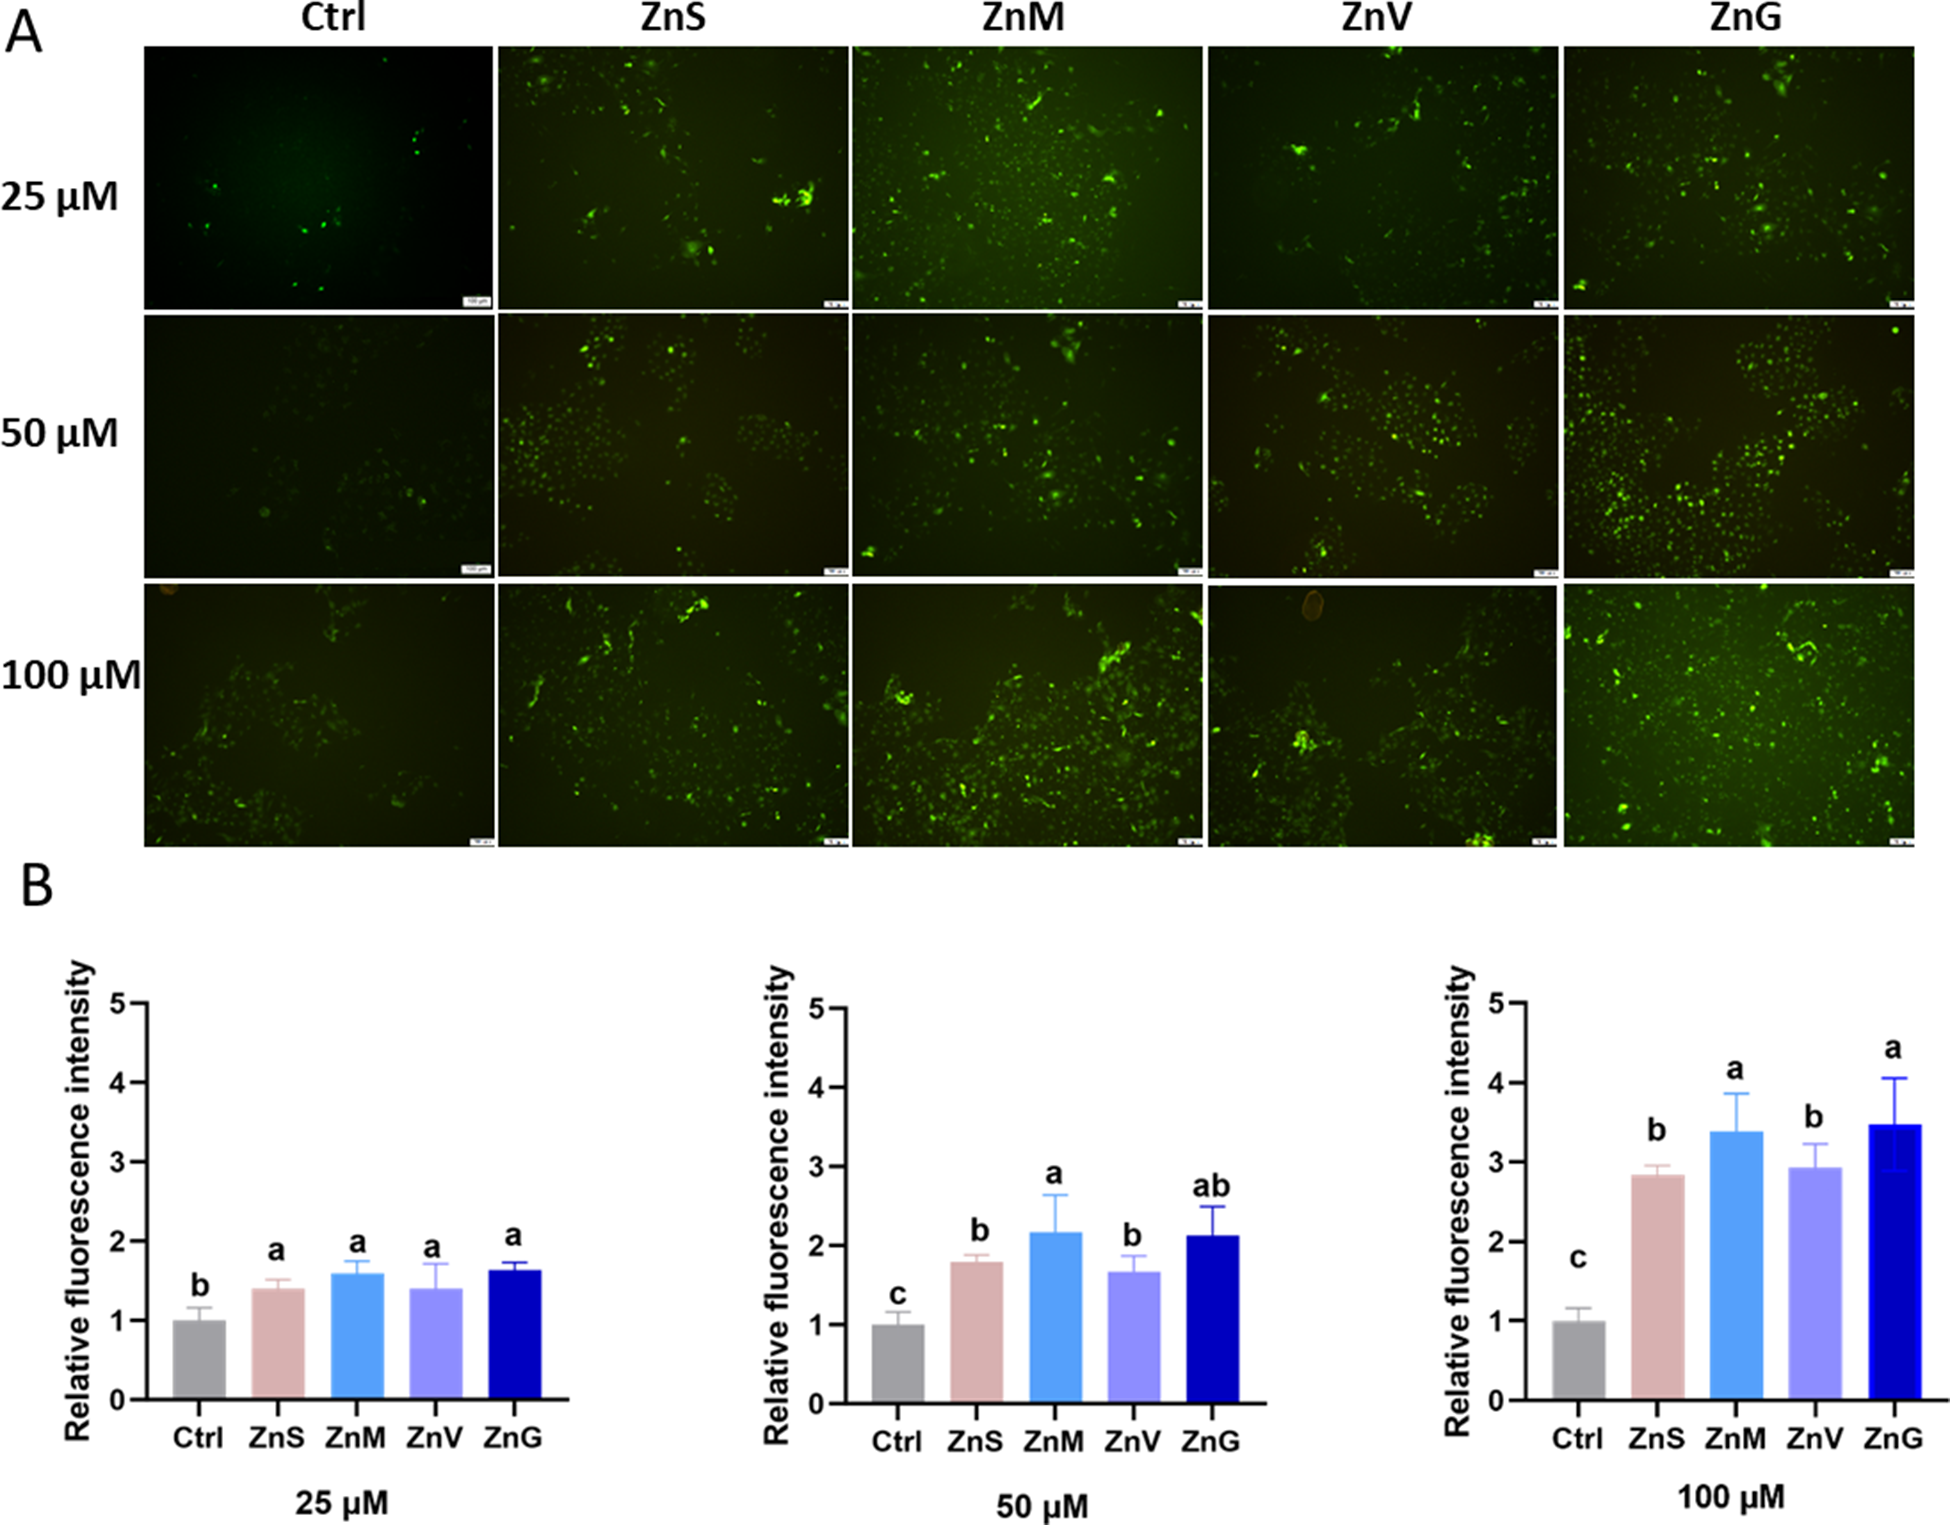
To investigate the optimal safe treatment concentration of ZnS in the IPEC-J2 cell model, we added 0, 25, 50, and 100 μM ZnS to IPEC-J2 cells. After 24 hours of treatment, we analyzed the rate of cell apoptosis in the IPEC-J2 cells using the Annexin V-FITC/PI apoptosis detection kit. The results depicted in Fig. S1A demonstrate that, when compared to the control group (0 μM zinc), there was no significant difference in the rate of cell apoptosis in the IPEC-J2 cells treated with 25, 50, and 100 μM ZnS (P > 0.05). We also analyzed the effects of zinc hydroxyamino, zinc valinate, and zinc glycinate at 100 Μm on cell viability. The results, as shown in Fig. S1B, indicate that there was no significant difference in the rate of cell apoptosis in the IPEC-J2 cells (P > 0.05). IPEC-J2 cells exposed to 25, 50, or 100 μM ZnS, ZnM, ZnV, or ZnG for 4 hours showed concentration-dependent increases in intracellular zinc (Fig. 1). At 25 μM, all zinc treatments significantly elevated fluorescence intensity relative to control (P < 0.05), with no differences among sources. At 50 μM, ZnM exhibited significantly higher accumulation than ZnS (P < 0.05). At 100 μM, both ZnM and ZnG displayed markedly greater intracellular zinc than ZnV and ZnS (P < 0.05).
Accumulation of different forms of zinc in cells. (A) 25, 50, and 100 μM ZnS, ZnM, ZnV, and ZnG were added to IPEC-J2 cells. After 4 hours, the cells were stained with Zinpyr-1, and the fluorescence intensity was observed and photographed under a fluorescent microscope. (B) The fluorescence images were imported into ImageJ for processing, and the average fluorescence intensity was calculated. Results are given as mean ± SD (n = 3). Means with different lowercase letters (a, b) indicate significant differences (P < 0.05) within different forms of zinc.

Figure 1 Long description
The image A shows fluorescence microscopy images of IPEC-J2 cells treated with different forms of zinc (ZnS, ZnM, ZnV, ZnG) at concentrations of 25, 50 and 100 micromolar. The control (Ctrl) is also shown. Each row represents a different concentration, with increasing fluorescence intensity observed as the concentration increases. The image B shows three bar graphs depicting the relative fluorescence intensity for each zinc form at 25, 50 and 100 micromolar. The x-axis labels are Ctrl, ZnS, ZnM, ZnV and ZnG and the y-axis is labeled 'Relative Fluorescence Intensity'. Different letters above the bars indicate significant differences in intensity levels among the zinc forms at each concentration.
Transcellular transport efficiency of different zinc sources
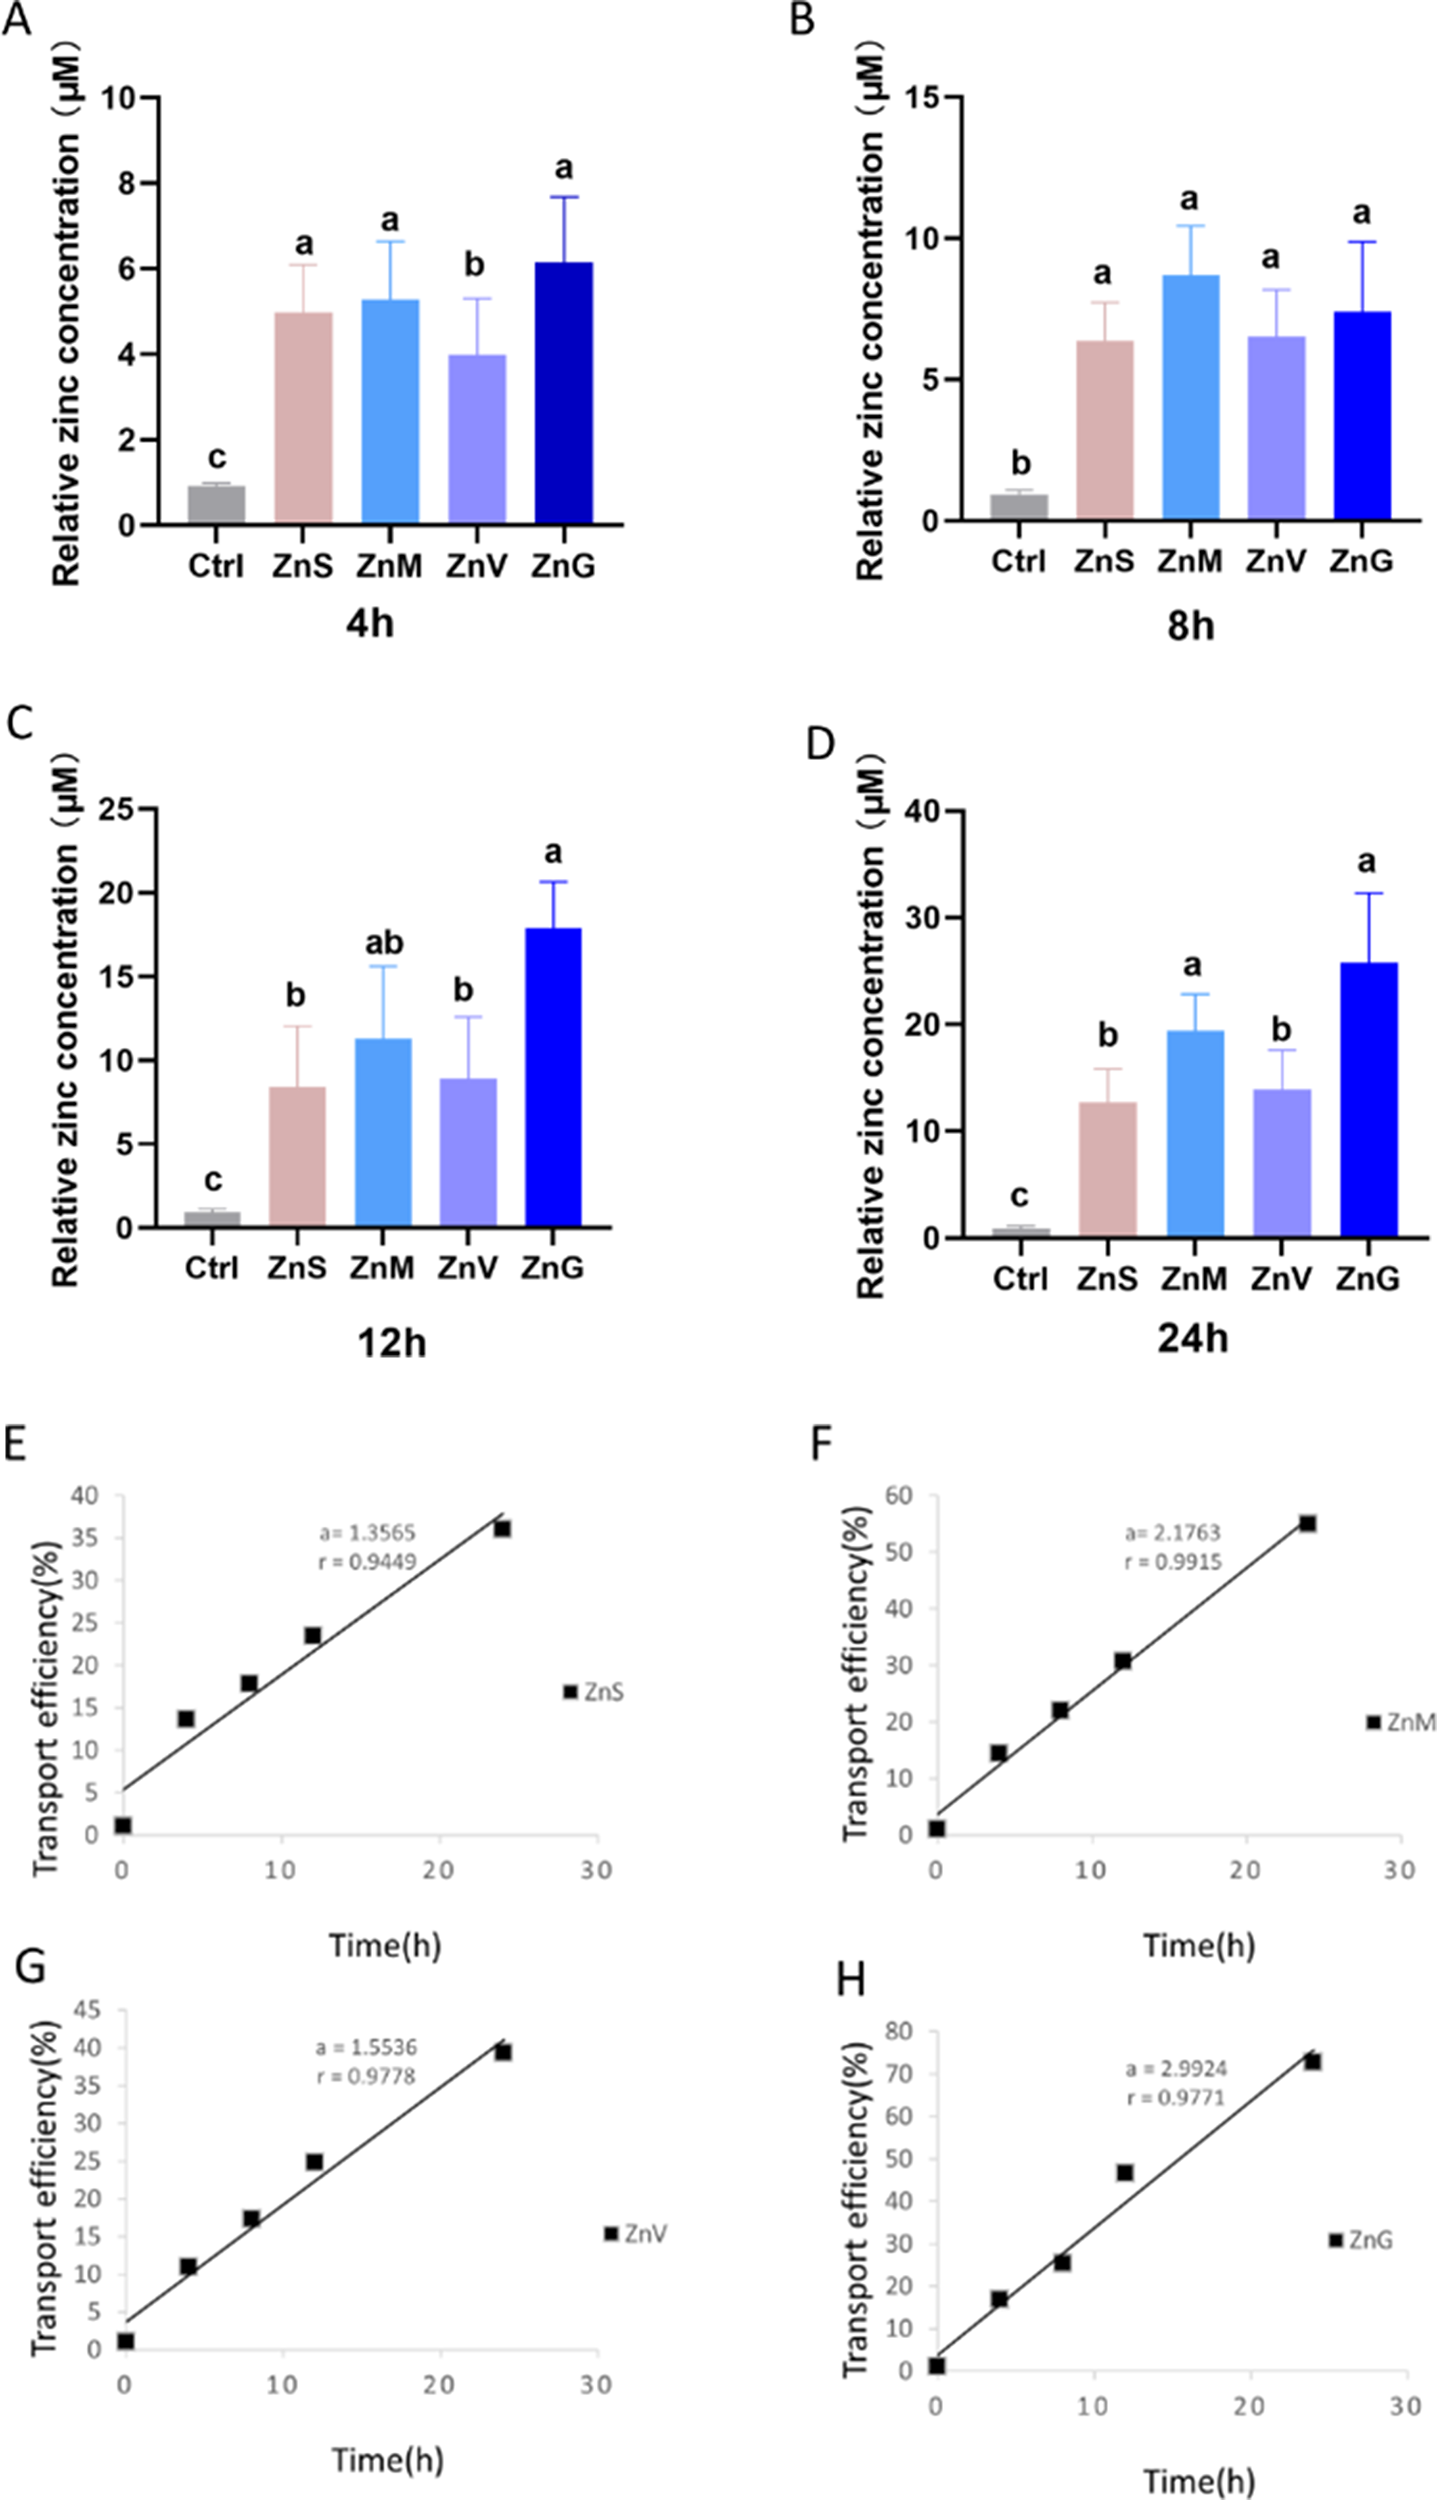
The Transwell system was used to evaluate the efficiency of zinc transport from the epithelial layer to the basal layer of the cells. To further validate the IPEC-J2 Transwell model and assess the effect of zinc treatment on barrier integrity, trans Epithellal Electric Resistance (TEER) measurements were conducted during the formation of the monolayer and 24 hours before treatment with different zinc sources. On days 12–14, the cells reached a TEER value greater than 500Ω · cm2, confirming the tightness of the monolayer, which was consistent with previous reports (Vergauwen Reference Vergauwen, Verhoeckx, Cotter and López-Expósito2015). Before treatment with the control group or 100 μM zinc sources (ZnS, ZnM, ZnV, ZnG), TEER remained stable within 24 hours, with values ranging from 520 to 540Ω · cm2 (Fig. S3). These results indicate that the model maintained the integrity of the epithelial cells under experimental conditions, supporting its reliability for transport studies. The zinc transport results show that the zinc concentration in the basal medium was significantly lower in the group treated with ZnV compared to the other organic zinc groups and the ZnS, at 4 hours (P < 0.05) (Fig. 2A). At 8 hours, there were no significant differences in zinc concentration among the groups treated with organic and inorganic zinc (P > 0.05) (Fig. 2B). However, at 12 hours, the zinc concentration in the group treated with ZnG was significantly higher than in the groups treated with ZnS and ZnV (P < 0.05) (Fig. 2C). At 24 hours, the zinc concentration in the groups treated with ZnG and ZnM was significantly higher than in the groups treated with ZnV and ZnS (P < 0.05) (Fig. 2D).
Transwell system for measuring the transport of different forms of zinc. IPEC-J2 cells were seeded in cell culture chambers of the Transwell system and allowed to grow for 7–14 days until they formed a tight monolayer. Then 100 μM ZnS, ZnM, ZnV, and ZnG were added to IPEC-J2 cells, and the zinc content in the basal layer (BL) medium was measured at 4 hours (A), 8 hours (B), 12 hours (C), and 24 hours (D). (E–H) The transport efficiency of different zinc sources was analyzed based on the zinc concentration in the BL layer. Results are given as mean ± SD (n = 3). Means with different lowercase letters (a, b) indicate significant differences (P < 0.05) within different forms of zinc.

Figure 2 Long description
The image contains eight graphs. Graphs A to D are bar graphs showing relative zinc concentration in micromoles per liter at different times: 4 hours (A), 8 hours (B), 12 hours (C) and 24 hours (D). Each graph compares five groups: Ctrl, ZnS, ZnM, ZnV and ZnG, with different letters indicating significant differences. Graphs E to H are line graphs showing transport efficiency in percentage over time in hours for different zinc sources: ZnS (E), ZnM (F), ZnV (G) and ZnG (H). Each line graph includes a linear equation and R squared value, indicating the relationship between time and transport efficiency.
Further, the transportation rate curves of different zinc sources showed that the transportation rate slopes of ZnS, ZnM, ZnV, and ZnG were 1.3565, 2.1763, 1.5535, and 2.9924, respectively (Fig. 2E–H). Thus, ZnG had the highest transport efficiency, followed by ZnM and ZnV, while ZnS had the lowest transport efficiency (Fig. 2E–F).
Effect of high calcium on intracellular zinc accumulation
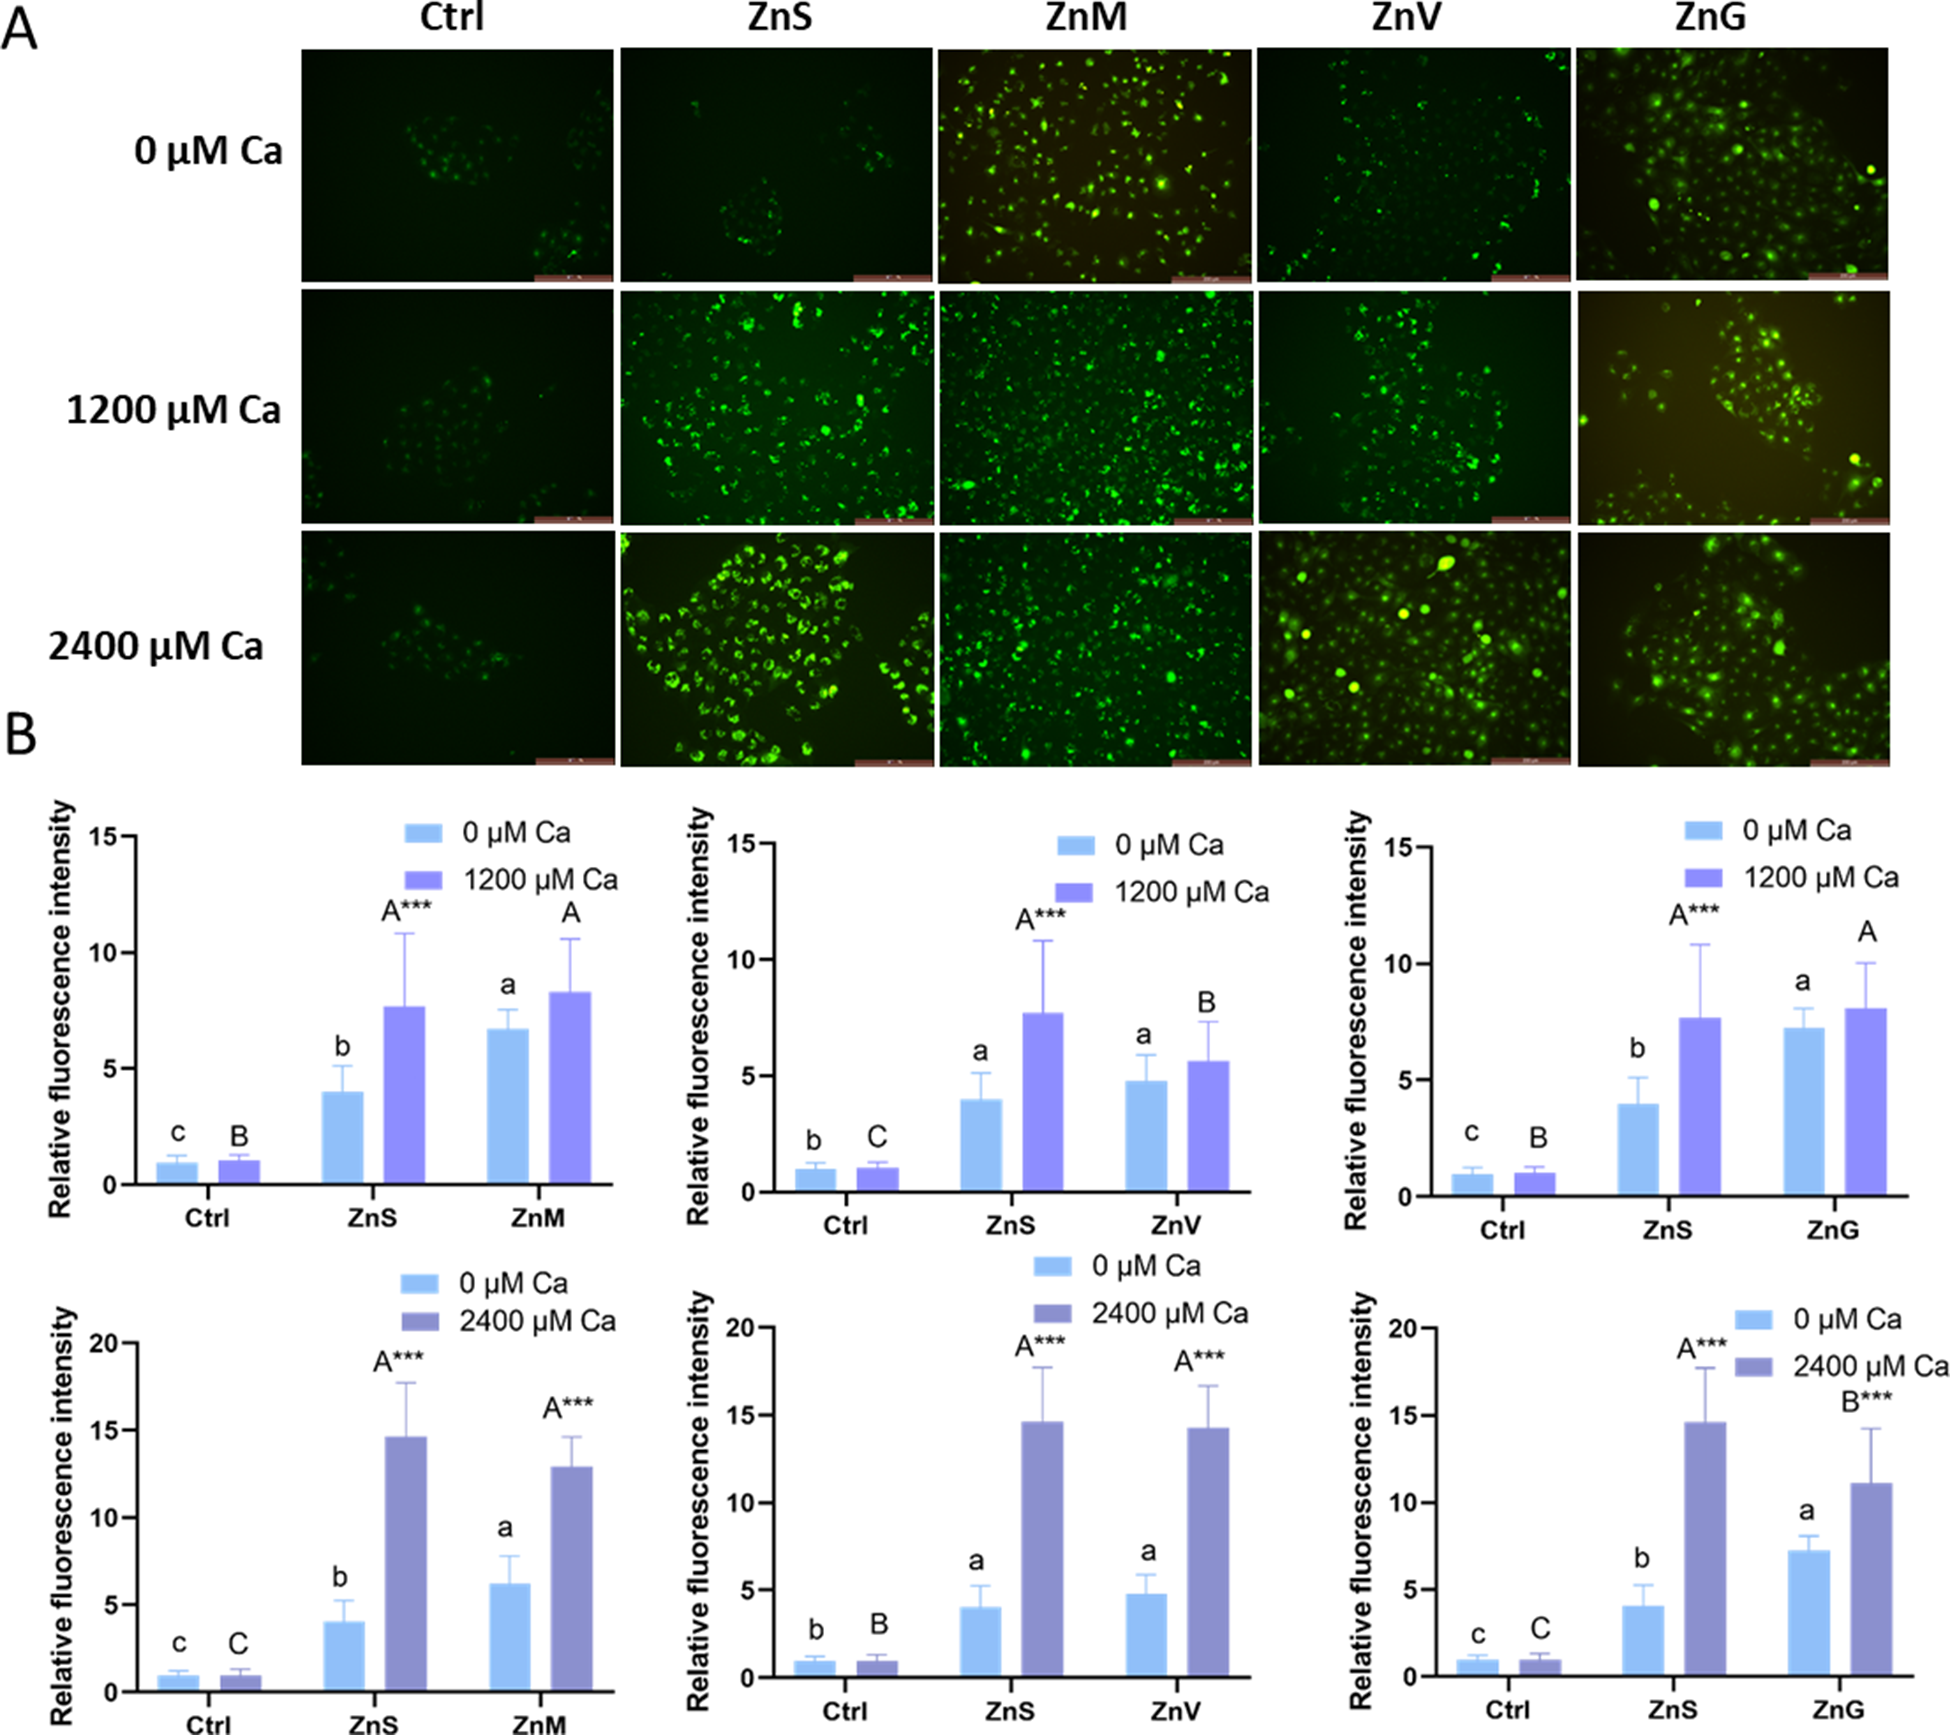
The results depicted in Fig. S2 demonstrate that the introduction of 0 μM, 1200 μM, 2400 μM calcium, and 80 μM ZnS to the cells showed no significant difference in the rate of cell apoptosis after 24 hours (P > 0.05). To examine whether the high levels of calcium affect the transport of organic zinc, IPEC-J2 cells were exposed to varying concentrations of calcium (Ca) (0 μM, 1200 μM, and 2400 μM) as calcium chloride. Addition of 1200 μM calcium had no significant effect on intracellular accumulation of organic zinc sources but increased accumulation of ZnS (P < 0.05). At 2400 μM calcium, all sources showed significantly elevated intracellular zinc relative to 0 μM calcium (P < 0.05), indicating that high Ca2⁺ enhances apical uptake across forms (Fig. 3).
Accumulation of different forms of zinc in cells under high-calcium levels. (A) IPEC-J2 cells were treated with 0, 1200, and 2400 μM calcium (Ca) as calcium chloride, respectively, and meanwhile addition of 80 μM different forms of zinc. After 4 hours, the cells were stained with Zinpyr-1, and the fluorescence intensity was observed and photographed under a fluorescent microscope. (B) The fluorescence images were imported into ImageJ for processing, and the average fluorescence intensity was calculated. Means with different capital letters (A, B) indicate significant differences (P < 0.05) between different forms of zinc at 1200/2400 μM calcium concentration. Means with different lowercase letters (a, b) show significant differences (P < 0.05) between different forms of zinc at 0 μM calcium concentration. An asterisk (***) denotes significant differences (P < 0.001) between different calcium concentrations under the same zinc source.

Figure 3 Long description
The image consists of two parts. The first part (A) shows fluorescence images of cells treated with different forms of zinc (ZnS, ZnM, ZnV, ZnG) and varying calcium concentrations (0, 1200, 2400 micromolar). The images display fluorescence intensity changes across these conditions. The second part (B) includes six bar graphs depicting relative fluorescence intensity for each zinc form under the same calcium conditions. Each graph compares the intensity at 0, 1200 and 2400 micromolar calcium, with significant differences indicated by different letters (A, B, C) and asterisks for statistical significance. The graphs illustrate how calcium levels affect zinc accumulation in cells.
Effect of high calcium on transcellular transport
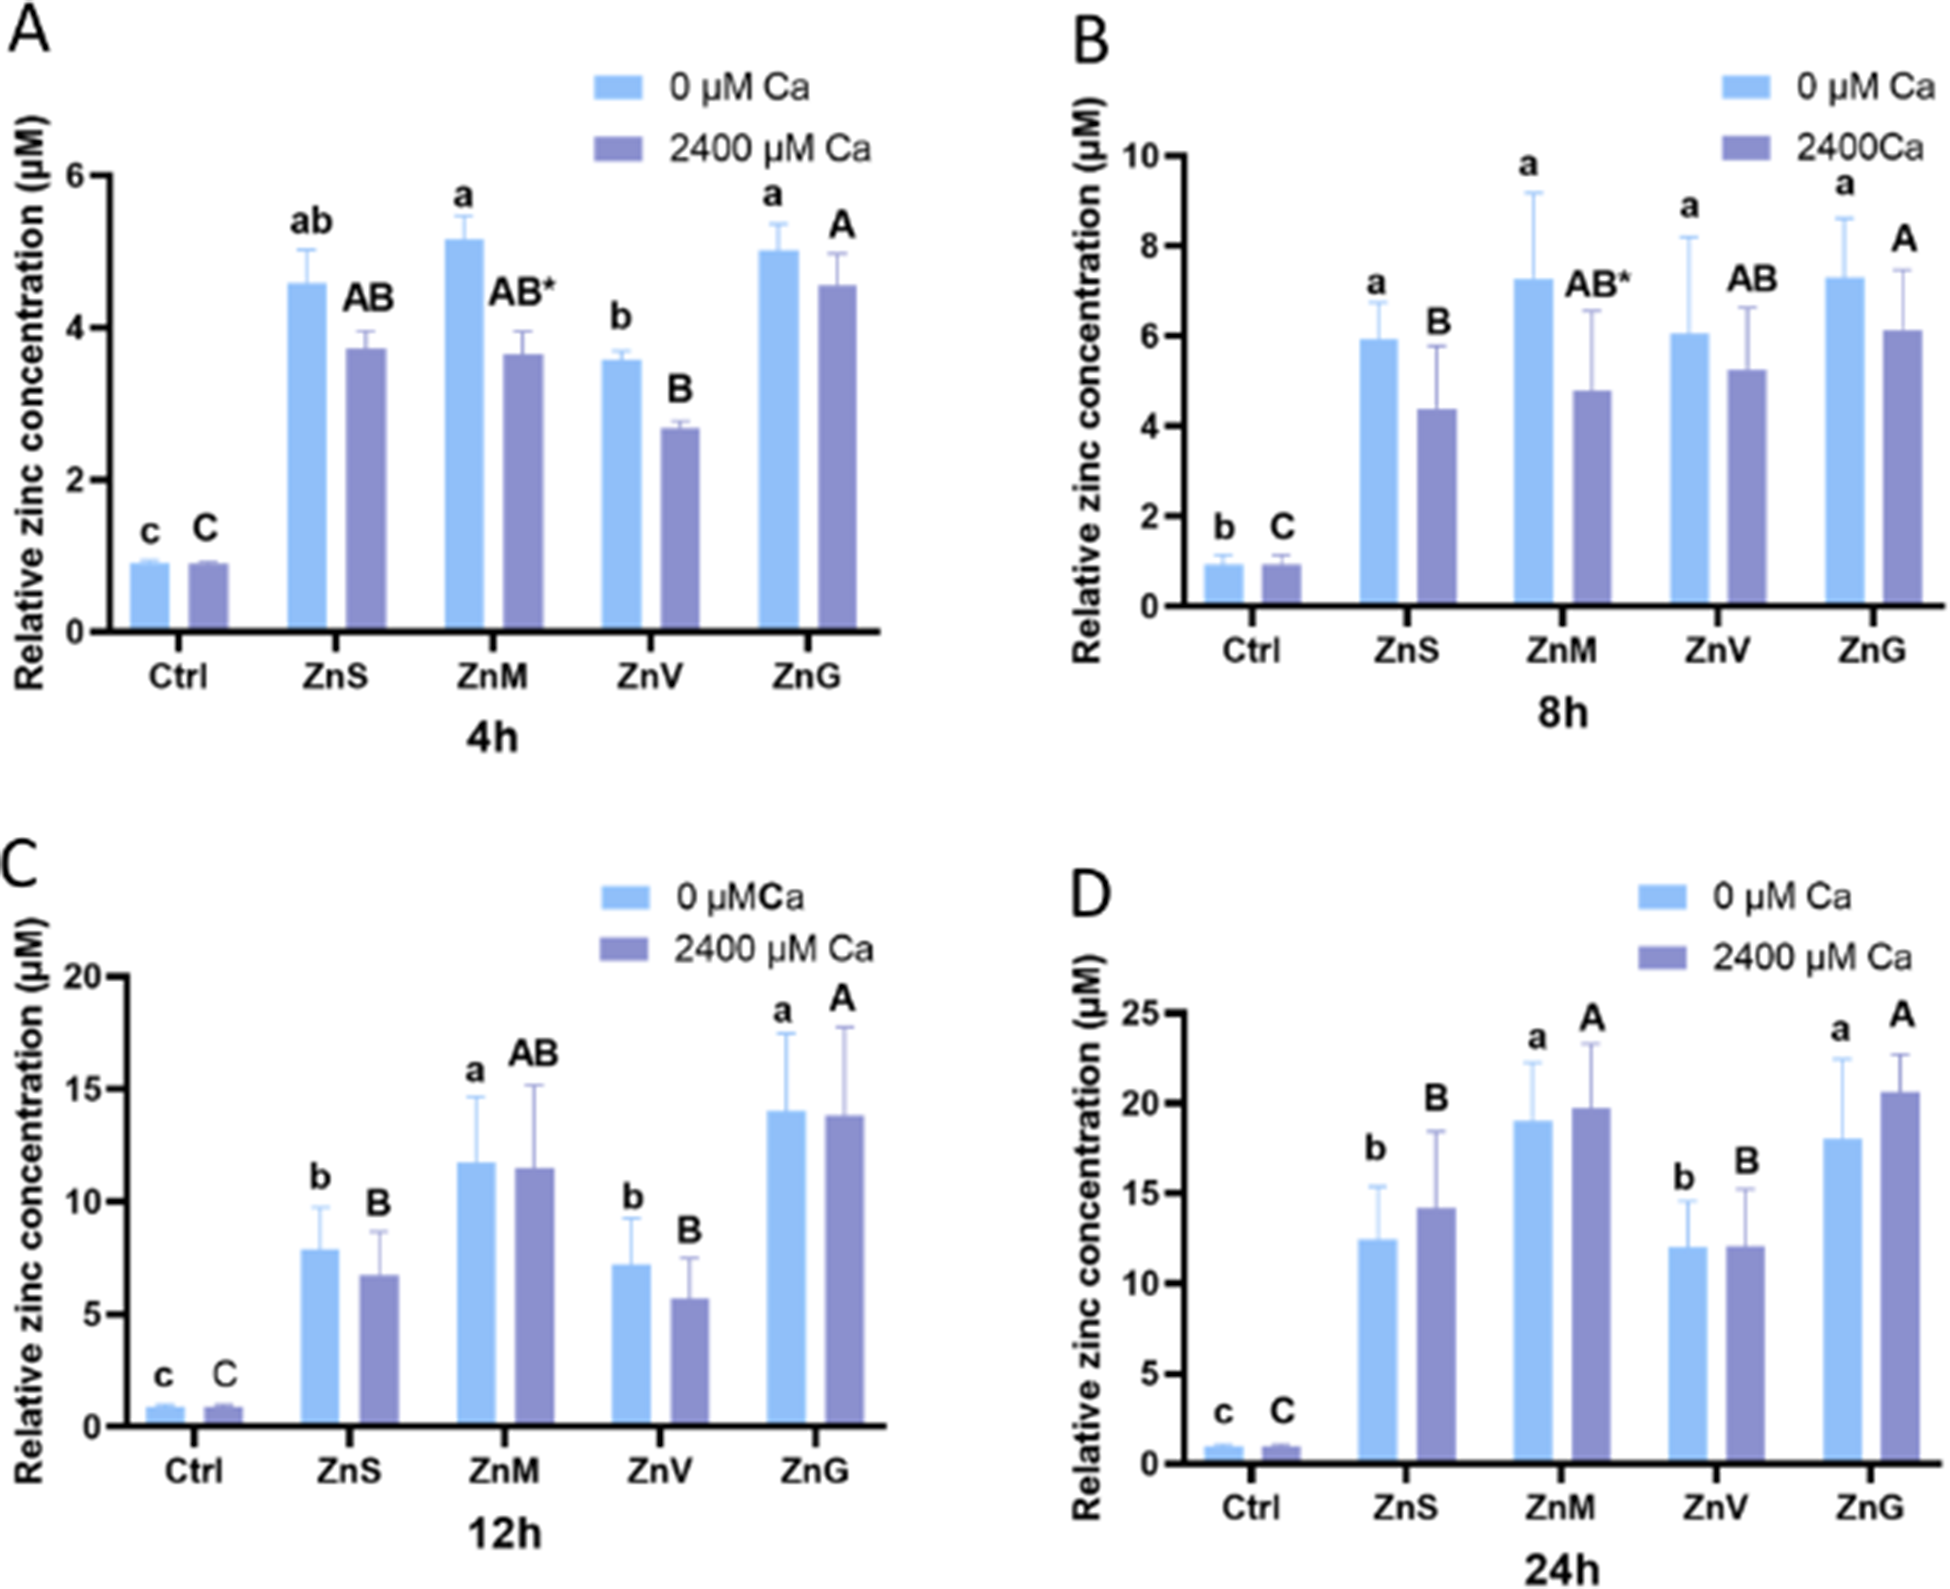
To investigate the influence of high calcium on the transcellular transport of different zinc sources, a Transwell model was employed, with zinc concentrations in the BL compartment measured at 4, 8, 12, and 24 hours following simultaneous addition of 2400 μM calcium and 80 μM of each zinc source (Fig. 4). TEER measurements were conducted during the monolayer formation period and within 24 hours prior to the treatment with different zinc sources, specifically calcium. The results also show that TEER remained stable within 24 hours (Fig. S4). In the absence of supplemental calcium (0 μM Ca), zinc concentrations in the BL medium increased progressively over time across all treatments. Organic zinc sources (ZnM, ZnV, and ZnG) generally exhibited higher transport levels compared to inorganic ZnS, with ZnG and ZnM showing significantly greater BL zinc accumulation at multiple time points (P < 0.05).
Transcellular transport of different zinc sources under high-calcium conditions. IPEC-J2 cells were cultured in Transwell inserts until a tight monolayer formed. Cells were then treated simultaneously with 2400 μM calcium (as CaCl₂) and 80 μM of each zinc source (ZnS, ZnM, ZnV, or ZnG). Zinc concentrations in the basolateral (BL) medium were determined at 4 hours (A), 8 hours (B), 12 hours (C), and 24 hours (D). Means with different capital letters (A, B) indicate significant differences (P < 0.05) between different forms of zinc at 2400 μM calcium concentration. Means with different lowercase letters (a, b) show significant differences (P < 0.05) between different forms of zinc at 0 μM calcium concentration. An asterisk (*) denotes significant differences (P < 0.05) between different calcium concentrations under the same zinc source.

Figure 4 Long description
The image consists of four bar graphs labeled A, B, C and D, each representing relative zinc concentration in micromolar units at different time intervals: 4 hours (A), 8 hours (B), 12 hours (C) and 24 hours (D). Each graph compares zinc concentrations under two calcium conditions: 0 micromolar calcium and 2400 micromolar calcium. The x-axis lists treatments: Ctrl, ZnS, ZnM, ZnV and ZnG. The y-axis is labeled 'Relative Zinc concentration (micromolar)'. Significant differences between zinc sources and calcium concentrations are indicated by different letters above the bars. In graph A, ZnG shows the highest concentration at 2400 micromolar calcium. Graph B shows similar trends, with ZnG and ZnM having higher concentrations. Graph C indicates ZnG and ZnM as having higher concentrations at 2400 micromolar calcium. Graph D shows ZnG with the highest concentration at 2400 micromolar calcium. An asterisk denotes significant differences between calcium concentrations for the same zinc source.
The addition of high calcium markedly altered transport dynamics, particularly in the early phases. At 4 and 8 hours, high calcium significantly suppressed BL zinc efflux, resulting in lower BL zinc concentrations compared to the 0 μM Ca condition for most sources (P < 0.05). This inhibitory effect was most pronounced for ZnM, which displayed significant reductions at both time points. In contrast, ZnS, ZnV, and ZnG showed downward trends but without statistical significance. In the later phases (12 and 24 hours), the impact of high calcium shifted: BL zinc concentrations in the high-calcium groups either approached or exceeded those in the no-calcium groups for several sources, with some treatments exhibiting significant elevation (P < 0.05). Differences in transport efficiency among zinc sources within the high-calcium condition were attenuated.
Overall, high calcium primarily impairs early-stage BL efflux, leading to intracellular zinc retention, but organic zinc sources are less susceptible to this interference, preserving superior transcellular transport capacity.
Transcriptome analysis
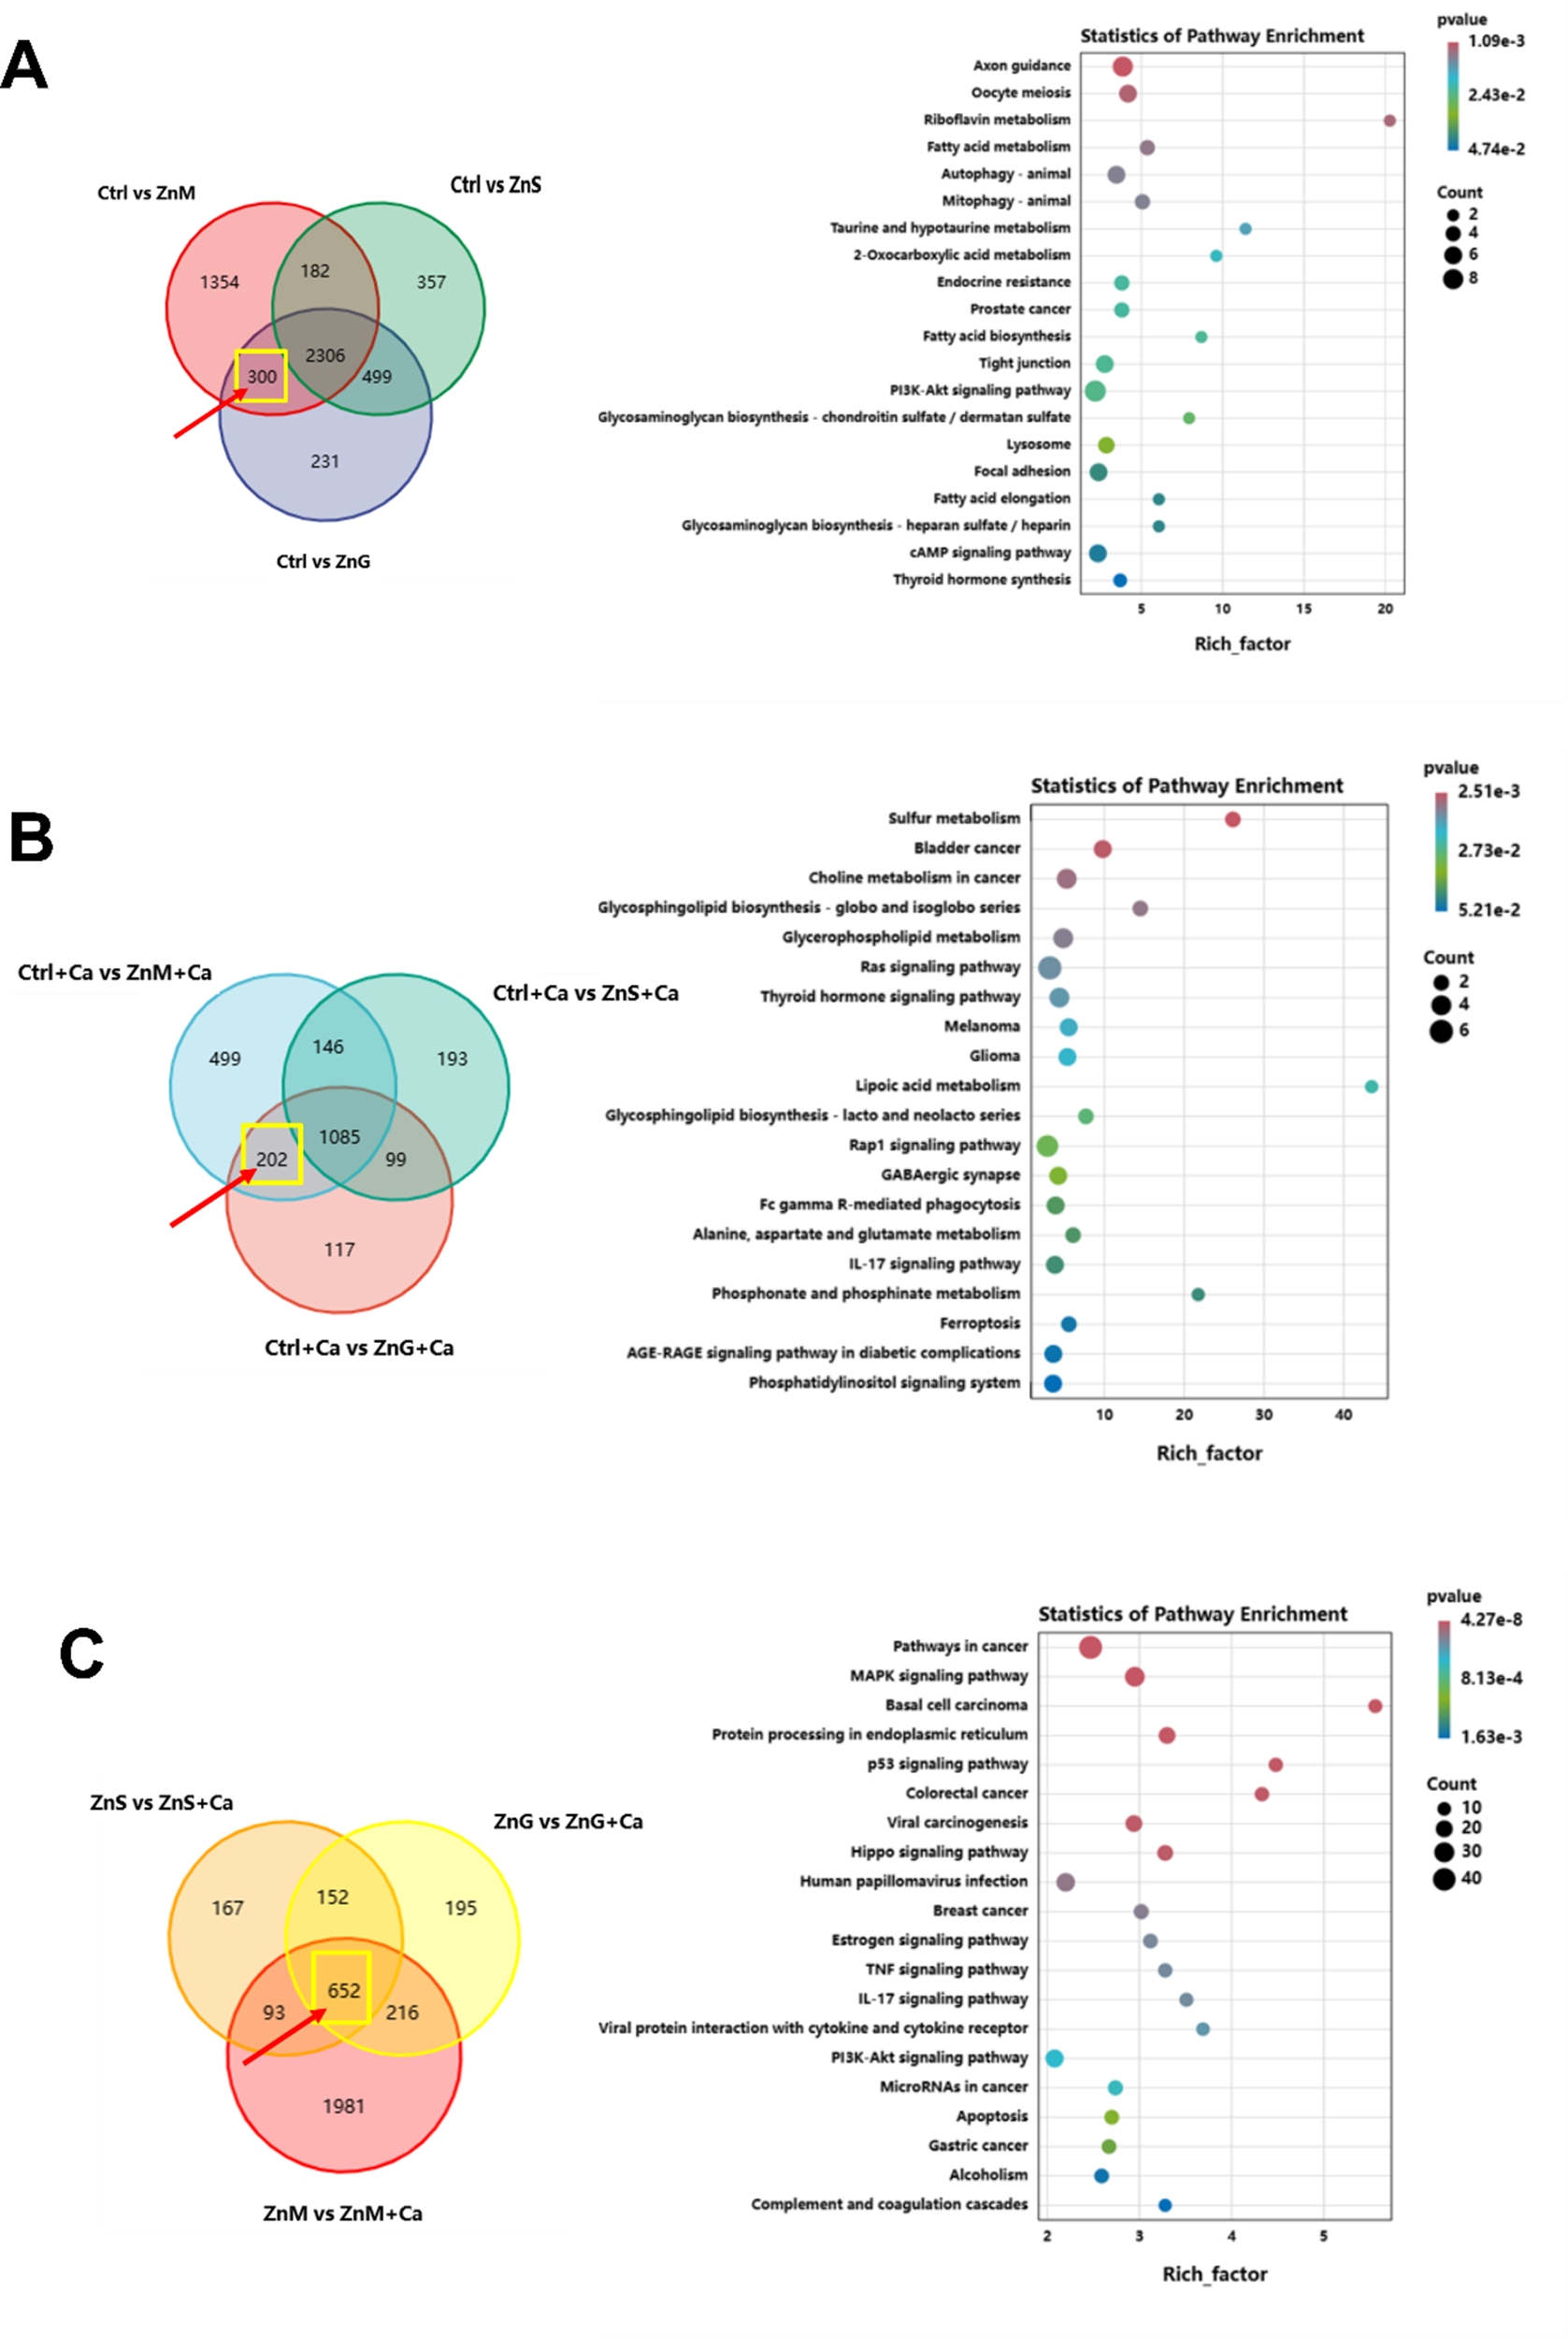
To further elucidate the molecular mechanisms underlying the differential transport of inorganic and organic zinc, we conducted RNA sequencing analysis on IPEC-J2 cells. Compared with the control group, treatments with ZnS, ZnM, and ZnG induced distinct transcriptional profiles, reflecting their different absorption pathways. As shown in the Venn diagram in Fig. 5A, a total of 300 differentially expressed genes (DEGs) were shared only between the ZnM and ZnG groups and were unaffected in the ZnS group, indicating that the molecular responses triggered by organic zinc chelates differ from those of inorganic zinc.
Transcriptomic analysis identifying specific molecular responses to organic zinc sources in IPEC-J2 cells. (A) Venn diagram illustrating the distribution of differentially expressed genes (DEGs) among ZnS, ZnM, and ZnG groups compared to the control. The yellow frame indicates the 300 DEGs exclusively shared by ZnM and ZnG groups, which are not affected by ZnS treatment. KEGG pathway enrichment analysis was performed on the organic zinc-specific DEGs (shared by ZnM and ZnG only). (B) Venn diagram showing DEGs under high-calcium (2400 μM) conditions. The intersection highlights genes specifically regulated by organic zinc sources (ZnM and ZnG) but not by ZnS in a high-calcium environment. KEGG enrichment analysis was performed on the organic zinc-specific DEGs under high-calcium levels, highlighting the involvement of sulfur metabolism and thyroid hormone signaling pathways. (C) Venn diagram displaying DEGs induced by calcium supplementation within each zinc source group used to identify calcium-responsive genes across different zinc forms. KEGG analysis of signaling pathways activated by high calcium, including MAPK signaling and protein processing in the endoplasmic reticulum. Note: DEGs were filtered using the criteria of fold change (FC) > 2 and P < 0.05.

Figure 5 Long description
The image A shows a Venn diagram comparing differentially expressed genes (DEGs) among Ctrl vs ZnM, Ctrl vs ZnS and Ctrl vs ZnG groups. The intersection highlights 300 DEGs shared by ZnM and ZnG. Adjacent is a pathway enrichment chart with pathways like sulfur metabolism and thyroid hormone signaling. The image B shows a Venn diagram under high calcium conditions comparing DEGs among Ctrl-Ca vs ZnM-Ca, Ctrl-Ca vs ZnS-Ca and Ctrl-Ca vs ZnG-Ca. The intersection highlights genes regulated by organic zinc sources. The adjacent chart shows pathways like sulfur metabolism and thyroid hormone signaling. The image C shows a Venn diagram comparing DEGs among ZnS vs ZnG-Ca, ZnG vs ZnG-Ca and ZnM vs ZnM-Ca. The intersection highlights calcium-responsive genes. The adjacent chart shows pathways like MAPK signaling and protein processing in the endoplasmic reticulum.
To identify the biological processes specific to organic zinc absorption, we performed KEGG pathway enrichment analysis on these 300 organic zinc-specific DEGs (Fig. 5A). The results showed that these genes were significantly enriched in pathways such as riboflavin metabolism, fatty acid metabolism, and tight junctions. The specific regulation of the tight-junction pathway by organic zinc suggests its potential role in maintaining the integrity of the intestinal epithelium during mineral transport. Additionally, the activation of riboflavin and fatty acid metabolism indicates that organic zinc chelates may interact with a broader metabolic network, thereby bypassing the traditional ionic zinc transport pathway.
In view of the observed “retention effect” (i.e., high calcium promotes intracellular accumulation but inhibits BL efflux), we analyzed the transcriptome under high-calcium (2400 μM) conditions. Under calcium stress conditions (Fig. 5B), the organic zinc sources (ZnM and ZnG) specifically regulated a set of genes involved in sulfur metabolism and thyroid hormone signaling (Fig. 5B), while these genes did not change significantly in the ZnS + Ca group. This suggests that organic zinc may utilize other metabolic pathways to mitigate the inhibitory effect of high calcium on zinc homeostasis. To understand the cellular adaptation mechanism to calcium-induced zinc retention, we further analyzed the DEGs triggered by calcium supplementation in all zinc treatments (Fig. 5C). KEGG analysis (Fig. 5C) showed that high-calcium levels significantly activated the MAPK signaling pathway and protein processing in the endoplasmic reticulum (ER). The activation of these stress-related pathways provides a molecular explanation for the observed “zinc retention effect”: excessive intracellular ions may induce ER stress, thereby reducing the efficiency of zinc efflux transporters and decreasing the net transcellular zinc flux, even when intracellular zinc levels are high.
Discussion
Zinc deficiency poses significant challenges in livestock production, leading to impaired growth, reduced feed efficiency, immune suppression, increased susceptibility to infections, and economic losses estimated at up to 20% in affected herds (Livingstone Reference Livingstone2015; Poulsen Reference Poulsen1995). In pigs, for instance, suboptimal zinc levels can cause parakeratosis, diarrhea, and decreased weight gain, exacerbating production costs and animal welfare issues (Case and Carlson Reference Case and Carlson2002). These deficiencies are common due to low zinc bioavailability in plant-based feeds high in phytates, underscoring the importance of effective supplementation strategies to enhance zinc absorption and mitigate antagonistic dietary factors like high calcium.
Amino acid-chelated zinc closely mimics the natural form of trace elements in biological systems, which is considered conducive to intestinal absorption (Sauer et al. Reference Sauer, Pfaender and Hagmeyer2017). Consistent with previous studies on broiler intestinal absorption (Yu et al. Reference Yu, Lu and Li2017), our results using the IPEC-J2 cell model demonstrated that organic zinc forms (ZnM and ZnG) had higher intracellular accumulation and transcellular transport efficiency than inorganic zinc (ZnS). Specifically, at zinc concentrations above 50 μM, ZnM and ZnG showed significantly higher intracellular fluorescence intensity than ZnS, and the transport rate slope of ZnG (2.9924) was nearly twice that of ZnS (1.3565) in the Transwell model. This difference may be attributed to the structural characteristics of organic zinc: amino acid chelation reduces the formation of insoluble complexes between zinc ions and anti-nutritional factors (e.g., phytic acid), while the chelate itself can be transported through amino acid transporters in the intestinal epithelium, bypassing the competitive absorption limitations of inorganic zinc ions (Glover and Hogstrand Reference Glover and Hogstrand2002). Our findings in the IPEC-J2 model align with in vivo studies in broilers, showing that ZnM and ZnG achieved higher intracellular accumulation and transcellular transport than ZnS at concentrations ≥50 μM (Yu et al. Reference Yu, Lu and Li2017). Specifically, ZnG’s transport rate slope (2.9924) was nearly double that of ZnS (1.3565), likely due to its moderate chelation strength, which optimizes stability and transporter affinity without excessive binding that could hinder release (Hu et al. Reference Hu, Wang and Wu2022; Star et al. Reference Star, van der Klis and Rapp2012). The divergence of ZnV from ZnM and ZnG in transport performance likely reflects differences in chelation chemistry and ligand-transporter interactions. Valine is a branched-chain amino acid with a relatively bulky, nonpolar side chain. Its zinc chelate is expected to form a more sterically hindered and chemically stable complex than glycine or MHA chelates, which may reduce the rate of zinc dissociation at intestinal pH. Consequently, less free Zn2⁺ or intact chelate may be available for uptake via ZIP (ZRT/IRT-like protein) transporters or amino acid transporters at the apical membrane, resulting in lower net uptake rates. This interpretation is consistent with the “moderate chelation strength” hypothesis advanced by Hu et al. (Reference Hu, Wang and Wu2022), who demonstrated that chelates of intermediate stability – neither too labile nor too stable – exhibit optimal intestinal absorption. ZnV, with its higher-stability chelation, may fall on the “over-chelated” side of this optimum, behaving functionally more like inorganic ZnS – which enters cells as free Zn2⁺ via ionic transporters – than like the more bioavailable organic forms (Glover and Hogstrand Reference Glover and Hogstrand2002). These differences highlight how chelate structure influences bioavailability, with glycine and hydroxymethionine chelates offering advantages in overcoming anti-nutritional interactions, such as with phytate, thereby supporting better growth performance in zinc-supplemented livestock (Yang et al. Reference Yang, Wang and Lin2022).
Transcriptomic analysis further revealed the molecular basis for the differential transport of organic and inorganic zinc. A total of 300 unique DEGs were identified in ZnM and ZnG groups compared to ZnS, which were significantly enriched in riboflavin metabolism, fatty acid metabolism, and tight junction pathways. The activation of tight junction pathways suggests that organic zinc may enhance intestinal epithelial barrier function while promoting zinc transport, which is consistent with the role of zinc in maintaining epithelial integrity (Rossi et al. Reference Rossi, Rutz and Anciuti2007). Additionally, the regulation of fatty acid and riboflavin metabolism indicates that organic zinc interacts with broader cellular metabolic networks, possibly providing energy or cofactors for efficient zinc transport, thereby differing from the traditional ionic transport pathway of inorganic zinc. Transcriptome analysis provided mechanistic insights, identifying 300 DEGs unique to ZnM and ZnG, enriched in riboflavin metabolism, fatty acid metabolism, taurine metabolism, and tight junction pathways. Riboflavin metabolism upregulation may enhance flavoprotein-dependent redox processes, aiding zinc homeostasis and antioxidant defense crucial for epithelial cells under stress (Powers Reference Powers2003). Fatty acid metabolism activation could provide energy substrates for active transport, while taurine metabolism supports osmotic regulation and anti-inflammatory effects, potentially synergizing with zinc’s role in immune modulation (Schuller-Levis and Park Reference Schuller-Levis and Park2003). Notably, tight junction pathway enrichment (e.g., involving claudins and occludin) suggests organic zinc bolsters barrier integrity, reducing pathogen entry and improving nutrient absorption in livestock intestines (Rossi et al. Reference Rossi, Rutz and Anciuti2007). This contrasts with inorganic zinc’s limited metabolic integration, emphasizing organic forms’ broader regulatory impact.
High dietary calcium (2400 μM) concentration was chosen to physiologically simulate the local high-calcium microenvironment within the intestinal lumen of pigs fed a typical commercial high-calcium diet (where free calcium during digestion can range from 1 to 5 mM). Furthermore, this specific concentration aligns with established in vitro models investigating calcium-mineral antagonism (Monica et al. Reference Monica, Lautaro and Fernando2018). The interaction between calcium and zinc absorption has long been controversial. Early in vitro studies suggested that high calcium inhibits zinc absorption (Wood and Zheng Reference Wood and Zheng1997), while human clinical trials showed no significant effect (Spencer et al. Reference Spencer, Kramer and Norris1984). Our results resolved this discrepancy by distinguishing between “zinc uptake” and “zinc efflux”: high calcium (2400 μM) significantly increased intracellular zinc accumulation in IPEC-J2 cells (regardless of zinc form), indicating enhanced zinc uptake; however, in the Transwell model, calcium inhibited the BL efflux of ZnM at 4 and 8 hours, leading to intracellular zinc retention. This “promoting uptake but inhibiting efflux” pattern is consistent with the findings of Monica et al. (Reference Monica, Lautaro and Fernando2018) in Caco-2 cells, confirming that the interaction between calcium and zinc primarily occurs during the absorption and efflux stages rather than a simple competitive inhibition. The calcium–zinc interaction remains contentious, with early in vitro evidence of inhibition (Wood and Zheng Reference Wood and Zheng1997) contrasting some in vivo findings (Spencer et al. Reference Spencer, Kramer and Norris1984). Our study reconciles this by delineating uptake versus efflux: high calcium (2400 μM) boosted apical uptake across all sources but suppressed early BL efflux (4–8 hours), causing intracellular retention. Physiologically, this “promote uptake, inhibit efflux” dynamic may represent an adaptive response to prevent acute zinc loss in high-calcium environments common in swine and poultry diets (e.g., 1.2–2.0% Ca for bone health; NRC 2012). However, prolonged retention risks zinc toxicity or disrupted homeostasis, potentially contributing to reduced performance in animals on limestone-supplemented feeds (Kwiecień et al. Reference Kwiecień, Winiarska-Mieczan and Milczarek2016). Organic sources, especially ZnM and ZnG, showed resilience, maintaining higher net transport, likely due to alternative efflux pathways less competed by calcium.
The molecular mechanism underlying calcium-induced zinc retention was further clarified by transcriptomic analysis. High calcium activated the MAPK signaling pathway and ER protein processing pathway in IPEC-J2 cells. ER stress induced by excessive intracellular ions may reduce the membrane localization or activity of zinc efflux-related proteins, thereby decreasing transcellular zinc flux even with high intracellular zinc levels (Ellis et al. Reference Ellis, Wang and MacDiarmid2004). Interestingly, organic zinc (ZnM and ZnG) specifically regulated sulfur metabolism and thyroid hormone signaling pathways under high-calcium conditions, which were not activated in the ZnS group. Sulfur metabolism is closely associated with the synthesis of metallothionein (MT), a key protein for zinc homeostasis (Bell and Vallee Reference Bell and Vallee2009), while thyroid hormone signaling may modulate zinc transport-related processes (Kambe et al. Reference Kambe, Taylor and Fu2021). These results suggest that organic zinc can mitigate calcium-induced zinc retention by activating alternative metabolic pathways, explaining why the inhibitory effect of high calcium on organic zinc transport is weaker than that on inorganic zinc. Molecularly, high-calcium-activated MAPK signaling and ER protein processing were enriched across sources, inducing ER stress that may downregulate zinc exporters such as ZnT1, thereby promoting zinc retention (Ellis et al. Reference Ellis, Wang and MacDiarmid2004). Uniquely, ZnM and ZnG engaged sulfur metabolism and thyroid hormone signaling under calcium stress. Sulfur metabolism links to MT synthesis, buffering intracellular zinc and countering calcium-induced perturbations (Bell and Vallee Reference Bell and Vallee2009). Thyroid hormone signaling could modulate transporter expression (e.g., ZIP4 upregulation), enhancing adaptive absorption in challenged environments (Kambe et al. Reference Kambe, Taylor and Fu2021). These organic-specific responses elucidate why chelated zinc mitigates antagonism more effectively, offering a molecular rationale for its use in high-calcium formulations.
In livestock production, prioritizing moderate-strength organic zinc like ZnG and ZnM in high-calcium diets could optimize supplementation, reducing deficiency risks and improving efficiency. Future in vivo trials in pigs are essential to validate these mechanisms and guide feed formulations.
Supplementary material
The supplementary material for this article can be found at https://doi.org/10.1017/anr.2026.10039.
Acknowledgements
This work was supported by the National Key R&D Program of China (2021YFD1300405, 2022YFD1300504), the Science and Technology Innovation Program of Hunan Province (2023RC3201), the Youth Innovation Promotion Association of Chinese Academy of Sciences (2022370).


 Open access

