

1. Introduction: modern bio-imaging
Light microscopy, greatly advanced since the days of Hooke and van Leeuwenhoek (Hooke, Reference Howells, Beetz and Chapman1667), now allows routine imaging of living cells, tissues (Osten & Margrie, Reference Neutze, Brändén and Schertler2013) and whole organisms in three-dimensions (3D) (Santi, Reference Rossmann and Blow2011). For centuries, the spatial resolution of light microscopes has been limited to ~200 nm by the wavelength of photons in the visible range of the electromagnetic spectrum. However, thanks to the advent of fluorescent probes and super-resolution techniques, the resolution of light microscopes under certain conditions approaches the tens of nanometers (Huang et al. Reference Huang, Nelson and Kirz2009a). This advance coincides with breakthroughs in cryo-electron microscopy, which can now reach near atomic resolution due to the developments in direct electron detectors and advanced 3D image reconstruction algorithms (Battaglia et al. Reference Battaglia, Contarato, Denes and Giubilato2009; Callaway, Reference Callaway2015; Ludtke et al. Reference Ludtke, Baldwin and Chiu1999; Bai et al. Reference Bai, McMullan and Scheres2015; Miao et al. Reference Miao, Ercius and Billinge2016). Leveraging the progress in both fields, correlative microscopes now offer the combination of light and electron-based imaging for thin (<1 µm) samples (Watanabe et al. Reference Watanabe, Punge and Hollopeter2011).
Compared to light and electron microscopes, X-rays can be used to obtain tomographic renderings of entire living organisms and are a workhorse of medical diagnostics. Large instruments, synchrotrons and X-ray free-electron lasers (XFELs), have been constructed to produce ever-brighter X-ray sources for scientific and industrial use. Despite the index of refraction of X-rays being close to one, X-ray optics are under constant development, and new methods, as well as improved computational resources, make high-resolution X-ray imaging possible (Miao et al. Reference Miao, Ishikawa, Robinson and Murnane2015). Some of these X-ray structure determination methods can now, in principle, achieve diffraction-limited resolution. A number of Nobel prizes have been awarded for the scientific foundations that underlie our understanding of diffraction and its applications, and many more works continue to fuel new discoveries in the field.
In this paper, we will review some of the key recent developments in X-ray diffraction in relation to biology. We will focus on coherent diffractive imaging methods (CDI), but also discuss new developments in diffraction techniques such as serial femtosecond X-ray crystallography (SFX), small-angle X-ray scattering (SAXS) and nanodiffraction. We will review the broad biological applications enabled by these diffractive imaging methods and coherent X-ray sources such as XFELs.
2. Coherent diffractive imaging
CDI is a lensless imaging technique that promises to fill the gap between light and electron microscopes, and complement existing imaging modalities (Miao et al. Reference Miao, Ishikawa, Robinson and Murnane2015; Chapman & Nugent, Reference Chapman and Nugent2010; Kirian & Chapman, Reference Kirian, Chapman, Jaeschke, Khan, Schneider and Hastings2015; Miao et al. Reference Miao, Charalambous, Kirz and Sayre2004). While X-ray microscopes can image μm-thick specimens, they are fundamentally limited by the efficiency, resolution and depth-of-focus of X-ray lenses (de Jonge et al. Reference Deng, Vine and Chen2014). CDI avoids the use of X-ray lenses to determine the structures of biological specimens in 3D; its resolution is in principle limited by radiation damage (Howells et al. Reference Huang, Bates and Zhuang2009; Shen et al. Reference Seibert, Ekeberg and Maia2004). CDI techniques rely on iterative algorithms to reconstruct the complex exit wave from biological specimens (Schlichting & Miao, Reference Sayre, Schlenker, Fink and Goedgebuer2012; Shechtman et al. Reference Shechtman, Eldar and Cohen2015; Mancuso et al. Reference Mancuso, Yefanov and Vartanyants2010; Spence et al. Reference Song, Jiang and Mancuso2012). Because of these unique advantages, CDI has broad applications and has been experimentally reformulated in various forms. We focus this section on the application of CDI to imaging of biological specimens and conclude with a perspective on the future role of CDI in the modern renaissance of microscopic imaging.
2.1 X-ray sources used in CDI
The discovery of X-rays by Röntgen quickly led to applications of the first X-ray sources – vacuum tubes within which electrons were accelerated against a metal target, emitting radiation (bremsstrahlung). This type of X-ray source is compact and still common today. Larger sources of X-rays known as synchrotron radiation are used for research applications to achieve X-ray beams with higher brightness and coherence. In synchrotron radiation, an electron bunch is first accelerated to energies ranging from hundreds of MeV to several GeV and then injected into a circular-shaped storage ring. An electron bunch emits intense X-rays as it travels through insertion devices: undulators and wigglers that can be installed at different locations along the storage ring. At each insertion device, a beam line is constructed to harness and focus the emitted X-rays for various research purposes. Because many different stations can be installed onto a single ring, various experiments are carried out at once in a single synchrotron. A large number of synchrotron facilities are in operation worldwide. More advanced sources are now under development or will emerge from renovations to existing facilities (Eriksson et al. Reference Fahimian, Mao, Cloetens and Miao2014). While their flux and coherence grow with each upgrade, synchrotrons suffer intrinsic limitations: their shortest X-ray pulses are measured in picoseconds and their coherent flux and volumes are limited to a fraction of the full beam.
One concept for an ultimate X-ray source involves the use of a linear accelerator to generate ultra-fast and extremely bright X-ray pulses, known as an XFEL. Modern XFELs are a long way from the first FEL demonstrated in the early 1970s (Madey, Reference Madey1971). XFELs now improve upon synchrotron X-ray beams by several orders of magnitude in coherence, brilliance and pulse duration. Two XFELs in the soft X-ray regime (< 2 keV) are now operational; the first located at DESY in Hamburg, and the second at the Elletra Sincrotrone, in Trieste (Ackermann et al. Reference Ackermann, Asova and Ayvazyan2007; Allaria et al. Reference Allaria, Appio and Badano2012). Two hard XFELs (> 2 keV) are also operational, one at the SLAC National Accelerator Laboratory in California, and the other at the RIKEN-SPring-8 center in Japan (Emma et al. Reference Eriksson, van der Veen and Quitmann2010; Ishikawa et al. Reference Jensen, Toft and David2012). Both hard XFELs produce transversely coherent and ultra-short X-ray pulses in the range of a few to hundreds of femtoseconds with a flux of 1011–1012 photons per pulse and an energy range from 2 to 15 keV. A European XFEL with similar specifications to current hard XFELs, but with a much higher repetition rate, is soon to come online, and several other XFELs are also under construction in Switzerland, South Korea and China.
2.2 The principle of CDI
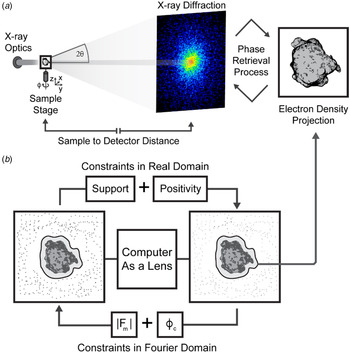
When a coherent beam of light strikes a non-crystalline object or a nanocrystal, the scattered photons produce what is known as a diffraction pattern. This pattern uniquely encodes the structure of the object. Unlike diffraction from a crystal, a non-crystalline object produces a far field pattern that is continuous. While the intensities in this measured pattern are proportional to the magnitude squared of the Fourier transform of the object, the phase information is lost, which gives rise to the well-known phase problem in X-ray diffraction. The phase problem has been solved by a number of methods in X-ray crystallography (Hendrickson, Reference Henrich, Bergamaschi and Broennimann1991; Perutz, Reference Perutz1956; Rossmann & Blow, Reference Rodriguez, Xu and Chen1962; Usón & Sheldrick, Reference Thibault and Guizar-Sicairos1999). However, these methods are not directly applicable to non-crystalline objects in CDI. Instead, the phase problem in CDI is solved using iterative algorithms that require a diffraction pattern be sampled at higher than the Nyquist interval, which is known as an oversampling of the pattern (Miao et al. Reference Miao, Ishikawa, Shen and Earnest1998). Once a diffraction pattern is oversampled such that the number of independently measured data points is larger than the number of unknown variable associated with the object (known as the oversampling criterion), its measured intensities alone can be used to determine the structure of an object (Miao et al. Reference Miao, Chapman, Kirz, Sayre and Hodgson1999), utilizing Fourier-based iterative algorithms (Chen et al. Reference Chen, Miao, Wang and Lee2007; Elser, Reference Emma, Akre and Arthur2003; Fienup, Reference Fratzl, Jakob, Rinnerthaler, Roschger and Klaushofer1978; Gerchberg & Saxton, Reference Giewekemeyer, Hackenberg and Aquila1972; Luke, Reference Luke2005; Marchesini et al. Reference Marchesini, He and Chapman2003; Rodriguez et al. Reference Robinson, Vartanyants, Williams, Pfeifer and Pitney2013; Shechtman et al. Reference Shechtman, Eldar and Cohen2015). The algorithm iterates between real and reciprocal space by using the fast Fourier transform and its inverse (Fig. 1). In each iteration, physical constraints such as support and positivity are enforced in real space, while the measured Fourier magnitudes are applied in reciprocal space. The algorithm is monitored by an error metric, defined as the difference between the measured and calculated Fourier magnitudes. For the first iteration, a random phase set is used as an initial input. After several hundreds to thousands of iterations, the correct phases can be retrieved. Due to the incomplete data and noise present in the experimental measurements, a large number of independent iterative runs are usually performed on each diffraction pattern. Those with the smallest error metric are averaged to produce the final reconstruction.
The principle of CDI. (a) A schematic diagram of the basic CDI experimental setup shows a coherent beam impinging upon a sample and producing diffraction that is measured by a detector. The sample can be translated or rotated to produce diffraction from various orientations or regions of the sample. The measured diffraction patterns are sampled finer than the Nyquist interval to allow for ab initio phasing, which when accomplished reveals a projected electron density of the sample. (b) The phase retrieval process is illustrated as a computational lens. An iterative procedure applies constraints in real and reciprocal space to achieve convergence and produce a solution that satisfies the measured data in reciprocal space and the constraints applied to the reconstructed image in real space, such as support and positivity. During each iteration of the phase retrieval process, the magnitudes (|F m|), which are derived from intensities, are recombined with calculated phases (ϕ c) from the updated model. A final model is produced that represents the projected electron density of the object most consistent with the measured intensities. By measuring diffraction patterns from different sample orientations, the 3D structure of the sample can be determined using this iterative algorithm.

2.3 A brief history of CDI
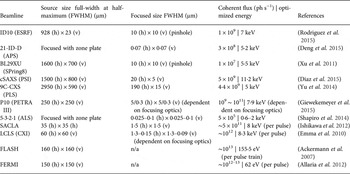
The concept of CDI was first suggested by Sayre who considered the determination of structures by a crystallographic method that obviated the need for a crystal (Sayre, Reference Sayre1952, Reference Santi1980). When an isolated object is irradiated by a coherent wave or an extended object is radiated by a coherent beam with a finite size, the diffraction pattern forms a continuous speckle pattern. If this continuous diffraction pattern is is satisfied with the oversampling criterion (Miao et al. Reference Miao, Ishikawa, Shen and Earnest1998), the phase information is in principle encoded in the diffraction intensities and can be retrieved by iterative algorithms (Fienup, Reference Fratzl, Jakob, Rinnerthaler, Roschger and Klaushofer1978; Gerchberg & Saxton, Reference Giewekemeyer, Hackenberg and Aquila1972). The first experimental demonstration of this method was performed in 1999 by Miao and collaborators using a test specimen (Miao et al. Reference Miao, Chapman, Kirz, Sayre and Hodgson1999). In the decade that followed this landmark experiment, a flurry of activity propelled the use of CDI for the interrogation of varied biological specimens, including cells, organelles, viruses and protein complexes (Miao et al. Reference Miao, Ishikawa and Johnson2015). Currently, a large number of endstations at world-class synchrotron facilities carry out CDI of biological specimens (Table 1), and all the operating free-electron laser facilities in the world are CDI-capable (Amann et al. Reference Amann, Berg and Blank2012; Emma et al. Reference Eriksson, van der Veen and Quitmann2010; Ishikawa et al. Reference Jensen, Toft and David2012), which provide an opportunity for high-throughput, high-resolution CDI.
Profiles and specifications of CDI beamlines worldwide established at 3rd generation synchrotrons and XFELs

2.4 Biological CDI: an overview
The roadmap to routine CDI of biological specimens is a work in progress (Aquila et al. Reference Aquila, Barty and Bostedt2015). This effort has two primary goals: the first is the correlative high-resolution imaging of large samples such as whole cells, and the other is the high-throughput imaging of macromolecular assemblies or single molecules in 3D. Radiation damage ultimately limits the spatial resolution achieved by CDI of biological specimens (Howells et al. Reference Huang, Bates and Zhuang2009; Shen et al. Reference Seibert, Ekeberg and Maia2004). For weakly scattering samples such as cells, faithful measurement of the continuous diffraction pattern across its entire signal range still requires improvement. The collection of high-resolution data needs bright coherent X-ray sources due to the logarithmic decay of diffracted signals from non-crystalline objects. The emergence of 3rd generation synchrotron facilities around the world has opened the door to high-resolution CDI. Advanced detector technologies have played an important role in updated beamlines, giving accurate measurements of weak diffraction signals at high spatial frequencies (Hart et al. Reference Hatsui and Graafsma2012; Hatsui & Graafsma, Reference Hattne, Echols and Tran2015; Henrich et al. Reference Hirata, Shinzawa-Itoh and Yano2009; Kameshima et al. Reference Kameshima, Ono and Kudo2014; Ponchut et al. Reference Ponchut, Rigal and Clément2011; Strüder et al. Reference Strüder, Epp and Rolles2010). New CDI methods have also been developed to accommodate different sample geometries. Once limited to isolated non-crystalline objects, CDI is now performed on large continuous samples by scanning methods (Faulkner & Rodenburg, Reference Feigin, Svergun, Taylor and Taylor2004; Maiden & Rodenburg, Reference Maiden and Rodenburg2009; Thibault et al. Reference Thibault, Dierolf and Menzel2008). Crystals are also explored using CDI by careful measurement of their oversampled Bragg reflections (Ayyer et al. Reference Ayyer, Yefanov and Oberthür2016; Chapman & Nugent, Reference Chapman and Nugent2010; Huang et al. Reference Huang, Harder, Leake, Clark and Robinson2012; Pfeifer et al. Reference Pedrini, Menzel and Guizar-Sicairos2006; Robinson et al. Reference Rambo and Tainer2001; Takahashi et al. Reference Takahashi, Suzuki and Furutaku2013). Combined improvements to CDI methods, X-ray facilities and detectors have made practical the application of CDI to cells, cellular organelles, viruses and even large protein molecules.
2.4.1 Biological CDI: early experiments
After the first successful demonstration of CDI on a test sample (Miao et al. Reference Miao, Charalambous, Kirz and Sayre1999), excitement turned toward the imaging of biological materials: starting with cells and toward single large macromolecular complexes. The first biological CDI experiment was carried out using Escherichia coli bacteria labeled with manganese-tagged yellow fluorescent protein. Correlative studies between CDI and fluorescence microscopy show the distribution of protein inside the bacteria with a resolution of 30 nm (Miao et al. Reference Miao, Förster and Levi2003). Next, CDI was used to image freeze-dried Saccharomyces cerevisiae and reveal their subcellular components with minimal structural changes (Shapiro et al. Reference van der Schot, Svenda and Maia2005). In a related experiment, molecular labeling tools were used to enhance the contrast and diffraction signal from the cells, producing 2D images with a spatial resolution of 11 nm (Nelson et al. Reference Nelson, Huang and Steinbrener2010). To maintain the integrity of biological specimens during the high-dose exposures required for high-resolution CDI, cryogenic techniques typical in electron microscopy and crystallography were adapted. In one study, yeast cells were plunge-frozen into liquid ethane and kept in vitreous ice under cryogenic temperatures. CDI images reveal the structure of the frozen-hydrated yeast cells at a resolution of 25 nm without the need for labels (Huang et al. Reference Hunter, Segelke and Messerschmidt2009b). In another study, frozen-hydrated Deinococcus radiodurans bacteria were bathed in a cryogenic nitrogen gas jet and imaged with coherent X-rays at a resolution of 30–50 nm (Lima et al. Reference Lima, Wiegart and Pernot2009). The implementation of cryogenic techniques has been an important step toward one of CDI's major goals: high-resolution 3D imaging of whole cells in their native state.
Meanwhile, CDI has been explored to image smaller biological objects such as virus particles. Using 3rd generation synchrotron radiation, coherent X-ray diffraction patterns were measured from a single unstained herpesvirus. To monitor the potential radiation damage to the virus, three diffraction patterns were sequentially measured, each with a radiation dose of 3·5 × 107 Gy. Careful examination of the patterns indicated no measurable change. The three patterns were added to produce a final dataset, from which an image of the herpesvirus virion was reconstructed with a resolution of 22 nm (Song et al. Reference Shen, Bazarov and Thibault2008). It was not until the emergence of XFELs that similarly sized or smaller macromolecular complexes were imaged again using CDI. In addition to viruses, CDI was also used to image bone biomineralization at nanometer scale resolution. From a sample of intramuscular fish bone, CDI revealed the spatial relationship between mineral crystals and the collagen matrix at different stages of mineralization (Jiang et al. Reference Jiang, Song and Chen2008). A dynamic model was proposed to explain the nucleation and growth of mineral crystals in the collagen matrix. This experiment illustrated the utility of using CDI to investigate biological materials.
2.4.2 Biological CDI in 3D
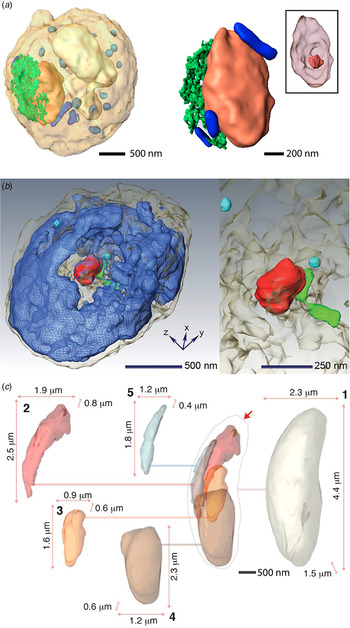
Successful 3D CDI reconstructions were first achieved using radiation-hard samples in a dehydrated state. A fixed and air-dried human chromosome in its condensed state was the first to be imaged (Nishino et al. Reference Nishino, Takahashi, Imamoto, Ishikawa and Maeshima2009). Using hard X-rays, 38 patterns spanning an angular range of 140°, were combined to produce a 3D reconstruction of the chromosome with a 2D resolution of 38 nm and a 3D resolution of 120 nm. The lower resolution in 3D was attributed to radiation damage incurred by the sample due to the 2 × 10¹⁰ Gy it received during measurement. Next, a radiation hard yeast spore was reconstructed in 3D, also using hard X-rays (Jiang et al. Reference Johansson, Arnlund and Katona2010). This time a resolution of 50 nm was achieved in 3D from only 25 projections spanning nearly 140° (Fig. 2a ). The sample sustained a total dose of only 5·25 × 108 Gy. The strategy of limiting dose to a small number of high-resolution projections produces better results in 3D, but requires advanced 3D image reconstruction algorithms from a limited number of 2D projections (Miao et al. Reference Miao, Ercius and Billinge2005; Fahimian et al. Reference Faulkner and Rodenburg2010; Lee et al. Reference Lee, Fahimian and Iancu2008).
Quantitative 3D imaging of cells and subcellular structures by CDI. (a) 3D reconstruction of a yeast spore (left) with individual organelles highlighted: nucleus (orange), vacuole (white), ER (green), granules (light blue) and mitochondria (blue). Enlarged view of the nucleus (right) showing its internal morphology, including the nucleolus (inset). Adapted by permission from National Academy of Sciences: PNAS (Jiang et al. Reference Johansson, Arnlund and Katona2010), copyright (2010). (b) Volume rendering of the 3D architecture of a whole, unstained mouse micronucleus (left). Nuclear substructures are indicated, including nuclear envelope (gray), chromatin (blue), nucleolus-like structure (red), condensed chromatin (green) and nuclear blobs (cyan). Enlarged view of the nucleolus, condensed chromatin and nuclear blobs (right). Adapted by permission from Elsevier: Biophysical Journal (Song et al. Reference Sherrell, Foster and Hudson2014), copyright (2014) (c) 3D sub-cellular architecture of a frozen-hydrated N. caninum cell. Various substructures are highlighted and their relative size and position within the cell are indicated as follows: (1) cell boundary (pearl), (2) rhoptries (red), (3) possible apicoplast (orange), (4) nucleus (brown), (5) mitochondrion (blue). Adapted with permission from the International Union of Crystallography: IUCrJ (Rodriguez et al. Reference Redecke, Nass and DePonte2015), copyright (2015).

2.4.3 Cryogenic CDI in 3D
The 3D structure of a hydrated cell in its native state was recently obtained by combining cryogenic methods with 3D CDI techniques (Rodriguez et al. Reference Redecke, Nass and DePonte2015). The cell, a protozoan parasite relative of malaria named Neospora caninum, was suspended in a cryogenic gas jet while a tomographic data series was acquired consisting of 72 diffraction patterns spanning approximately 111° (−60·6–50·9°). The cell endured a dose of 4·55 × 108 Gy without showing signs of damage based on a comparison between diffraction patterns before, during and after data collection. The patterns were assembled into a 3D diffraction matrix, which was phased to produce the structure of the cell in its native, frozen state (Fig. 2c ) with a full period spatial resolution of 74 nm in the direction perpendicular to the beam, and 99 nm in the beam direction. The 3D reconstruction revealed the subcellular architecture of the cell, broadly outlining the unique organelle assembly of the parasite (Fig. 2c ). An intact 3D structure of this cell, too large for high-resolution structural analysis by electron microscopy, would otherwise remain out of reach. Although in this case data collection was achieved within a 5-h timeframe, the time is expected to decrease significantly as dedicated beamlines optimize the workflow for this type of experiment, and as brighter sources become available. Algorithms are also rapidly improving to provide users with rapid reconstructions from their diffraction data (Chen et al. Reference Chen, Spence and Millane2014; Elser, Reference Emma, Akre and Arthur2003; Guizar-Sicairos et al. Reference Guttman, Weinkam, Sali and Lee2011; Luke, Reference Luke2005; Marchesini et al. Reference Marchesini, Krishnan and Daurer2016; Rodriguez et al. Reference Robinson, Vartanyants, Williams, Pfeifer and Pitney2013; Thibault & Guizar-Sicairos, Reference Takayama, Maki-Yonekura, Oroguchi, Nakasako and Yonekura2012). Meanwhile, new CDI techniques have been developed to cope with non-isolated samples. One new method, termed ptychographic CDI (Rodenburg et al. Reference Rodenburg, Hurst and Cullis2007; Thibault et al. Reference Thibault, Dierolf and Menzel2008), has adapted the phase retrieval methods in CDI to the geometry of scanning transmission X-ray microscopy and in doing so allowed the investigation of complex systems from single cells to whole tissues.
2.5 Ptychographic CDI
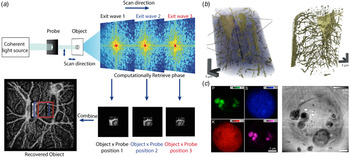
Ptychographic CDI scans a confined beam across an extended sample, acquiring diffraction patterns along the way (Fig. 3a ). In this way, it effectively extends the coherence length of the source and relaxes requirements on sample preparation; it is no longer necessary for the specimen under investigation to be isolated. After the initial X-ray demonstration (Rodenburg et al. Reference Rodenburg, Hurst and Cullis2007), dry but unstained microbes were among the first targets for X-ray ptychography (Giewekemeyer et al. Reference Ginn, Brewster and Hattne2010). Ptychographic images of D. radiodurans were reconstructed with a resolution of 85 nm; the radiation hard cells tolerated a dose of 1·5 × 105 Gy. These robust cells remained the subject of later studies, which would achieve a resolution of 50 nm for cells in a dehydrated state using ptychographic techniques (Wilke et al. Reference Wilke, Priebe and Bartels2012). The combination of cryogenic and ptychographic techniques would again lead to the imaging of frozen hydrated yeast cells at high resolution (Lima et al. Reference Lima, Diaz and Guizar-Sicairos2013).
Ptychographic CDI (a) A schematic diagram of a ptychography experiment. A confined coherent beam (probe) impinges on a small region of an extended object. Scanning across the sample produces multiple diffraction patterns from overlapping regions. Images of these confined regions can be reconstructed to retrieve an image of the entire extended object. The overlap between individual images provides extra constraints for phase retrieval. (b) 3D rendering of a ptychographic reconstruction of a mouse femur indicating (L) osteocyte lacunae and (C) the connecting canaliculi (left). An iso-surface rendering of the lacunocanalicular network obtained by segmentation (right). Adapted by permission from Macmillan Publishers Ltd: Nature (Dierolf et al. Reference Ekeberg, Svenda and Abergel2010), copyright (2010). (c) Elemental distributions of P, S, K and Ca within a frozen hydrated C. reinhardtii alga (right). Phase image of the same alga reconstructed by ptychography. A number of organelles are identified: cell wall (Cw), polyphosphate bodies (Ph), pyrenoid (Py), thylakoids (Th), chloroplasts (Ch), startch granuale (Sg) and starch sheath (Sh) (left). The white spots are due to beam-induced damage caused by a stage malfunction during the scan. Adapted by permission from the National Academy of Sciences: PNAS (Deng et al. Reference Diaz, Malkova and Holler2015), copyright (2015).

Ptychographic CDI was later applied to more complex cell types using soft X-rays (Maiden et al. Reference Maiden, Morrison, Kaulich, Gianoncelli and Rodenburg2013). Balb/3T3 mouse fibroblast cells treated with CoFe2O4 nanoparticles were imaged using soft X-ray ptychography, whilst varying the X-ray wavelength across the L absorption edge of iron (between 694 and 724 eV). The resultant images allowed the localization of nanoparticle clusters, although individual nanoparticles could not be revealed due to the modest resolution of 250 nm (Maiden et al. Reference Maiden, Morrison, Kaulich, Gianoncelli and Rodenburg2013). This has been taken one step further with fully hydrated, but fixed cells being imaged within the water window by ptychography (Jones et al. Reference de Jonge, Patterson and Ryan2016). Careful characterization of the cellular mass density of mouse embryonic fibroblasts (MEF) through a combination of ptychography and X-ray fluorescence experiments allowed quantitative determination of the molar concentration of several elements within different sub-cellular compartments. Ptychography has benefited enormously from extensive algorithm development, with close to real-time reconstructions now being possible (Maiden & Rodenburg, Reference Maiden and Rodenburg2009; Marchesini et al. Reference Marchesini, Krishnan and Daurer2016; Nashed et al. Reference Mylonas, Hascher and Bernadó2014; Thibault & Guizar-Sicairos, Reference Takayama, Maki-Yonekura, Oroguchi, Nakasako and Yonekura2012; Thibault et al. Reference Svergun, Petoukhov and Koch2009). One important development in ptychography has been the introduction of multiple probe ‘modes’ (Burdet et al. Reference Burdet, Shi and Parks2015; Thibault & Menzel, Reference Thibault, Dierolf, Bunk, Menzel and Pfeiffer2013). This allows not only the use of partially coherent sources, such as table-top and HHG X-ray sources, but also novel fast scan geometries (Huang et al. Reference Huang, Lauer and Clark2015).
2.5.1 Tomographic ptychography
For even more robust biological specimens, tomographic ptychography is now a reality. The tomographic structure of a small bone sample was recovered by ptychographic methods in which structures on the 100 nm length scale were observed (Dierolf et al. Reference Ekeberg, Svenda and Abergel2010) (Fig. 3b ). A similar approach has been used to image nanostructures within human dentine (Zanette et al. Reference Zanette, Enders and Dierolf2015). In this experiment, 360 ptychographic projection images, spanning a 180° angular range, were measured and used to compute the 3D structure of a 50 µm dentine splinter to an isotropic resolution of 190 nm (Zanette et al. Reference Zanette, Enders and Dierolf2015). By accurately quantifying the mass density of the reconstruction from the recovered complex transmission function it was possible to classify different tubular nanostructures within the sample. In attempts to reconstruct smaller cell types via cryogenic tomographic ptychography, 59 ptychographic projections were measured from a budding yeast cell embedded in vitreous ice and a 3D structure was reconstructed with an isotropic resolution of 234 nm (Giewekemeyer et al. Reference Giewekemeyer, Thibault and Kalbfleisch2015). Other attempts at cryogenic tomographic ptychography include the imaging of Chlamydomas reinhardtii 137c cells both embedded in vitreous ice and in resin (Diaz et al. Reference Dierolf, Menzel and Thibault2015). A 3D structure was recovered using a novel reconstruction algorithm (Guizar-Sicairos et al. Reference Guttman, Weinkam, Sali and Lee2011) to a resolution of 180 nm in ice and 150 nm in resin. The mass density of the reconstruction was computed and used to identify and segment various cellular components (Diaz et al. Reference Dierolf, Menzel and Thibault2015). Current improvements in end station design, sample preparation and reconstruction algorithms aim to improve these resolutions even further.
2.6 Low-dose CDI for imaging fully hydrated cells
CDI methods excel in achieving high-resolution when inert samples are imaged, either dry or cryogenically preserved. However, living organisms, prone to movement and sensitive to the effects of radiation damage remained an elusive target for CDI. That changed in a recent demonstration where 2D projections of fully hydrated cells were obtained using 5 keV X-rays generated by a 3rd generation synchrotron source (Nam et al. Reference Mutzafi, Shechtman, Eldar, Cohen and Segev2013). Projections were obtained from two different subject cells, a yeast cell and a fresh water cyanobacterium. Each of the cells tolerated a high dose (~9 × 10⁷ and 1 × 10⁸, respectively) required to produce images with resolutions better than 40 nm. This demonstration was an important first step toward imaging of live cells at high resolution. A complementary step toward routine CDI of living cells is fast, low-dose data acquisition; this was achieved recently by means of a dose-efficient method. A 2D projection of red blood cells infected with the malaria parasite, Plasmodium falciparum, was computed from data acquired with a dose as low as 1·2 kGy (Jones et al. Reference Jones, Elgass, Junker, de Jonge and van Riessen2014). This translates to an exposure time of only 7 s in some 3rd generation synchrotron beam lines. Such efficient exposures would facilitate measurement of near real-time dynamics from living cells at high resolution. Live imaging techniques also open the door to correlative approaches, where light microscopy is now leaping to better spatial resolution.
2.7 Correlative CDI
The first experiment of correlating CDI with fluorescence microscopy was performed on manganese-tagged yellow fluorescent proteins inside E. coli (Miao et al. Reference Miao, Förster and Levi2003). In subsequent attempts, 3D CDI was correlated with fluorescence microscopy to reveal the 3D ultrastructure of mammalian nuclei with a resolution in the tens of nanometers (Song et al. Reference Sherrell, Foster and Hudson2014). A more recent demonstration of CDI as a correlative tool is the combination of ptychographic and X-ray fluorescence microscopy at cryogenic temperatures (Deng et al. Reference Diaz, Malkova and Holler2015). The projected image of a single frozen-hydrated green algae cell was resolved using 5·2 keV X-rays (Fig. 3c ), with a spatial resolution better than 30 nm obtained from diffracted X-rays, and better than 90 nm from fluorescence emitted by the sample. Images of X-ray induced fluorescence were obtained from several trace elements, including potassium, sulfur and phosphorous, to generate a composite image that provided not only the structure of the cell in question, but also a partial view of its chemical makeup. The results, while impressive, remain 2D, making complex structures within the visualized cell difficult to interpret. In 3D, such a method would provide unprecedented access to the inner workings of whole cells with high spatial resolution and multimodal sources of structural and chemical information.
2.8 Tabletop CDI
While CDI is now performed routinely at 3rd and 4th generation X-ray sources worldwide, it remains out of reach for the biology community at large. Tabletop X-ray sources aim to broaden the accessibility to CDI while promising the high temporal and spatial resolutions of XFEL sources (Murnane & Miao, Reference Murnane and Miao2009). In a first demonstration of CDI with high-harmonic generation (HHG) sources, the image of a test mask was obtained with a resolution of 214 nm using a 29 nm HHG beam, and the resolution was then improved to 70–90 nm by using a soft X-ray laser and a HHG source (Sandberg et al. Reference Sandberg, Paul and Raymondson2007, Reference Sandberg, Song and Wachulak2008). Later, a laser-driven ultra-short tabletop X-ray source was used to probe the structure of another test mask (Ravasio et al. Reference Ravasio, Gauthier and Maia2009). From single 20 fs long coherent X-ray pulses, projections of the test mask were recovered with a spatial resolution of 119 nm; the combination of several pulses produced projections with 62 nm resolution. More recently, tabletop CDI has been demonstrated with a resolution of 22 nm using a 13 nm HHG source (Seaberg et al. Reference Seaberg, Adams and Townsend2011). Meanwhile, tabletop HHG sources are rapidly advancing with the goal of producing coherent, ultra-short, bright, X-rays in the keV range (Popmintchev et al. Reference Petoukhov and Svergun2012). These and other similar improvements are expected to make the investigation of cellular and molecular structures more accessible by CDI.
2.9 CDI with XFELs
Though much progress has been made in CDI at synchrotron sources, radiation damage still remains an insurmountable barrier. The theoretical upper resolution limit of cryogenic CDI was estimated to be 5–10 nm, based on the intersection of an experimentally determined maximum tolerable dose of biological material and the Rose criterion for imaging (Howells et al. Reference Huang, Bates and Zhuang2009; Shen et al. Reference Seibert, Ekeberg and Maia2004). Bright new X-ray sources promise to beat the current resolution limits of X-ray methods by capturing diffraction from samples faster than damage occurs. The possibility of obtaining damage-free structures by acquiring diffraction data before the onset of radiation damage was first suggested in 1986 (Solem, Reference Solem1986). The feasibility of such experiments was later hypothesized through molecular dynamics simulations based on the projected parameters, including flux, spot size, and pulse duration of XFEL-based experiments (Neutze et al. Reference Nashed, Vine and Peterka2000).
Intense coherent X-ray pulses produced by free-electron lasers were first used to reconstruct the projection image of a micro-patterned structure directly from its oversampled diffraction pattern (Chapman et al. Reference Chapman, Barty and Bogan2006). The diffraction pattern was produced using 32 nm X-rays from intense coherent 25 fs pulses with 1012 photons each. By achieving signal with diffraction-limited resolution before any measurable damage was experienced by the sample, this first study proved the concept of ‘diffraction-before-destruction,’ now a mainstay of XFEL experiments (Chapman et al. Reference Chapman, Barty and Bogan2006). It was not long before, based on this very principle, a single virus particle was introduced to a femtosecond X-ray pulse from an XFEL. The virus in question, a giant mimivirus, was vaporized by the pulse but left a continuous oversampled diffraction pattern in its wake (Seibert et al. Reference Schlichting and Miao2011). A 2D projection of this virus was resolved with a spatial resolution of 32 nm. A high-throughput method was soon afterward developed to extend this approach and diffract from a heterogeneous mixture of polyhedral cell organelles of varying size, known as carboxysomes (Hantke et al. Reference Hart, Boutet and Carini2014). Such high-throughput methods could one day help catalog the inners of cells or the myriad of microorganisms whose structures remain unknown.
2.9.1 3D CDI with XFELs
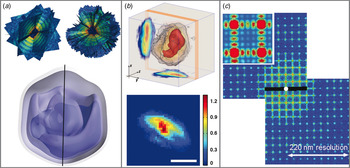
The difficulty of interpreting summed electron density from 2D projections alone poses a challenge for high-throughput CDI experiments using XFELs. That is why one goal of high-throughput XFEL-based diffraction methods remains the acquisition of 3D data by combination of patterns from many identical copies of a sample in different orientations (Bogan et al. Reference Bogan, Boutet and Barty2010). However, under special circumstances, this strategy can be circumvented to recover a 3D structure. Provided certain prior information can be assumed of the sample in question, for example, by taking advantage of the curvature of the measured diffraction pattern and symmetries intrinsic to a nanostructure, a single-measured pattern can provide 3D information (Raines et al. Reference Raines, Salha and Sandberg2010; Mutzafi et al. Reference Miao, Sayre and Chapman2015; Xu et al. Reference Xu, Jiang and Song2014). By turning one pattern into many, the 3D structure of a highly symmetric gold nanoparticle was retrieved with a spatial resolution of 5·5 nm from femtosecond XFEL pulses (Xu et al. Reference Xu, Jiang and Song2014). If one cannot rely on symmetry, enough identical copies of a sample must be intercepted by ultra-short and bright coherent X-ray pulses to produce a 3D set of diffracted intensities and permit retrieval of the structure in question (Fung et al. Reference Gallagher-Jones, Bessho and Kim2009; Loh & Elser, Reference Loh and Elser2009; Loh et al. Reference Loh, Bogan and Elser2010; Miao et al. Reference Miao, Hodgson and Ishikawa2002). This has recently been experimentally demonstrated by the reconstruction of the giant mimivirus with a spatial resolution of nearly 100 nm from 198 high-quality patterns produced by XFEL pulses (Ekeberg et al. Reference Elser2015) (Fig. 4a).
CDI experiments facilitated by XFEL. (a) First ten (top left) and full-set (top right) of 198 individual single-shot diffraction patterns taken from individual, aerosolized mimiviruses interrogated by XFEL pulses, assembled to create a 3D pattern. A wedge is cut out of the fully assembled 3D pattern to allow the central region to be viewed. 3D density map of a mimivirus particle reconstructed by 3D phase retrieval from the assembled 3D pattern (bottom). The image consists of a series of isosurface renderings going from low (most translucent) to high (least translucent) density. The black line indicates the pseudo-fivefold axis. Subfigure (a) adapted with permission from (Ekenberg et al. Reference Elser2015). (Copyrighted by the American Physical Society. (b) 3D reconstruction of an RNAi microsponge produced by synchrotron-based, tomographic CDI (top) (Gallagher-Jones et al. Reference Galli, Son and Barends2014). A high-density ‘core-like’ region is rendered in red. Projections along the x and y-axes are illustrated. 2D projection image of a RNAi sponge precursor captured by single-shot CDI using an XFEL pulse (bottom). The color bar represents relative electron density and the scale bar is 250 nm. (c) Centro-symmetrized diffraction pattern of a periodic structure captured at FLASH. The pattern shows both Bragg peaks and continuous diffraction between them (inset). Subfigure (c) adapted with permission from (Mancuso et al. Reference Mancuso, Schropp and Reime2009). (Copyrighted by the American Physical Society.)

2.9.2 Live cell imaging and correlative CDI with XFELs
Due to their ability to probe structures without concern for radiation damage, XFEL sources have also been used for CDI of living cells. Robust, heat-resistant bacteria, Microbacterium lacticum, were placed in a sealed X-ray transparent enclosure and targeted by femtosecond XFEL pulses (Kimura et al. Reference Kimura, Joti and Shibuya2014). The diffraction patterns measured from these cells extended to a resolution of 28 nm. Inversion of this pattern produced a 2D projection image of the cells in question, capturing the structure of the cells moments before their vaporization. A high-throughput implementation of this approach was later demonstrated on aerosolized cyanobacteria, C. gracile cells. Two-dimensional projection images of the cells were directly obtained from the inversion of a myriad of patterns, each from a single femtosecond pulse (van der Schot et al. Reference Thibault and Menzel2015). Such studies can also be combined with synchrotron X-ray experiments. The combination of synchrotron X-rays and ultrafast XFEL pulses has been applied to the characterization of RNA interference microsponges (Gallagher-Jones et al. Reference Galli, Son and Barends2014). A complete 3D structure of an RNA microsponge was obtained from 27 diffraction patterns at ~70 nm resolution, and in conjunction, a single projection of the sponge obtained from an XFEL pulse with a resolution of 17 nm (Gallagher-Jones et al. Reference Galli, Son and Barends2014) (Fig. 4b). This approach could be used to pre-characterize a specimen by synchrotron methods before obtaining high-resolution information at a critical time point.
3. Serial femtosecond X-ray crystallography
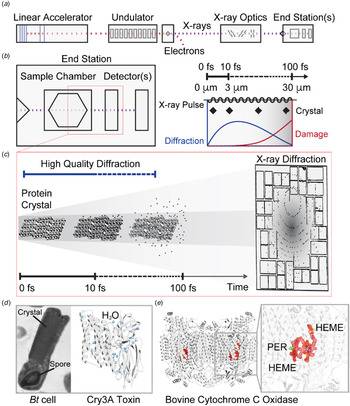
Another important method borne out of CDI and new XFEL sources is serial femtosecond X-ray crystallography (SFX) (Bogan, Reference Bogan2013; Feld & Frank, Reference Feld, Heymann and Benner2014; Martin-Garcia et al. Reference Martin-Garcia, Conrad, Coe, Roy-Chowdhury and Fromme2016; Neutze et al. Reference Nam, Park and Gallagher-Jones2015; Schlichting, Reference Schlichting2015; Spence et al. Reference Song, Jiang and Mancuso2012). By allowing the interrogation of micron-sized protein crystals at room temperature and free of radiation damage, SFX is advancing a revolution in protein crystallography (Schlichting & Miao, Reference Sayre, Schlenker, Fink and Goedgebuer2012; Schlichting, Reference Schlichting2015) (Fig. 5). The first experimental demonstration of single-shot diffraction from a periodic structure was performed at the FLASH facility in Hamburg, Germany (Mancuso et al. Reference Mancuso, Schropp and Reime2009) (Fig. 4c). In that experiment, several periodic nanostructured patterns were etched into a Si3N4 substrate, acting as an artificial 2D crystal. These patterns were exposed to individual pulse trains produced by FLASH, each pulse train exposing the samples to 1·5 × 1010, fully coherent photons. The resulting diffraction then showed Bragg peaks with diffuse scattering in between. A real space image was recovered through iterative phase retrieval with a resolution of ~38 nm. The limited resolution was mostly attributed to experimental restrictions, such as detector geometry and the long wavelength, 7·97 nm, of the incident X-ray pulses (Mancuso et al. Reference Mancuso, Schropp and Reime2009). Nevertheless this demonstration proved the feasibility of single-shot imaging of small periodic objects.
SFX determines damage-free atomic-resolution protein structures. (a) The basic components of an XFEL are illustrated: electron bunches begin at the linear accelerator, which drives these pulses past an undulator train, generating coherent X-ray pulses only femtoseconds long. The electron bunches are diverted leaving X-ray pulses to travel past X-ray optics and be directed toward an end station where further optics, sample manipulators and detectors await. (b) A diagrammatic layout (left) of an end station shows a sample chamber followed by one or more detectors for diffraction pattern collection, all within a single vacuum enclosure. A train of pulses enters a sample chamber and is diffracted by a single sample at a time. A schematic representation illustrates the time scales and distances involved in diffraction by a crystal from a single X-ray pulse (right). Damage processes and net diffraction are qualitatively shown, illustrating the decay of diffracted intensity as a function of X-ray damage as a function of pulse duration. (c) A graphic interpretation of a single pulse striking a nanocrystal is shown indicating radiation damage culminating in a Coulomb explosion only after a diffraction pattern is produced and ultimately recorded by a downstream detector. The time scale for this process is measured in femtoseconds. (d) The structure of the insecticidal toxin Cry3A protein, from which nanocrystals were grown in B. thuringiensis cells (left) has been determined using SFX (right) (Sawaya et al. Reference Saldin, Poon and Shneerson2014). Density for a number of coordinated water molecules determined by this structure is shown in blue. (e) A damage-free structure of bovine cytochrome c oxidase has also been determined, shown in ribbon diagram. The structure is judged to be radiation free given the clear presence of electron density for a radiation sensitive peroxide (green mesh, yellow atoms) in the structure (Hirata et al. Reference Hooke2014). The peroxide is coordinated adjacent to a HEME ligand (red mesh, orange sticks).

3.1 SFX: first demonstration
These ideas were later built upon using the LCLS (Linac Coherent Light Source) at Stanford (Chapman et al. Reference Chapman, Fromme and Barty2011). In the experiments that followed, diffraction was recorded from single-protein crystals, including those grown from the photosystem I (PSI) complex. These crystals were exposed to single XFEL pulses, carrying ~1012 photons. Since crystals were destroyed by a single pulse, new crystals were delivered to the interaction zone in a continuous stream via a liquid injector, equipped with a gas dynamic virtual nozzle (GDVN) (Weierstall et al. Reference Weierstall, Spence and Doak2012). This experimental geometry gave the technique of SFX. In SFX, single crystals can only give rise to partial, incomplete reflections for a given diffraction pattern. To properly assess the intensity of a reflection, many samplings must be combined. At the time, it took more than one hundred thousand measured diffraction patterns, and over fifteen thousand indexed patterns from randomly orientated crystals to assemble a fully sampled 3D reciprocal lattice. The final structure was resolved to 8·5 Å. Interestingly, interference patterns between Bragg peaks were also observed at low resolution and were used to directly reconstruct the shape of the crystal by the Bragg CDI method (Huang et al. Reference Huang, Harder, Leake, Clark and Robinson2012; Pfeifer et al. Reference Pedrini, Menzel and Guizar-Sicairos2006; Robinson et al. Reference Rambo and Tainer2001). While at this resolution the damage-free nature of the structure was challenging to assess, subsequent experiments have indicated that, for many crystals, including those of known radiation sensitive proteins such as cytochrome c oxidase, the structures remain intact when diffracted by SFX methods (Hirata et al. Reference Hooke2014) (Fig. 5).
3.2 Time-resolved experiments, new structures and in vivo crystallography by SFX
These initial demonstrations opened the door to a variety of experiments. The first of these was to prove that SFX, when using hard X-rays, could achieve similar results to those already possible at synchrotrons. The structure of the model protein Lysozyme was solved to 1·9 Å resolution from microcrystals approximately 1 × 1 × 3 µm3 in size (Boutet et al. Reference Boutet, Lomb and Williams2012). Similarly, the approaches were also applied to Photosystem II (PSII). Initial experiments resolved the room temperature structure of PSII at 6·5 Å, later improved to 5·7 and 4·5 Å (Kern et al. Reference Kern, Alonso-Mori and Hellmich2012, Reference Kern, Alonso-Mori and Tran2013, Reference Kern, Tran and Alonso-Mori2014). Through the use of an optical laser it was possible to monitor the time evolution of light-dependent conformational changes in PSII using either simultaneous X-ray emission spectroscopy (Kern et al. Reference Kern, Alonso-Mori and Tran2013, Reference Kern, Tran and Alonso-Mori2014) or time-resolved crystallography (Kupitz et al. Reference Kupitz, Basu and Grotjohann2014). The latter of these experiments revealed the structure of PSII in its dark (S1) or double excited (S3) states at 5·0 and 5·5 Å, respectively.
The first novel structure to be solved by SFX was achieved by a method for crystallization termed in vivo crystallography (Koopmann et al. Reference Koopmann, Cupelli and Redecke2012). Microcrystals of Trypanosoma brucei capthesin B (TbCatB) enzyme, in its glycosylated form, were crystalized natively in insect cells. These crystals proved incredibly robust, puncturing the cellular membrane and withstanding conventional SEM and TEM imaging (Koopmann et al. Reference Koopmann, Cupelli and Redecke2012). Initial SFX studies observed diffraction out to a modest resolution of 7·5 Å. This was later improved, ultimately revealing a structure at 2·1 Å (Redecke et al. Reference Rambo and Tainer2013). This natively inhibited form of TbCatb provided important new insight into its mechanism of activation, demonstrating that SFX could be used to reveal new structural information. In vivo SFX has also been used to study crystals of an insecticidal toxin, Cry3A, found natively within Bacillus thuringiensis (Sawaya et al. Reference Saldin, Poon and Shneerson2014). Here, whole cells suspended in culture media were exposed to individual XFEL pulses without the need for crystal extraction and purification, producing a structure of the toxin in its native state, resolved to 2·9 Å.
3.3 SFX of membrane proteins
SFX has particularly benefitted membrane proteins. While membrane proteins are of significant clinical importance, accounting for roughly 60% of all current drug targets, <1% of deposited protein structures are from membrane proteins (Moraes et al. Reference Miao, Kirz and Sayre2014). New crystal delivery methods, in combination with specialized crystallization media, such as the lipidic sponge phase (LSP) and lipidic cubic phase (LCP), have been used to solve a variety of membrane protein structures by SFX. The first of these was the structure of a bacterial photosynthetic reaction center, resolved at 3·5 Å from microcrystals produced in LSP (Johansson et al. Reference Jones, Dearnley and van Riessen2013). The method was adapted for use with LCP, which has a much higher viscosity, through an adapted liquid jet injector that operates at much higher pressures, up to 68 MPa (Weierstall et al. Reference Usón and Sheldrick2014). This system was subsequently used to solve the structure of several important transmembrane receptors, bound or unbound to their respective ligand. These include the G-protein-couple receptors (GPCR) 5 – HT2B at 2·8 Å (Liu et al. Reference Liu, Wacker and Gati2013), Rhodopsin with bound arrestin at ~3·8 Å (Kang et al. Reference Kang, Zhou and Gao2015), the angiotensin II receptor at 2·9 Å (Zhang et al. Reference Zhang, Unal and Gati2015) and the human δ-opioid receptor at 2·7 Å (Fenalti et al. Reference Fienup2015).
3.4 Sample delivery methods in SFX
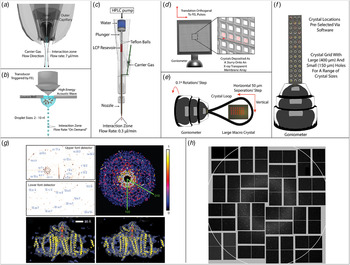
The success of SFX has required the development of new sample delivery devices such that a continuous stream of fresh protein crystals is supplied to destructive X-ray pulses (Fig. 6). In this way, it can be assured that each new X-ray pulse encounters an un-exposed crystal. Due to the high repetition rate of XFELs, and the even higher repetition rate projected for future sources, the most efficient method of delivering fresh sample has been an area of intensive research. These systems can broadly be separated into two distinct categories; flow-based systems, whereby samples move freely in a media that is continuously moving through the XFEL interaction zone, and fixed-target systems, in which samples are mounted on a substrate and moved relative to the XFEL pulses.
Sample delivery methods for SFX. Flow-based sample delivery methods. (a) GVDN delivering crystals immersed in solution (Weierstall et al. Reference Weierstall, Spence and Doak2012). (b) Droplet stream produced by acoustic droplet ejection (Roessler et al. Reference Roessler, Kuczewski and Stearns2013). (c) LCP injector for delivering crystals immersed in viscous media (Weierstall et al. Reference Usón and Sheldrick2014). Fixed-target-based sample delivery methods. (d) Large, multi-window, Si3N4 membrane array with close-up (inset) illustrating raster scan procedure on individual windows (Hunter et al. Reference Hura, Menon and Hammel2014). (e) Traditional goniometer-based setup for radiation damage-free investigation of large crystals, red circles indicate XFEL exposure sites (Hirata et al. Reference Hooke2014). (f) Goniometer mounted grid for high-density sample mounting (Cohen et al. Reference Cohen, Soltis and González2014). (g) Sample diffraction patterns (top left) and assembled patterns (top right) captured from nanocrystals of photosystem I. 8·5 Å density map of photosystem I calculated from room temperature SFX data (bottom left) and cryo-protected synchrotron data (bottom right). Adapted by permission from Macmillan Publishers Ltd.: Nature (Chapman et al. Reference Chapman, Fromme and Barty2011), copyright (2011). (h) Typical single-shot diffraction pattern from REP24 crystals mounted on Si3N4 membranes in Paratone-N. Adapted by permission from Macmillan Publishers Ltd: Scientific Reports (Hunter et al. Reference Hura, Menon and Hammel2014), copyright (2014).

3.4.1 Flow-based systems
Early experiments relied on a liquid jet injector equipped with a GDVN (Weierstall et al. Reference Weierstall, Spence and Doak2012). The GDVN can produce liquid steams between 300 and 5 µm wide and ensures that crystals remain fully solvated throughout the complete exposure. However, in this delivery strategy many of the crystals pass through the interaction zone without being exposed to the XFEL pulse (Chapman et al. Reference Chapman, Fromme and Barty2011). The high rate of sample consumption by GDVN-like devices limits the solution of novel structures from samples that cannot produce high titers of nano/microcrystals.
New instruments for sample delivery attempt to reduce sample consumption and improve hit rates by creating crystal jets with highly viscous liquids. This is convenient for membrane protein crystals already grown in or compatible with LCP (Weierstall et al. Reference Usón and Sheldrick2014). Where LCP is not necessary or compatible, a generic grease matrix can be used (Sugahara et al. Reference Spence, Weierstall and Chapman2015). This strategy reduces flow rates by an order of magnitude and improves crystal hit rates from 0·1 to ~7·8% in the case of the LCP injector (Weierstall et al. Reference Usón and Sheldrick2014). Other approaches being explored include electrospinning liquid jets (Sierra et al. Reference Sierra, Laksmono and Kern2012), and encapsulating crystals in droplets produced by acoustic droplet injection. In this last strategy, the production of droplets can be synchronized with the repetition rate of XFEL pulses (Roessler et al. Reference Roessler, Kuczewski and Stearns2013) to further minimize sample consumption.
3.4.2 Fixed-target systems and goniometers
A goniometer-based approach adapted from synchrotron crystallography experiments, holds crystals on a solid mount, so that their orientation can be controlled (Fig. 6). This method allows investigation of crystals in a wide variety of crystallization conditions with a hit rate near 100%. Using this approach, data can be measured from a single crystal with a known experimental geometry, limiting ambiguities that may arise with snapshots of randomly orientated crystals. Large macroscopic crystals mounted at cryogenic temperatures can be interrogated by short XFEL pulses to study the radiation-sensitive active site of proteins (Hirata et al. Reference Hooke2014). By raster scanning the crystal with a step size that is larger than the propagation of damage induced by individual XFEL pulses (~50 µm), the structure of cytochrome c oxidase has been resolved in its oxidized form with a resolution of 1·9 Å (Hirata et al. Reference Hooke2014).
Other goniometer-based approaches include the incorporation of gridded crystal mounts currently used in microfocus X-ray crystallography beamlines (Baxter et al. Reference Baxter, Aguila and Alonso-Mori2016; Cohen et al. Reference Cohen, Soltis and González2014; Lyubimov et al. Reference Lyubimov, Murray and Koehl2015; Sherrell et al. Reference Shapiro, Thibault and Beetz2015), and an emulsion-based microfluidics chip that acts as both a sample mount and a crystallization platform (Feld et al. Reference Fenalti, Zatsepin and Betti2015). Alternative approaches involve the use of X-ray transparent substrates, such as Si3N4 membranes, as crystal mounts. Nanocrystals are dispersed onto several nm thick Si3N4 membranes in random orientations, suspended in paratone-N to prevent dehydration (Hunter et al. Reference Hura, Menon and Hammel2014). Prepared membranes can be raster scanned along the XFEL beam path at a data acquisition rate of 10 Hz. This technique has also been adopted for the study of 2D crystals, typically studied by electron diffraction. Here protein crystals were embedded in sugar (2% sucrose) to prevent dehydration, and a resolution of 8 Å was achieved (Hunter et al. Reference Hura, Menon and Hammel2014) (Fig. 6).
3.5 Phasing in SFX
Several previously unknown structures have been solved by SFX; their solutions relied upon molecular replacement for phasing. De novo phasing of protein structures has also been demonstrated using SFX (Barends et al. Reference Barends, Foucar and Botha2014). In this study, crystals of a lysozyme derivative with two heavy atoms (gadolinium) per asymmetric unit were used to solve a 2·1 Å structure of the protein by likelihood SAD phasing. Due to the technical limitations of data reduction in SFX, the strength of the anomalous signal from the heavy atoms was dampened. High demands are placed on the number and quality of measured patterns for experimental phasing by SFX (Kirian et al. Reference Kirian, Wang and Weierstall2010; White et al. Reference White, Kirian and Martin2012). Several approaches have been introduced to improve the accuracy of pattern indexing, thereby reducing the overall demand on data quantity. These include using pairwise correlation and means clustering of patterns (Hattne et al. Reference Hémonnot, Reinhardt and Saldanha2014), an expectation maximization approach (Liu & Spence, Reference Liu and Spence2014), and post-processing techniques that have bolstered data statistics and revised the partiality model used for peak integration, improving phasing power (Ginn et al. Reference Grishaev, Ying, Canny, Pardi and Bax2015; Uervirojnangkoorn et al. Reference Uervirojnangkoorn, Zeldin and Lyubimov2015).
3.5.1 Extensions of traditional phasing
The feasibility of sulfur/chlorine single-wavelength anomalous dispersion (SAD) phasing was first observed from a large dataset taken from over 400 000 microcrystals of lysozyme, solved to 3·2 Å at SACLA (Barends et al. Reference Barends, Foucar and Shoeman2013). Whilst several peaks were located within the calculated difference maps, it was noted that they were much weaker than expected when compared with conventional synchrotron data, which was hypothesized to be caused by the shot-to-shot variation of FEL beam properties (Barends et al. Reference Barends, Foucar and Shoeman2013). In this experiment, the strength of the anomalous signal was not sufficient to solve the structure by SAD phasing alone. A structure of lysozyme would later be solved to 2·0 Å using the anomalous signal from 10 cysteine residues and one chlorine (Nakane et al. Reference Nakane, Song and Suzuki2015). The data were collected at 7 keV at SACLA and over 150 000 patterns were indexed to compute the final structure. It was noted that when the data were truncated to a similar resolution as that obtained by Barends et al., SAD phasing failed, suggesting that high data redundancy at resolutions better than 2·7 Å may be necessary for phasing at XFELs.
The large number of patterns required for phasing led researchers to combine the phasing power of multiple strategies through single isomorphous replacement with anomalous scattering (SIRAS). Microcrystals of luciferin-regenerating enzyme were solved when derivatized with Hg (Yamashita et al. Reference Yamashita, Pan and Okuda2015). Data were collected from both the native and derivative crystals at 12·6 keV (near the LIII edge of Hg) at SACLA. The structure was solved via SIRAS using just 20 000 indexed patterns, 10 000 from each native and derivative. SAD phasing alone failed with over 80 000 patterns from the same dataset, suggesting this hybrid method to be more effective for SFX phasing than SAD alone (Yamashita et al. Reference Yamashita, Pan and Okuda2015).
3.5.2 Novel phasing methods at XFEL
XFELs also present the opportunity for new solutions to the phase problem in crystallography. As noted in our section on CDI, when small crystals are illuminated by coherent XFEL pulses, it is possible to measure intensity between the Bragg peaks (Miao & Sayre, Reference Miao and Sayre2000; Chapman et al. Reference Chapman, Fromme and Barty2011). Provided the dynamic range of the detection apparatus is large enough to record both peaks and weakly scattered signals, this approach can allow direct phasing using oversampling techniques that exploit knowledge of the shape transform embedded in the patterns (Miao & Sayre, Reference Miao and Sayre2000; Spence et al. Reference Spence, Kirian and Wang2011). This can be extracted using the gradients of diffraction intensities surrounding the Bragg peaks (Chen et al. Reference Chen, Spence and Millane2014; Elser, Reference Emma, Akre and Arthur2013) or by decoupling the unit cell transform from the reciprocal lattice transform (Kirian et al. Reference Kirian, Bean and Beyerlein2015). Lastly, damage induced during or after a pulse could in principle be used to phase, exploiting the contrast between the undamaged crystal and that in which radiation sensitive atoms have been stripped away (Galli et al. Reference Gerchberg and Saxton2015).
Phasing from diffuse scattering was demonstrated on small crystals with very large unit cells and proved a way to extend the resolution obtained beyond the outer most shell of Bragg reflections (Ayyer et al. Reference Ayyer, Yefanov and Oberthür2016). When individual structural units of a crystal become displaced in a particular way, it causes an attenuation of the Bragg peaks and gives rise to continuous diffraction, like that used by CDI techniques. This diffraction actually consists of the incoherent sum of all of the diffraction patterns arising from the misaligned macromolecules within the crystal, similar to the ‘speckle patterns’ observed in CDI (Ayyer et al. Reference Ayyer, Yefanov and Oberthür2016). This typically occurs at higher resolutions and can lead to loss of resolution in crystallography. This phenomenon was noted in diffraction from crystals of PSII interrogated by SFX. In that experiment, Bragg reflections extended to a resolution of 4·5 Å, while weak ‘speckle’ signal extended as far as 3·3 Å (Ayyer et al. Reference Ayyer, Yefanov and Oberthür2016). A low resolution molecular envelope was calculated based on the previously solved 4·5 Å structure. Techniques similar to those used for phase retrieval in CDI were used to extend phases beyond the Bragg reflections and into the region of continuous diffraction. The combination of crystallographic approaches and CDI techniques led to an extension of resolution to 3·5 Å. This demonstration bridges the gap between the single particle CDI technique and crystallography, in principle allowing the determination of structures at resolutions beyond the limit of their Bragg reflections.
4. SAXS and nanodiffraction
SAXS is an important tool in structural biology for macromolecules that fail to crystallize. SAXS reveals the ensemble average structure of proteins in solution (Rambo & Tainer, Reference Popmintchev, Chen and Popmintchev2010), and has a rich history as an analytic tool (Guinier, Reference Guizar-Sicairos, Diaz and Holler1938). However, it was not until the introduction of dedicated synchrotron sources that the application of SAXS to biology became widespread (Feigin et al. Reference Feld and Frank1987). As samples investigated by SAXS are free floating in solution their models represent the average of all possible conformations without atomic level detail.
4.1 SAXS: a brief introduction
A SAXS experiment involves exposing a small volume of mono-disperse protein, at a reasonable concentration, to X-rays and recording the scattered intensity over low angles (1°–5°). The resultant scattering pattern is then radially averaged to produce a 1D curve. The modest requirements on sample preparation, combined with the simplicity of its setup makes SAXS ideal for high-throughput experimentation and automation (Hura et al. Reference Ishikawa, Aoyagi and Asaka2009). SAXS is most sensitive to global features of the macromolecule under investigation, in particular; the radius of gyration (R g), a measure of the molecules overall size, the maximum intermolecular distance (D Max) and, provided suitable calibration, the molecular weight (Rambo & Tainer, Reference Priebe, Bernhardt and Blum2013). Advances in ab initio algorithms used to analyze SAXS curves have allowed fitting to move beyond simple shape functions to 3D structures. SAXS models can now be used for docking of crystal structures, through dummy atom modeling (Koch et al. Reference Koch, Vachette and Svergun2003; Koutsioubas et al. Reference Koutsioubas, Berthaud, Mangenot and Pérez2013; Petoukhov & Svergun, Reference Osten and Margrie2005; Svergun et al. Reference Starodub, Aquila and Bajt2001) in combination with molecular dynamics (Guttman et al. Reference Hantke, Hasse and Maia2013). The rapid speed at which SAXS curves can be recorded makes it ideally suited for time-resolved studies based on parameters such as temperature, pH and ligand binding (Grishaev et al. Reference Guinier2008; Konuma et al. Reference Konuma, Kimura and Matsumoto2011; Mylonas et al. Reference Moraes, Evans, Sanchez-Weatherby, Newstead and Stewart2008). The combination of SAXS and size-exclusion chromatography has allowed the complex oligomerization state of proteins in solution to be investigated (Jensen et al. Reference Jiang, Ramunno-Johnson and Song2010; Wright et al. Reference Wright, Hasnain and Grossmann2011).
4.2 SAXS/WAXS at XFEL
More recently SAXS experiments have been performed at XFELs with promising results. SAXS has been used in conjunction with single-shot CDI to provide insight on the ensemble morphology of soot particles (Loh et al. Reference Loh, Hampton and Martin2012) and RNAi microsponges (Gallagher-Jones et al. Reference Galli, Son and Barends2014) (Fig. 4b). A variation on the solution scattering method, named wide-angle X-ray scattering (WAXS) where scattering is recorded over much larger angles, has been used to monitor time-resolved protein dynamics at a much finer scale than SAXS (Cammarata et al. Reference Cammarata, Levantino and Schotte2008; Westenhoff et al. Reference Weinhausen, Nolting and Olendrowitz2010). WAXS was combined with high-flux, femtosecond XFEL pulses to capture, for the first time, snapshots of an ultrafast conformational change in a photosynthetic reaction center protein of B. viridis (RCvir), termed a ‘protein quake’ (Arnlund et al. Reference Arnlund, Johansson and Wickstrand2014). A stream of detergent solubilized RCvir molecules was injected across an XFEL beam using a GDVN. Prior to reaching the XFEL interaction zone, the liquid stream was exposed to an optical laser with varying time delay. The resulting WAXS curves were used in conjunction with MD simulations and a previously resolved crystal structure to trace the flow of heat through the protein and trace the movement of the bacterial co-factors on a ps time scale (Arnlund et al. Reference Arnlund, Johansson and Wickstrand2014).
4.3 X-ray cross-correlation analysis (XCCA)
XCCA, a novel extension of SAXS first envisioned in the 1970s, has seen a revival with the advent of XFELs. It was initially postulated that if a number of molecules could be frozen in either in time or space, then the recorded diffraction would contain snapshots of the molecule in a finite number of orientations (Kam, Reference Kam1977). With sufficient coherent illumination, the diffraction patterns contain angular fluctuations in intensity, relating to the different orientations. By averaging the angular correlations of intensity, rather than just the intensity, over multiple diffractions patterns it should be possible to recover the Fourier modulus of an individual particle, which can then be phased (Kirian et al. Reference Kirian, Schmidt, Wang, Doak and Spence2011; Saldin et al. Reference Rodriguez, Xu, Chen, Zou and Miao2010). Initial experiments proved challenging due to weak flux; however, XCCA has now been demonstrated experimentally at both synchrotrons and XFELs with material samples (Pedrini et al. Reference Neutze, Wouts, van der Spoel, Weckert and Hajdu2013; Starodub et al. Reference Song, Takagi and Park2012). This technique benefits from the increased scattering power of many particles, compared to the single-particle case (Kirian & Saldin, Reference Kirian and Saldin2013).
4.4 SAXS with focused beams: X-ray nanodiffraction
A new technique, termed X-ray nanodiffraction, is related to SAXS and has become possible in recent years thanks to the improved flux at the latest generation of synchrotron light sources. In a nanodiffraction experiment, a finely focused X-ray beam is rastered across the sample. The far-field scattered intensity is measured and the total integrated intensity of each pattern is used to compute a dark-field X-ray image. This is then combined with higher resolution information derived from SAXS analysis of the same scattering pattern (Fratzl et al. Reference Fung, Shneerson, Saldin and Ourmazd1997; Schroer et al. Reference Schroer, Kuhlmann and Roth2006; Weinhausen et al. Reference Weierstall, James and Wang2012; Wilke et al. Reference Westenhoff, Malmerberg and Arnlund2012). The combination of real and reciprocal space data greatly enhances the information that can be extracted from either measurement. This technique has now been applied to the study of cytoskeletal networks in fixed mammalian cells (Weinhausen et al. Reference Weierstall, James and Wang2012) and fully hydrated cells of Dictyostelium discoideum and SK8/18-2, both fixed and living, inside of a microfluidic chamber (Priebe et al. Reference Pfeifer, Williams, Vartanyants, Harder and Robinson2014; Weinhausen et al. Reference Weinhausen, Saldanha and Wilke2014).
This idea has been pushed even further to obtain multi-dimensional information from macroscopic objects (Liebi et al. Reference Liebi, Georgiadis and Menzel2015; Schaff et al. Reference Schaff, Bech and Zaslansky2015). For these experiments an extra rotation axis was incorporated into the experiment in addition to the tomographic axis. With this additional rotation axis, it was possible to reconstruct the 3D reciprocal volume that corresponds to a given voxel, such that for a given scan location 3D information is known in both real and reciprocal space (Schaff et al. Reference Sawaya, Cascio and Gingery2015). Fitting a model to the 3D scattering volume within a given voxel then gives information about the underlying structure at a higher resolution than the voxel itself. This technique was employed to analyze the distribution and orientation of collagen fibrils within bone and teeth spanning length scales from several millimeters to several tens of nanometers (Liebi et al. Reference Liebi, Georgiadis and Menzel2015; Schaff et al. Reference Sawaya, Cascio and Gingery2015).
5. Future directions
The frontier X-ray diffraction methods outlined in this review promise to reveal cellular and molecular structures with high resolution at ultra-fast timescales. Several landmark studies have demonstrated the utility of these methods. Although the breadth of studies is extensive, we attempt to highlight a few examples that offer perspective on the emergence and evolution of the techniques. CDI and SFX have now gone beyond the realms of proof-of-concept experiments and towards an experimental tool for solving real-world problems. This is due to the development of dedicated instruments as well as the streamlining of reconstructions for the novice user.
Single-particle imaging is under development at a number of XFELs. There are now several focus groups established with the aim of improving single-shot imaging with XFELs to near atomic resolutions and a roadmap has been established (Aquila et al. Reference Aquila, Barty and Bostedt2015). With the concerted effort of multiple institutions spanning many disciplines, it is hoped that this goal can be achieved in the future. Alongside these efforts, techniques that could enhance the ability to detect signal from weakly scattering objects are also being actively explored (Kim et al. Reference Kim, Kim and Song2014; Takayama et al. Reference Sugahara, Mizohata and Nango2015). Labeling strategies may soon help reveal meaningful molecular detail in a cellular context; this is now also becoming possible using hybrid techniques with unlabeled samples (Hémonnot et al. Reference Hendrickson2016). High-throughput strategies now allow rapid characterization of subcellular compartments or macromolecular assemblies, particularly those with high symmetry. With these gains, the holy grail of diffractive imaging, molecular movies, can potentially become a reality.
Ultimately, CDI must meet the needs of user communities. These needs will guide the development of future tools and algorithms as well as the widespread use of existing techniques. Mainstay experiments may include: (i) the routine 3D investigation of frozen-hydrated cells with high spatial resolution; (ii) structural studies of living cells correlated with complementary optical imaging methods; (iii) the exploration of heterogeneous macromolecular mixtures in high-throughput fashion; (iv) 3D investigation of macromolecular assemblies and ultimately single molecules at near atomic resolution; and (v) time-resolved single-particle imaging of macromolecules. New sources and dedicated instruments are needed to make these goals a reality; many are currently under development and will soon come online (Table 1). Crystallography and X-ray diffraction have facilitated some of the greatest biological discoveries of the past century. CDI and its variants are poised to supply new techniques for the next century of X-ray diffraction, with the hope of fueling a new era of biological and chemical discovery.
Acknowledgements
This work was supported by the DARPA PULSE program through a grant from AMRDEC and the National Science Foundation (DMR-1548924). J.M. thanks the support by the Office of Basic Energy Sciences of the US Department of Energy (grant no. DE-SC0010378) and the National Science Foundation (grant no. DMR-1437263). J.A.R. acknowledges the support of the A.P. Giannini postdoctoral fellowship.