Introduction
Nanoparticles often have properties different from their bulk counterparts, and novel nanoparticle synthetic techniques have created unique materials for new applications. For example, nanoparticle systems, such as fluorescing quantum dots or photovoltaic semiconductors with tunable band gaps, demonstrate quantum effects on a macroscopic scale [Reference Heath, Shiang and Alivisatos1, Reference Alivisatos2, Reference Dou, Wong, Yu, Lai, Kornienko, Eaton, Fu, Bischak, Ma and Ding3]. Other useful properties of nanoparticles include their high surface-area-to-volume ratio, which has a wide range of applications in heterogeneous catalysis [Reference Huang, Schliesser, Olsen, Smith and Woodfield4]. Significant progress has been made in studying the physics, chemistry, and stability of the surfaces of nanoparticles to gain more knowledge about their potential uses.
Most metal oxides can be synthesized as nanoparticles, and several of these oxides exist in a variety of crystalline polymorphs, many with unique properties. For example, γ-Al2O3 nanoparticles are excellent catalyst supports due to large surface area, large pore volume, and moderate to high acid site concentration [Reference Trueba and Trasatti5], while the thermally stable α-Al2O3 nanoparticles with little porosity are less favorable as catalyst supports but have applications in the ceramics industry [Reference Rahmati, Huang, Mortensen, Keyvanloo, Fletcher, Woodfield, Hecker and Argyle6]. Synthesizing and characterizing metal oxide nanoparticles for new applications is an active area of research, and progress has been made to fine-tune their properties and make their syntheses more environmentally friendly [Reference Smith, Huang, Liu, Liu, Olsen, Boerio-Goates and Woodfield7, Reference Olsen, Bartholomew, Huang, Simmons and Woodfield8, Reference Mardkhe, Huang, Bartholomew, Alam and Woodfield9, Reference Huang, Bartholomew, Smith and Woodfield10].
Metal oxide nanoparticles are often highly hygroscopic with water contents as high as 20% by weight (estimated relative humidity 35–50%) [Reference Calvin, Asplund, Zhang, Huang and Woodfield11, Reference Calvin, Asplund, Zhang, Huang and Woodfield12, Reference Asplund, Calvin, Zhang, Huang and Woodfield13, Reference Spencer, Huang, Parker, Kolesnikov, Ross and Woodfield14]. Most of the water in these materials is bound to the surface, and the interactions between water molecules and the surface are important for phase and thermal stability. This is especially important because increased thermal stability of metal oxide nanoparticles—especially for metastable transitional phases—is desirable for many of their applications. For example, one interesting feature of the phases of titania is that while rutile is the more stable bulk phase [Reference Navrotsky and Kleppa15, Reference Smith, Stevens, Liu, Li, Navrotsky, Boerio-Goates and Woodfield16], anatase is the more stable nanophase and has increased catalytic activity [Reference Levchenko, Li, Boerio-Goates, Woodfield and Navrotsky17]. Another example is the stability of γ-Al2O3 relative to α-Al2O3 at the nanoscale [Reference McHale, Auroux, Perrotta and Navrotsky18]. Surface water interactions affect the stability of these nanoparticles, and without them, nanoparticle structures may transform to coarser phases that are less favorable for catalytic applications [Reference McHale, Auroux, Perrotta and Navrotsky18, Reference McHale, Navrotsky and Perrotta19].
Water adsorbed to the surface of nanoparticles can be categorized as physisorbed or chemisorbed [Reference Calvin, Asplund, Zhang, Huang and Woodfield11, Reference Asplund, Calvin, Zhang, Huang and Woodfield13]. Physisorbed water is loosely bound and mobile, with energetics similar to that of bulk liquid water, while chemisorbed water is chemically bound to the surface to varying degrees, often with dissociation into hydroxyl groups, which stabilizes the energetics of the surface and lowers the water mobility. Since the physisorbed water does not interact strongly with the surface of the material, it can be removed easily to study the effects of chemisorbed water. Typically, physisorbed water is removed by heating the sample at a relatively low temperature (generally below 473–573 K) for several hours under a flow of an inert gas so only the tightly bound water remains [Reference Calvin, Asplund, Zhang, Huang and Woodfield11, Reference Asplund, Calvin, Zhang, Huang and Woodfield13]. Some amount of chemisorbed water can also be removed by heating samples at higher temperatures, but not all of the water can be removed from most metal oxide nanoparticle surfaces without coarsening [Reference Levchenko, Li, Boerio-Goates, Woodfield and Navrotsky17, Reference Wang, Wesolowski, Proffen, Vlcek, Wang, Allard, Kolesnikov, Feygenson, Anovitz and Paul20] and possible phase transformation. The total amount of water on the surface is typically quantified by thermogravimetric analysis (TGA) [Reference Calvin, Asplund, Zhang, Huang and Woodfield11, Reference Calvin, Asplund, Zhang, Huang and Woodfield12, Reference Asplund, Calvin, Zhang, Huang and Woodfield13, Reference Spencer, Huang, Parker, Kolesnikov, Ross and Woodfield14, Reference Navrotsky and Kleppa15, Reference Smith, Stevens, Liu, Li, Navrotsky, Boerio-Goates and Woodfield16, Reference Levchenko, Li, Boerio-Goates, Woodfield and Navrotsky17].
Water adsorption microcalorimetry, low-temperature heat capacity calorimetry, and inelastic neutron scattering (INS) have been used to study adsorbed water on the surfaces of metal oxide nanoparticles. In this review, results and conclusions drawn from these investigations will be discussed, including some recent findings. Additional insight from other studies will also be discussed. While the behavior of water on the surface of different metal oxides can vary, some general conclusions can be drawn. Each investigative method reveals unique information about the interactions of surface water and will be discussed separately. The insights gained by each method are complementary, and combining them leads to a more comprehensive picture of water interactions, which will be discussed. Additional methods, such as molecular dynamics (MD) and density functional theory (DFT) simulations, will also be examined. While many measurements using these techniques, particularly water adsorption microcalorimetry, have been performed on a wide variety of metal oxide nanoparticles, this review will focus on TiO2, SnO2, and Al2O3, as they are among some of the most commercially important materials, and they have been studied by all of these techniques using the same suite of samples. Previous reviews have been published, including one focusing almost exclusively on titania [Reference Navrotsky21] and another discussing surface energy and enthalpy of a variety of metal oxides, including alumina and titania [Reference Navrotsky22]. Complementing these earlier reviews, this review will focus on the combined results of the adsorption calorimetry, heat capacity, and INS results as applied to well-defined nanoscale metal oxide systems to provide a review of our understanding of water adsorption on metal oxide nanoparticle surfaces.
Water adsorption microcalorimetry and high-temperature oxide melt solution calorimetry
Water adsorption microcalorimetry [Reference Ushakov and Navrotsky23, Reference Drazin and Castro24, Reference Castro and Quach25] is an essential technique to determine the heat released when water binds to the surface of a material and can be used to investigate how tightly water is bound to the surfaces of metal oxide nanoparticles. In this technique, a small amount of sample is dehydrated by heating under vacuum and then is kept in a water-free glove box until the sample is measured. Care must be taken during the dehydration process since coarsening can occur if the sample is dried at too high a temperature, and transferring the sample from the glove box to the calorimeter must be done quickly to prevent water adsorption outside the calorimeter. The calorimeter is connected to a gas dosing system, which introduces a known amount of water vapor to the sample, and the heat of adsorption is measured by the calorimeter.
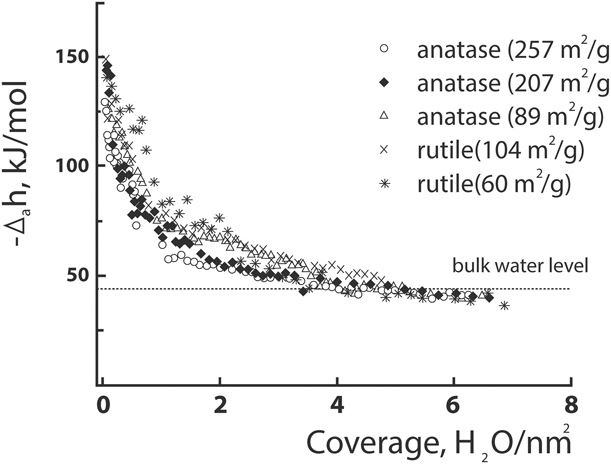
Water adsorption microcalorimetry was used to investigate titania, which exists in three polymorphs: rutile, anatase, and brookite [Reference Levchenko, Li, Boerio-Goates, Woodfield and Navrotsky17, Reference Boerio-Goates, Li, Li, Walker, Parry and Woodfield26, Reference Levchenko, Kolesnikov, Ross, Boerio-Goates, Woodfield, Li and Navrotsky27, Reference Boerio-Goates, Smith, Liu, Lang, Li, Woodfield and Navrotsky28, Reference Schliesser, Smith, Li, Li, Walker, Parry, Boerio-Goates and Woodfield29, Reference Schliesser, Smith, Li, Li, Walker, Parry, Boerio-Goates and Woodfield30]. The heat of adsorption is highly exothermic (the initial enthalpy of adsorption near zero coverage is more negative than −120 kJ/mol) for both rutile and anatase, but rutile adsorbs more water. The measured adsorption is approximately 0.5 mol H2O/nm2 for rutile and 0.25 mol H2O/nm2 for anatase [Reference Levchenko, Li, Boerio-Goates, Woodfield and Navrotsky17]. However, subsequent water adsorption with additional water is much less exothermic, and the total integral of the adsorption enthalpy is −84 kJ/mol for rutile and −62 kJ/mol for anatase, with an uncertainty of ±3 kJ/mol, as depicted in Fig. 1. These results indicate that nanophase rutile has more high energy binding sites than does anatase, and it binds water more tightly than anatase overall [Reference Levchenko, Li, Boerio-Goates, Woodfield and Navrotsky17]. The exothermic energies of adsorption also show that water adsorption increases the stability of the particles, which explains why coarsening occurs only when the chemisorbed water is removed [Reference Levchenko, Li, Boerio-Goates, Woodfield and Navrotsky17].
Differential heats of H2O adsorption for anatase with surface areas of 89, 207, and 257 m2/g and for rutile with surface areas of 60 and 104 m2/g. Reprinted with permission from Levchenko et al. [Reference Levchenko, Li, Boerio-Goates, Woodfield and Navrotsky17]. Copyright 2006 American Chemical Society.

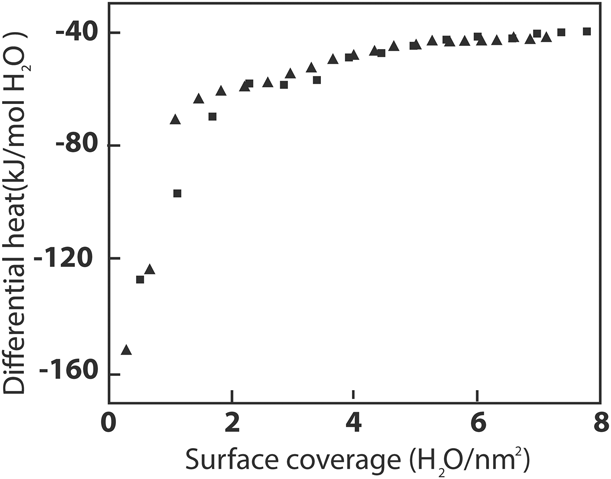
A water adsorption calorimetry study performed on the cassiterite phase of SnO2 also reveals highly exothermic adsorption enthalpies for samples with low water coverage and less exothermic adsorption enthalpies as more water is added [Reference Ma, Castro, Zhou and Navrotsky31]. As shown in Fig. 2, the first dose of water gives a coverage that is only 0.2 mol H2O/nm2 and an adsorption enthalpy of less than −125 kJ/mol, while the overall integral enthalpy is −75 kJ/mol [Reference Ma, Castro, Zhou and Navrotsky31]. This implies that cassiterite’s surface energy is less than that of rutile but greater than that of anatase. However, anatase has an increased amount of chemisorbed water than cassiterite and thus has more high-energy binding sites. This lower affinity for water helps explain why cassiterite is a better material for gas sensing purposes, as water does not interfere with binding of other molecules on cassiterite as much as it does on the TiO2 phases [Reference Ma, Castro, Zhou and Navrotsky31].
Differential enthalpy of H2O adsorption on the surface of SnO2 nanoparticles versus water coverage. The surface area of the two runs was 69 m2/g and 72 m2/g, from Ma et al. [Reference Ma, Castro, Zhou and Navrotsky31].

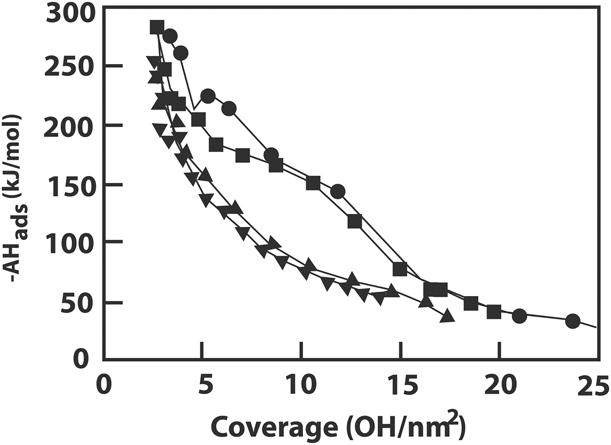
Water adsorption calorimetry studies were also performed on γ and α phases of alumina nanoparticles [Reference McHale, Auroux, Perrotta and Navrotsky18, Reference McHale, Navrotsky and Perrotta19]. The integral enthalpy of adsorption of water on the surfaces of nanoparticles is −164 kJ/mol and −123 kJ/mol for the α phase and γ phase, respectively, and adsorption enthalpies are more exothermic than −150 kJ/mol for the first 10 OH/nm2 for the α phase and the first 5 OH/nm2 for the γ phase, as shown in Fig. 3 [Reference McHale, Auroux, Perrotta and Navrotsky18]. The use of OH in the units reflects the dissociative bonding on alumina surfaces where the first layers of water dissociate into hydroxyls, as evidenced through INS measurements that will be discussed below. An additional surface energy study was performed on γ-alumina doped with 5% magnesium and 2% zinc, and these dopants lower the surface energy of the alumina [Reference Castro, Ushakov, Gengembre, Gouvêa and Navrotsky32]. Comparisons show that relative to titania and cassiterite, alumina binds water most strongly and has the most energetic surfaces.
Differential heats of chemisorption of H2O on α-Al2O3 [36 m2/g (circles), 61 m2/g (squares)] and γ-Al2O3 [72 m2/g (triangles), 161 m2/g (inverted triangles)] as a function of hydroxyl coverage, from McHale et al. [Reference McHale, Auroux, Perrotta and Navrotsky18].

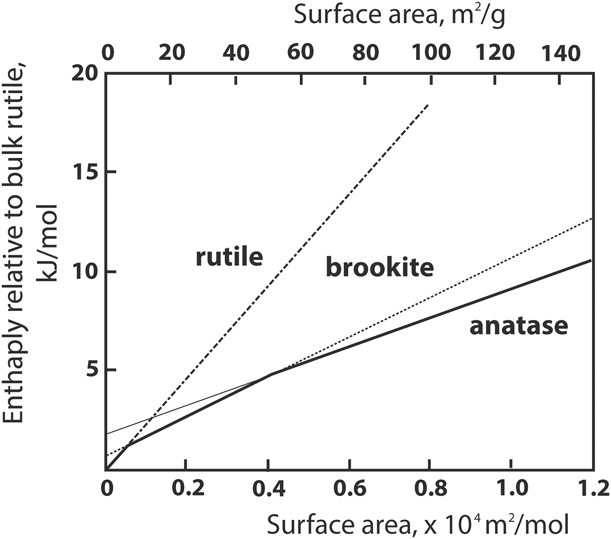
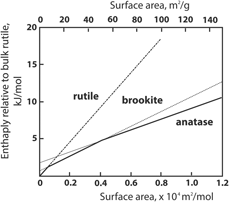
To provide further insight, high-temperature oxide melt solution calorimetry has been used to obtain information on the surface energy of hydrated and anhydrous surfaces [Reference Navrotsky21, Reference Navrotsky22]. To measure the enthalpy, a sample is dropped into a high-temperature molten oxide solvent in a Calvet microcalorimeter, and heat flow between the sample chamber and the large metal block surrounding the thermopile used as a heat sink is measured [Reference Navrotsky33, Reference Navrotsky34, Reference Navrotsky35]. Differences in the enthalpy measured for nanoparticles of different sizes depend both on the surface area of the material and on the release of adsorbed water during dissolution. Using these methods, the surface energy and the enthalpy of transformation between different phases of materials, such as for titania (Fig. 4) or alumina, can be calculated [Reference Levchenko, Li, Boerio-Goates, Woodfield and Navrotsky17, Reference McHale, Auroux, Perrotta and Navrotsky18]. Combining the results of oxide melt solution calorimetry and water adsorption calorimetry enables one to calculate the energy of both the hydrated and anhydrous surfaces [Reference McHale, Auroux, Perrotta and Navrotsky18].
Energetics of nanotitania. Solid line shows energetic stability regions of different phases (brookite data from Ranade et al. [Reference Ranade, Navrotsky, Zhang, Banfield, Elder, Zaban, Borse, Kulkarni, Doran and Whitfield36]). Reprinted with permission from Levchenko et al. Copyright 2006 American Chemical Society.

Such combined experiments showed that while rutile is the thermodynamically stable bulk phase of titania, as surface area increases, brookite becomes the thermodynamically stable phase with surface areas above 7 m2/g, and anatase becomes the stable phase for surface areas greater than 50 m2/g (Fig. 4) [Reference Levchenko, Li, Boerio-Goates, Woodfield and Navrotsky17, Reference Ranade, Navrotsky, Zhang, Banfield, Elder, Zaban, Borse, Kulkarni, Doran and Whitfield36]. Furthermore, oxide melt solution calorimetry has shown that the surface energy of rutile is greater than that of anatase [Reference Navrotsky22, Reference Ranade, Navrotsky, Zhang, Banfield, Elder, Zaban, Borse, Kulkarni, Doran and Whitfield36], consistent with the water adsorption calorimetry measurements that found that overall, water is bound to rutile more tightly [Reference Levchenko, Li, Boerio-Goates, Woodfield and Navrotsky17]. Oxide melt calorimetry studies on cassiterite showed that the surface energy of anhydrous cassiterite is greater than that of hydrated cassiterite, providing further evidence that water has a stabilizing effect on nanoparticle surfaces [Reference Ma, Castro, Zhou and Navrotsky31]. Similar measurements on alumina showed that α-alumina had a higher surface energy than γ-alumina, with γ-alumina becoming the more stable phase at surface areas greater than 125 ± 10 m2/g [Reference McHale, Auroux, Perrotta and Navrotsky18].
When considered together, water adsorption microcalorimetry and oxide melt calorimetry studies provide a solid foundation for understanding the properties of surface water on metal oxide nanoparticles. Not only do these studies provide compelling evidence of the stabilizing nature of surface water, but they provide key insights into the reversal of phase stability with increasing surface area (decreasing particle size). Another key insight is that chemisorbed water and physisorbed water have different enthalpies of adsorption, suggesting that there are fundamental differences in the behavior of surface water as coverage increases.
Low-temperature specific heat calorimetry
Heat capacity at constant pressure is defined as the temperature derivative of the enthalpy and is often measured as a function of temperature from low temperatures near absolute zero to room temperature and above [Reference White and Collocott37]. Above 20 K, the heat capacity is dominated by the lattice vibrations, but below 20 K, additional contributions such as electronic and magnetic contributions can also be extracted [Reference Gopal38]. Heat capacity measurements to low temperature also enable the calculation of the absolute entropy via the following equation [Reference Gopal38].
 $$S\left( T \right) = \int_0^T {{{{C_{\rm{p}}}{\rm{d}}T} \over T}} \quad .$$
Combining enthalpy data with entropy data obtained via low-temperature heat capacity measurements, the complete free energy landscape of a process or material can be determined [Reference Calvin, Asplund, Akimbekov, Ayoub, Katsenis, Navrotsky, Friščić and Woodfield39]. In addition to absolute entropies, heat capacity measurements can also yield enthalpy temperature increments and the heat capacity at low temperatures can be compared to theoretical models to provide molecular-level insight into the intrinsic properties of materials. For the purposes of studying surface water interactions on metal oxides, heat capacity measurements can indicate the strength of bonds, since materials with stronger inter- or intramolecular bonds become vibrationally excited at higher temperatures, resulting in lower heat capacities than materials with weaker bonding [Reference Boerio-Goates, Li, Li, Walker, Parry and Woodfield26].
Early studies on inadequately characterized metal oxide nanoparticles suggested that nanophase materials had higher heat capacities than their bulk counterparts [Reference Boerio-Goates, Li, Li, Walker, Parry and Woodfield26]. Initially, this observation led some to believe that increasing the surface area of a material significantly weakened the bonding in the lattice, perhaps creating incomplete bonding or “dangling bonds” at the surface. To further explore the apparent increase in heat capacity at the nanoscale, low-temperature heat capacity measurements were performed on a series of 8-nm rutile and anatase TiO2 with well characterized, varying water contents. More complete characterizations showed that there is a large amount of water adsorbed to nanophase TiO2 surfaces [Reference Levchenko, Li, Boerio-Goates, Woodfield and Navrotsky17, Reference Boerio-Goates, Li, Li, Walker, Parry and Woodfield26, Reference Levchenko, Kolesnikov, Ross, Boerio-Goates, Woodfield, Li and Navrotsky27, Reference Schliesser, Smith, Li, Li, Walker, Parry, Boerio-Goates and Woodfield29, Reference Schliesser, Smith, Li, Li, Walker, Parry, Boerio-Goates and Woodfield30], some of which could be removed without affecting the lattice by calcining at 373 K for increasing amounts of time (2, 4, and 6 h) [Reference Boerio-Goates, Li, Li, Walker, Parry and Woodfield26, Reference Schliesser, Smith, Li, Li, Walker, Parry, Boerio-Goates and Woodfield29, Reference Schliesser, Smith, Li, Li, Walker, Parry, Boerio-Goates and Woodfield30]. The heat capacities of these different samples were measured and compared.
By successively subtracting the measured heat capacities with different water contents and correcting for the moles of water on the surface, the molar heat capacities of the subtracted water were determined. In describing their results, these studies refer to adsorbed water as forming “inner” and “outer” layers, but this terminology can be misleading. Although the “inner” and “outer” layers do exhibit distinctive properties, they were distinguished only by the removal of different amounts of water. As such, these “layers” should be viewed as useful reference points rather than two distinct, concentric physical water layers formed on nanoparticle surfaces. For clarity, the reported “inner” and “outer” layers will be referred to as chemisorbed and physisorbed water, respectively.
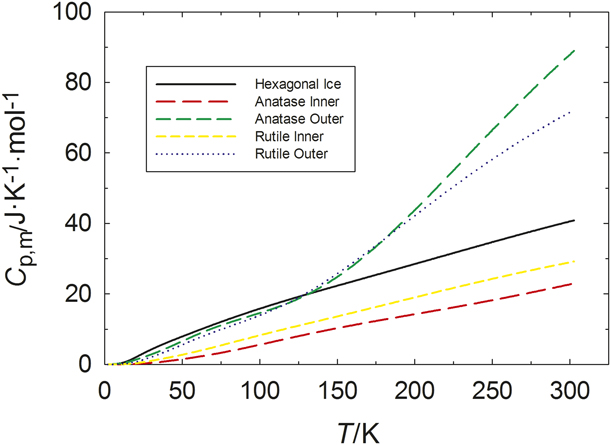
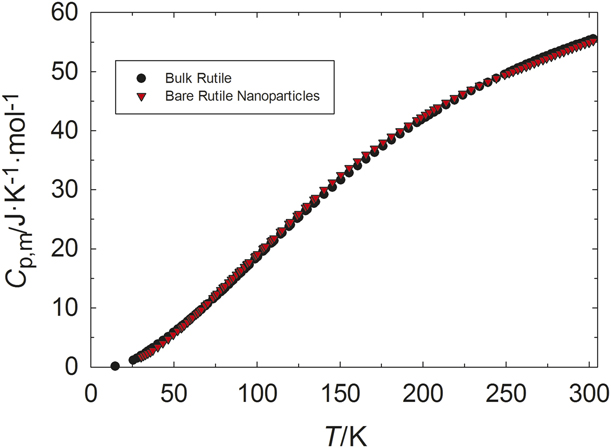
The results clearly show that the surface water on the samples with lower coverage has a lower molar heat capacity, providing further evidence that the water closer to the titania surface is more tightly bound (chemisorbed) and therefore does not have the same dynamics of more loosely bound, physisorbed water [Reference Boerio-Goates, Li, Li, Walker, Parry and Woodfield26, Reference Schliesser, Smith, Li, Li, Walker, Parry, Boerio-Goates and Woodfield29, Reference Schliesser, Smith, Li, Li, Walker, Parry, Boerio-Goates and Woodfield30]. The calculated heat capacities for the chemisorbed and physisorbed water are shown in Fig. 5 and compared to hexagonal ice [Reference Smith, Lang, Liu, Boerio-Goates and Woodfield40]. The heat capacity of the physisorbed water is greater than that of hexagonal ice. Additionally, there is a transition near 150 K in the heat capacity of the physisorbed water, indicating that it becomes more mobile on the surface of the nanoparticles at higher temperatures, and the broadness of this transition suggests that it is a gradual process [Reference Boerio-Goates, Li, Li, Walker, Parry and Woodfield26]. With the heat capacity of adsorbed water known, the heat capacity of the anhydrous rutile lattice was calculated by subtracting the contribution from the chemisorbed and physisorbed water and the heat capacity of the “bare” rutile nanoparticle lattice is the same as that of the bulk rutile phase within experimental error, as shown in Fig. 6 [Reference Boerio-Goates, Li, Li, Walker, Parry and Woodfield26]. Anatase gave similar results. Thus, the earlier findings of an apparently higher heat capacity at the nanoscale [Reference Lu41, Reference Zhang and Banfield42] must be attributed to the presence of water not accounted for in those studies.
Molar heat capacity as a function of temperature as determined by low-temperature calorimetry for different layers of water on different phases of titania nanoparticles. Data previously published by Schliesser et al. [Reference Schliesser, Smith, Li, Li, Walker, Parry, Boerio-Goates and Woodfield29] and Schliesser et al. [Reference Schliesser, Smith, Li, Li, Walker, Parry, Boerio-Goates and Woodfield30].

Specific heat of “bare” (anhydrous) rutile nanoparticles calculated through successive subtractions compared to rutile bulk. Data previously published in Boerio-Goates et al. [Reference Boerio-Goates, Li, Li, Walker, Parry and Woodfield26].

The low-temperature heat capacity of chemisorbed water on anatase is lower than that of rutile, suggesting that the water on anatase is more tightly bound [Reference Boerio-Goates, Li, Li, Walker, Parry and Woodfield26, Reference Schliesser, Smith, Li, Li, Walker, Parry, Boerio-Goates and Woodfield29, Reference Schliesser, Smith, Li, Li, Walker, Parry, Boerio-Goates and Woodfield30]. However, the study by Levchenko et al. [Reference Levchenko, Li, Boerio-Goates, Woodfield and Navrotsky17] concluded that rutile has a higher surface energy than anatase and that the water adsorption on the surface is more exothermic, suggesting that water on the rutile surface is more tightly bound than that on anatase. Currently, there is no clear explanation for this apparent contradiction.
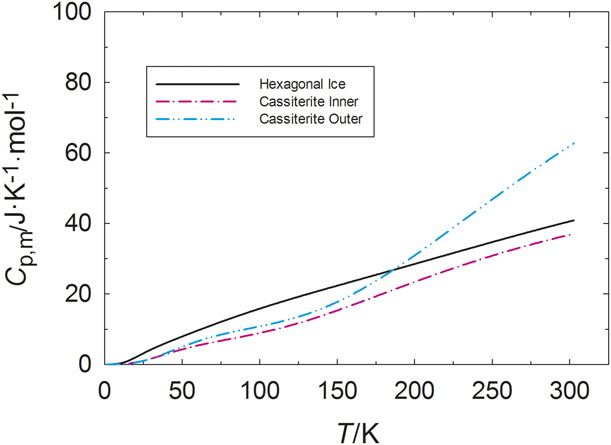
Heat capacity measurements were also used to study the behavior of adsorbed water on cassiterite SnO2 nanoparticles. Low-temperature heat capacity measurements probed three different SnO2 samples with varying amounts of water, and the heat capacity of the adsorbed water on their surfaces was calculated and compared to hexagonal ice, as shown in Fig. 7 [Reference Shi, Boerio-Goates, Woodfield, Rytting, Pulsipher, Spencer, Ross, Navrotsky and Woodfield43]. The heat capacity of the chemisorbed water on cassiterite is closer to that of hexagonal ice than the chemisorbed water of both phases of titania, indicating less tightly-bound water. The heat capacity of the physisorbed water on SnO2 is similar to that of chemisorbed water at low temperatures and then rises sharply at around 175 K. This suggests that SnO2 does not bind water very tightly, so both chemisorbed water and physisorbed water behave like hexagonal ice at low temperatures and the physisorbed water “melts” at higher temperatures to behave more like liquid water. This behavior is similar to that of physisorbed water on titania, where “melting” may occur as early as 150 K (Fig. 5).
Molar heat capacity as a function of temperature as determined by low-temperature calorimetry for different layers of water on cassiterite nanoparticles. Data previously published in Shi et al. [Reference Shi, Boerio-Goates, Woodfield, Rytting, Pulsipher, Spencer, Ross, Navrotsky and Woodfield43].

While a simple chemisorbed–physisorbed water model for the heat capacity of water on the surfaces of TiO2 and SnO2 is useful for quantifying surface water interactions, it is difficult to generalize. For example, γ-Al2O3 nanoparticles not only adsorb water on the surface, but also incorporate water into their structures, as discussed below. As a result, calcining at higher temperatures has a large impact on porosity, generally causing a decrease in surface area, an increase in pore diameter, and a decrease in water incorporated into the structure [Reference Calvin, Asplund, Zhang, Huang and Woodfield11, Reference Asplund, Calvin, Zhang, Huang and Woodfield13]. This creates challenges in characterizing the surface water because each sample can be viewed as unique [Reference Calvin, Asplund, Zhang, Huang and Woodfield11, Reference Asplund, Calvin, Zhang, Huang and Woodfield13]. Furthermore, pair distribution function XRD studies that are currently underway have demonstrated that many of these aluminas are mixed phase rather than pure phase.
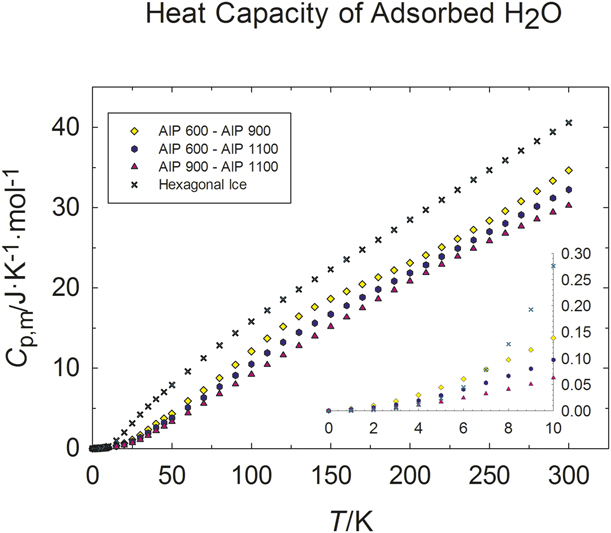
For heat capacity studies on γ-Al2O3 nanoparticles, physisorbed water was removed by heating the samples at 423 K for 24 h, and the nanoparticles were stored in a moisture-free glove box before loading in the calorimeter [Reference Calvin, Asplund, Zhang, Huang and Woodfield11, Reference Calvin, Asplund, Zhang, Huang and Woodfield12, Reference Asplund, Calvin, Zhang, Huang and Woodfield13]. Calculations of surface water heat capacity were performed as described above, and the data for the pure alumina samples are shown in Fig. 8. The calculated heat capacities for water are very different for different calcination temperatures, and no general trend can be established. This provides evidence that water not only adsorbs to the surface of the alumina (which would result in a pattern in surface water heat capacities) but also incorporates into the alumina structure, and its heat capacity is therefore far less predictable [Reference Asplund, Calvin, Zhang, Huang and Woodfield13]. However, the heat capacities of the adsorbed water are all less than that of hexagonal ice, demonstrating that chemisorbed water is tightly bound and stabilizes the structure of these materials to high temperatures.
Molar heat capacity for H2O adsorbed onto γ-Al2O3 samples synthesized from aluminum isopropoxide (AIP) alongside the molar heat capacity of hexagonal ice. The temperature in Celsius at which they were calcined is included in the legend. The inset shows the data at low temperatures (T < 10 K). Data previously published in Calvin et al. [Reference Calvin, Asplund, Zhang, Huang and Woodfield11].

Inelastic neutron scattering
INS is another technique to detect molecular vibrations as well as rotational and diffusive motions associated with hydrogen atoms because of the exceptionally large incoherent neutron scattering cross section of hydrogen compared with the nuclei of nearly all other atoms [Reference Sears44, Reference Ross, Spencer, Levchenko, Kolesnikov, Wesolowski, Cole, Mamontov and Vlcek45, Reference Spencer, Ross, Parker, Kolesnikov, Woodfield, Woodfield, Rytting, Boerio-Goates and Navrotksy46]. For nanoparticles of oxides such as titania, cassiterite, and alumina, the incoherent signal is therefore dominated by scattering from water and/or hydroxyl groups adsorbed on the surfaces. Thermal neutrons have energies comparable to vibrational excitations and can be inelastically scattered from the sample being studied, exchanging part of their energy and momentum with the vibrational excitations in the solid [Reference Ross, Spencer, Levchenko, Kolesnikov, Wesolowski, Cole, Mamontov, Vlcek, Liyuan, Rinaldi and Schober47]. Detailed analyses of the energy and momentum transfers involved in these processes provide valuable information about the vibrational properties of the solid [Reference Ross, Spencer, Levchenko, Kolesnikov, Wesolowski, Cole, Mamontov and Vlcek45, Reference Spencer, Ross, Parker, Kolesnikov, Woodfield, Woodfield, Rytting, Boerio-Goates and Navrotksy46, Reference Spencer, Levchenko, Ross, Kolesnikov, Boerio-Goates, Woodfield, Navrotsky and Li48]. INS experiments on polycrystalline samples provide information about the sample’s vibrational density of states (VDOS) [Reference Spencer, Levchenko, Ross, Kolesnikov, Boerio-Goates, Woodfield, Navrotsky and Li48], which can be used to calculate the thermodynamic properties of the sample. In the experiments described below, the VDOS of the surface water adsorbed on titania, cassiterite, and alumina was determined, and the isochoric heat capacity and entropy associated with the water layers were calculated [Reference Ross, Spencer, Levchenko, Kolesnikov, Wesolowski, Cole, Mamontov and Vlcek45]. Conventional heat capacities are measured at constant pressure, so a correction must be applied to accurately compare the results from both measurements [Reference Spencer, Levchenko, Ross, Kolesnikov, Boerio-Goates, Woodfield, Navrotsky and Li48]. INS has advantages over Raman and infrared (IR) spectroscopies because INS is not restricted by selection rules or restricted to zone center modes or hampered by optical opacity and sample absorption.
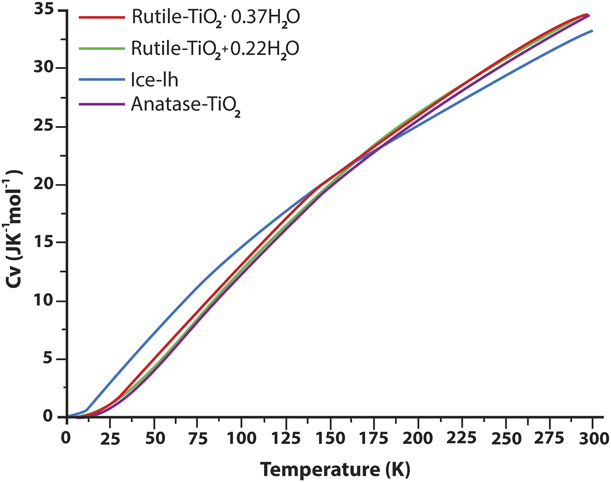
INS studies were used to study the surface water on both anatase and rutile phases of titania, and hexagonal ice was used as a model [Reference Levchenko, Kolesnikov, Ross, Boerio-Goates, Woodfield, Li and Navrotsky27, Reference Spencer, Levchenko, Ross, Kolesnikov, Boerio-Goates, Woodfield, Navrotsky and Li48]. INS measurements on the anatase phase of titania confirm that hydroxyl groups and molecular water appear on the surface of these nanoparticles, and the ratio of molecular water to hydroxyl groups is estimated to be approximately 3:1 [Reference Levchenko, Kolesnikov, Ross, Boerio-Goates, Woodfield, Li and Navrotsky27], consistent with measurements performed on single crystals [Reference Morterra49]. While no peak associated with the O–H stretch of a hydroxyl group is found in the spectra of rutile, it is suggested that this is due to higher levels of hydration in the rutile samples that were measured and not a lack of hydroxyl groups on the surface [Reference Spencer, Levchenko, Ross, Kolesnikov, Boerio-Goates, Woodfield, Navrotsky and Li48]. The INS spectra of both phases lack the 7-meV peak characteristic of hexagonal ice, indicating that water is strongly bonded to the surface of the nanoparticles [Reference Levchenko, Kolesnikov, Ross, Boerio-Goates, Woodfield, Li and Navrotsky27, Reference Spencer, Levchenko, Ross, Kolesnikov, Boerio-Goates, Woodfield, Navrotsky and Li48]. Both phases also show a softening of librational modes when compared to hexagonal ice, which may be due to distortion of the water tetrahedra [Reference Levchenko, Kolesnikov, Ross, Boerio-Goates, Woodfield, Li and Navrotsky27, Reference Spencer, Levchenko, Ross, Kolesnikov, Boerio-Goates, Woodfield, Navrotsky and Li48]. Additionally, the amount of water present does not seem to affect the heat capacity of the rutile titania particles [Reference Spencer, Levchenko, Ross, Kolesnikov, Boerio-Goates, Woodfield, Navrotsky and Li48]. Calculated heat capacities for both samples are similar, lower than that of hexagonal ice at low temperatures and crossing over between 160 and 180 K, suggesting that the crystal structure of the underlying titania phase does not have a large effect on the water adsorbed to the surface, as seen in Fig. 9 [Reference Levchenko, Kolesnikov, Ross, Boerio-Goates, Woodfield, Li and Navrotsky27, Reference Spencer, Levchenko, Ross, Kolesnikov, Boerio-Goates, Woodfield, Navrotsky and Li48].
C v data for ice-Ih and hydrated rutile nanoparticles as calculated from the INS VDOS data. Reprinted with permission from Spencer et al. [Reference Spencer, Levchenko, Ross, Kolesnikov, Boerio-Goates, Woodfield, Navrotsky and Li48]. Copyright 2009 American Chemical Society.

These studies show that water is tightly bound to the surface of the nanoparticles and confirms the presence of hydroxyl groups, an important observation given that previous heat capacity studies of both anatase and rutile phases showed Schottky anomalies that were attributed to the presence of hydroxyl groups at defect sites [Reference Boerio-Goates, Li, Li, Walker, Parry and Woodfield26]. This finding is also consistent with studies that have shown the presence of hydroxyl groups on single crystals of both rutile and anatase [Reference Bezrodna, Puchkovska, Shymanovska, Baran and Ratajczak50]. However, some of the conclusions reached in the INS studies seem to conflict with those drawn from heat capacity studies. First, it was asserted that the phase of the titania did not have a significant impact on the heat capacity of the adsorbed water. However, it is important to consider that VDOS does not distinguish between layers of adsorbed water, and therefore it is reasonable that anatase, which had chemisorbed water with lower heat capacity but physisorbed water with higher heat capacity, would give results similar to those of rutile (Fig. 5). Second, the calculated isochoric heat capacity is quite similar to that of hexagonal ice, which may lead one to believe that the adsorbed water behaves in much the same way. However, because the heat capacity calculated from VDOS is an average molar heat capacity, it can mask differences in behavior of water adsorbed to the nanoparticle surface. Note that one study suggests that the hypothesis of differences due to water coverage being present but undetected is flawed [Reference Spencer, Ross, Parker, Kolesnikov, Woodfield, Woodfield, Rytting, Boerio-Goates and Navrotksy46]; however, evidence from both water adsorption microcalorimetry studies and heat capacity studies, as noted above, confirms that the behavior of chemisorbed water is different from that of physisorbed water. It is also important to note that there is no contradiction in the calculated heat capacity failing to predict the “melting” observed at higher temperatures in the heat capacity data. INS measurements were performed at low temperatures, and any “melting” at higher temperatures would change the VDOS, making the low-temperature data less reliable for predicting higher temperature behavior.
INS measurements performed on cassiterite also show restricted translational motion of surface water, although the water was less tightly bound than the water in the titania samples [Reference Spencer, Ross, Parker, Kolesnikov, Woodfield, Woodfield, Rytting, Boerio-Goates and Navrotksy46]. INS spectra also indicate a softening of the hydrogen bond network when compared with hexagonal ice [Reference Spencer, Ross, Parker, Kolesnikov, Woodfield, Woodfield, Rytting, Boerio-Goates and Navrotksy46]. To understand what factors affect the thermodynamics of surface water on cassiterite, SnO2 nanoparticles with different water contents and particle sizes were measured. Calculations for these samples show that nanoparticles with higher hydration level and water coverage have higher vibrational entropy associated with the hydration layer [Reference Spencer, Ross, Parker, Kolesnikov, Woodfield, Woodfield, Rytting, Boerio-Goates and Navrotksy46]. Additionally, comparison of the calculated C v for water adsorbed to the different-sized particles shows that there is a critical size limit for cassiterite nanoparticles somewhere between 2 and 6 nm below which the size of the nanoparticle significantly influences the thermodynamics of the bound water and above which the size of the particle has no significant effect [Reference Spencer, Ross, Parker, Kolesnikov, Woodfield, Woodfield, Rytting, Boerio-Goates and Navrotksy46].
These conclusions agree well with those drawn from heat capacity studies, showing that the water is less tightly bound than the water adsorbed to titania surfaces. They also support the hypothesis that the difference between chemisorbed and physisorbed water has a significant impact on the thermodynamics of the surface water by showing that the water content does have a significant effect on the VDOS. While it is also highly significant that the size of the particles does matter below a certain limit, this finding, like some findings noted above, is difficult to generalize.
Like previous studies, INS experiments on γ-Al2O3 nanoparticles also demonstrate a softening of librational motion and therefore a disruption of the hydrogen bonding network when compared with hexagonal ice, as well as a restriction of translational motion, corresponding to strong surface–water interactions [Reference Spencer, Huang, Parker, Kolesnikov, Ross and Woodfield14]. Hydroxyl groups are also found to be present in these samples, and the ratio of water molecules to hydroxyl groups was estimated to be 1:2 [Reference Spencer, Huang, Parker, Kolesnikov, Ross and Woodfield14]. Analysis of calculated C v for different sizes of γ-Al2O3 nanoparticles shows that the thermodynamic behavior of the water adsorbed is not influenced by the size of the particles [Reference Spencer, Huang, Parker, Kolesnikov, Ross and Woodfield14].
The low ratio of water molecules to hydroxyl groups at the surface of alumina is particularly interesting because it suggests that the chemisorbed water on the γ-Al2O3 nanoparticles dissociates, and additional water molecules bind to that surface. This agrees well with bulk γ-Al2O3 studies which showed that water tends to dissociate on the (110D) surface [Reference Ionescu, Allouche, Aycard, Rajzmann and Hutschka51]. In addition, this justifies the difference in units (OH/nm2 versus H2O/nm2) noted in the discussion of water adsorption microcalorimetry. However, there were two main flaws with this study. First, the amount of water on these different aluminas covered only a small range (0.48–0.69 moles of water per mole of alumina). Second, the physisorbed water was not removed prior to measurement, which would have given a clearer understanding of how the chemisorbed water interacts with the surface. Despite these limitations, this study did help determine that the diameter of the nanoparticles did not influence the heat capacity of the water on the surfaces.
Other methods
While the above studies help to elucidate the enthalpy of adsorption and heat capacity of water on metal oxide nanoparticle surfaces, further insight into the behavior of water at these interfaces can be gained by comparison with other studies that have been performed on similar materials. Hence, this section provides a brief review of additional research performed with a variety of techniques. Because there is a wealth of literature relating to surface water interactions with metal oxides, this review will focus on studies which have involved nanoparticles in particular. Note that the following studies did not deal with the same suite of samples as the water adsorption microcalorimetry, heat capacity, and INS studies.
One of the most common theoretical methods employed to study surface water interactions on metal oxide nanoparticles is molecular dynamic simulation (MD), and it is often used in conjunction with other methods. These studies give insight into the behavior of water at a molecular level, and they allow for more detailed characterization of the theoretical structure of different water layers. For example, multiple MD studies suggest that the water on titania and cassiterite surfaces forms three layers (L1, L2, and L3, with L1 being closest to the surface) rather than the “inner” and “outer” layers referred to in heat capacity studies [Reference Wang, Wesolowski, Proffen, Vlcek, Wang, Allard, Kolesnikov, Feygenson, Anovitz and Paul20, Reference Mamontov, Vlcek, Wesolowski, Cummings, Wang, Anovitz, Rosenqvist, Brown and Garcia Sakai52, Reference Mamontov, Wesolowski, Vlcek, Cummings, Rosenqvist, Wang and Cole53, Reference Mamontov, Vlcek, Wesolowski, Cummings, Rosenqvist, Wang, Cole, Anovitz and Gasparovic54].
Of the metal oxide nanoparticles emphasized in this review, titania has been the most extensively studied. MD simulations show that higher water coverage for titania nanoparticles is associated with larger size and greater crystallinity [Reference Koparde and Cummings55]. Additionally, rutile is found to have greater water coverage than anatase [Reference Koparde and Cummings55]. As mentioned above, MD studies suggest that titania nanoparticles have three distinct water layers, and these different layers play important roles in the dynamics of water on titania surfaces; for example, interlayer exchange was not observed in quasielastic neutron scattering (QENS) experiments when the second layer of water on rutile nanoparticles (L2) had less than a monolayer [Reference Mamontov, Vlcek, Wesolowski, Cummings, Rosenqvist, Wang, Cole, Anovitz and Gasparovic54]. MD studies confirm that water primarily associates with titania through molecular adsorption [Reference Vlček and Cummings56], although molecular orbital theory and DFT calculations show that both molecular water and dissociated water adsorb to anatase titania surfaces, with dissociation more likely to happen at edge sites [Reference Redfern, Zapol, Curtiss, Rajh and Thurnauer57]. Atomic force microscope spectroscopy measurements combined with MD simulations were also used to investigate interparticle forces between titania nanoparticles, which are determined to be 2–3 times stronger than the forces that would be caused by a capillary neck of water between two particles; this difference is attributed to the structural arrangement of water molecules between the nanoparticles [Reference Salameh, Schneider, Laube, Alessandrini, Facci, Seo, Ciacchi and Mädler58]. Additional atomic force spectroscopy measurements coupled with MD simulations show that the structure of the water layers and roughness of nanoparticles have a significant impact on the humidity dependence of interparticle forces [Reference Laube, Salameh, Kappl, Mädler and Colombi Ciacchi59].
These studies are generally in good agreement with the conclusions drawn from enthalpy, heat capacity, and INS studies, with the notable exception of the suggested three water layers rather than two. However, it is relatively easy to resolve this contradiction, as chemisorbed water and physisorbed water of heat capacities are not in fact distinct physical layers, as noted previously.
Studies performed on cassiterite nanoparticles reinforce some of the above conclusions. MD studies confirmed that water adsorbs dissociatively to cassiterite surfaces [Reference Vlček and Cummings56], a property that bulk samples of cassiterite also exhibit [Reference Gercher and Cox60]. TGA, atomic pair distribution functions from neutron total scattering experiments, neutron prompt gamma data, and MD studies of cassiterite show that approximately 0.7 monolayer is required to prevent growth of cassiterite nanoparticles and suggest the presence of three layers of water, with L1 dissociating between 453 and 653 K [Reference Wang, Wesolowski, Proffen, Vlcek, Wang, Allard, Kolesnikov, Feygenson, Anovitz and Paul20]. Furthermore, it was determined that adsorbed water plays an important role in structural modification of the particles [Reference Wang, Wesolowski, Proffen, Vlcek, Wang, Allard, Kolesnikov, Feygenson, Anovitz and Paul20]. All these findings support and expand the above conclusions about cassiterite nanoparticles.
Studies that compared the properties of surface water on titania nanoparticles to the properties of surface water on cassiterite nanoparticles also provided important information. DFT-MD studies show that proton jumps associated with the dissociation of water happened much faster on cassiterite surfaces than on rutile titania surfaces [Reference Kumar, Kent, Bandura, Kubicki, Wesolowski, Cole and Sofo61]. In QENS studies, a fragile-to-strong transition was observed in the water layers of the rutile titania, but not in cassiterite, likely due to the tendency of water to dissociatively adsorb to the surface of cassiterite [Reference Mamontov, Vlcek, Wesolowski, Cummings, Wang, Anovitz, Rosenqvist, Brown and Garcia Sakai52]. Note, however, that heat capacity studies of cassiterite did show a glass-transition-like feature [Reference Shi, Boerio-Goates, Woodfield, Rytting, Pulsipher, Spencer, Ross, Navrotsky and Woodfield43]. Additional QENS experiments in conjunction with MD simulations demonstrate that the third layer of water on cassiterite is significantly smaller than that of rutile titania, which is attributed to the more complex L2 structure on cassiterite nanoparticles [Reference Mamontov, Wesolowski, Vlcek, Cummings, Rosenqvist, Wang and Cole53]. While these studies enhance understanding of the behavior of surface water and generally fit well into the framework of understanding provided by enthalpy, heat capacity, and INS measurements, TGA suggests that the removal of L1 from cassiterite nanoparticles requires higher temperatures than the removal of L1 from rutile titania nanoparticles, suggesting that the innermost layer of water binds more tightly to cassiterite than to rutile titania [Reference Mamontov, Vlcek, Wesolowski, Cummings, Wang, Anovitz, Rosenqvist, Brown and Garcia Sakai52]. This is in direct opposition to the water adsorption, heat capacity, and INS studies that suggested the chemisorbed water of cassiterite is more loosely bound than that of titania.
Although these studies appear to contradict each other, the chemisorbed water, as determined by heat capacity measurements, and L1, as defined by MD studies, are not identical because they are defined by fundamentally different methods. The heat capacity’s “inner layer” (or chemisorbed water) was determined by measuring samples with varying amounts of water and performing subtractions [Reference Shi, Boerio-Goates, Woodfield, Rytting, Pulsipher, Spencer, Ross, Navrotsky and Woodfield43], while L1 for MD studies was determined by simulations, which give a much clearer division between separate layers [Reference Mamontov, Vlcek, Wesolowski, Cummings, Wang, Anovitz, Rosenqvist, Brown and Garcia Sakai52]. It is likely that the chemisorbed layer in heat capacity measurements included L1 and some L2, which on average appeared to be less tightly bound to the nanoparticle surface. This explanation is particularly attractive because “inner layer” samples in the heat capacity study were dehydrated at 373 K and then placed under vacuum for 20 h [Reference Shi, Boerio-Goates, Woodfield, Rytting, Pulsipher, Spencer, Ross, Navrotsky and Woodfield43], while TGA was performed up to 1273 K, with significant mass loss reported above 373 K [Reference Mamontov, Vlcek, Wesolowski, Cummings, Wang, Anovitz, Rosenqvist, Brown and Garcia Sakai52].
While there are several studies that focus on surface water on titania and cassiterite nanoparticles, there are relatively few studies focused on the water that makes up part of the γ-alumina structure. However, DFT calculations have confirmed that water adsorbs on Al2O3 nanoparticles in both molecular and dissociative manners with dissociative adsorption happening on the surface first [Reference Arrouvel, Digne, Breysse, Toulhoat and Raybaud62, Reference Digne, Sautet, Raybaud, Euzen and Toulhoat63]. In addition, DFT calculations have been combined with IR measurements to provide more detailed information about the locations at which water adsorbs to alumina surfaces [Reference Arrouvel, Digne, Breysse, Toulhoat and Raybaud62, Reference Digne, Sautet, Raybaud, Euzen and Toulhoat63].
Conclusion
To understand the water surface interaction and surface thermodynamics of metal oxide nanoparticles, recent research progress on three representative groups of such materials (titania, cassiterite, and alumina) using water adsorption microcalorimetry, low-temperature heat capacity measurements, and INS, as well as other techniques such as MD and DFT calculation studies, is summarized in this review. Several valuable insights into the water behaviors on these nanoparticle surfaces were obtained:
(1) Water adsorption microcalorimetry and heat capacity measurements have shown that chemisorbed water and physisorbed water with distinctive thermodynamic properties form on the surface of metal oxides, and MD studies have suggested that three distinct layers form. INS and additional studies have shown that the innermost layer of water can adsorb to the metal oxide surface in both molecular and dissociative manners, with molecular adsorption being the preferred method for titania and dissociation being the preferred method for both cassiterite and γ-alumina.
(2) It has been suggested that although rutile titania has more high-energy binding sites and a higher overall surface energy, water binds to anatase particles more tightly at its high-energy sites. Water adsorption microcalorimetry, low-temperature heat capacity measurements, and INS studies all confirm that the chemisorbed water on cassiterite was less tightly bound than that of titania, and this is likely due to a fewer number of high-energy binding sites.
(3) Although the materials used for alumina measurements were not pure-phase materials, it appears that the conclusions of the studies are still valid. Aluminas calcined at different temperatures do bind water differently, and this can change the properties of the material. Additionally, due to their mixed-phase nature, these materials are far more complicated than previously understood, and current pair distribution function XRD studies are underway to understand their dynamics.
(4) Although some general energetic and structural trends on the chemisorbed and physisorbed water on metal oxide nanoparticles are observed, the detailed water behavior varies with composition and structure, and much more work is needed to understand surface water properties on this group of oxide nanomaterials. Water adsorption microcalorimetry, high-temperature oxide melt solution calorimetry, low-temperature heat capacity measurements, and INS studies have all proved to be valuable techniques, especially when used in combination on the same material, and will continue to provide direct insights into the properties of surface water on nanoparticle surfaces.
With such a wide array of experimental and theoretical tools available, further study of these metal oxides could take several directions. For example, understanding how contamination affects the water binding on the surface would be beneficial for practical applications. The particles studied herein are highly purified (>99.9% by ICP-OES) [Reference Calvin, Asplund, Zhang, Huang and Woodfield11, Reference Calvin, Asplund, Zhang, Huang and Woodfield12, Reference Levchenko, Li, Boerio-Goates, Woodfield and Navrotsky17, Reference Boerio-Goates, Li, Li, Walker, Parry and Woodfield26, Reference Schliesser, Smith, Li, Li, Walker, Parry, Boerio-Goates and Woodfield29, Reference Schliesser, Smith, Li, Li, Walker, Parry, Boerio-Goates and Woodfield30] with the only notable contaminations being carbon and chlorine at the parts per million level. Contaminations would likely be much higher for materials produced at the industrial scale, and employing these techniques to study contaminated particles could lead to new insights. In addition, the low-temperature heat capacities of γ-Al2O3 synthesized from different precursors—and having different pore geometries—are currently being investigated, and preliminary measurements indicate that the change in geometry affects the surface water interaction [Reference Asplund, Calvin, Zhang, Huang and Woodfield64]. These experiments could also benefit from this suite of experimental techniques, as water adsorption microcalorimetry would reveal whether the enthalpy of adsorption was changing between samples, the low-temperature heat capacity measurements could reveal the changes in entropy between samples, and INS measurements could probe the differences in vibrational behavior. MD simulations could also be used to predict whether there should be any changes based on pore geometry. These techniques together provide a multifaceted approach to understanding the thermodynamics of the interactions of surface water on metal oxide surfaces, and they can theoretically be applied to many other materials systems.
Acknowledgments
This work was supported by the U.S. Department of Energy, Office of Science, Basic Energy Sciences, under Grant Nos. DE-SC0016446, DE-FG03-01ER15237, and DE-FG02-05ER15666. We would also like to acknowledge Matthew S. Dickson for assistance in preparation of this manuscript.