1. Introduction
The study of turbulent heat or mass transport over rough walls is of special interest in engineering. For example rib turbulators are widely used in turbomachinery to enhance the heat transfer in the internal passages of turbine blades (Han, Dutta & Ekkad Reference Han, Dutta and Ekkad2000). Turbulent transport of heat, moisture, and pollutants in urban areas is also dominated by the morphology of the building blocks.
Kim & Moin (Reference Kim and Moin1989), Kasagi, Tomita & Kuroda (Reference Kasagi, Tomita and Kuroda1992), Kawamura, Abe & Matsuo (Reference Kawamura, Abe and Matsuo1999) and Abe, Antonia & Kawamura (Reference Abe, Antonia and Kawamura2009) studied the transport of a passive scalar in a turbulent channel flow with smooth walls. The thermal turbulence statistics and their associated budgets were shown to have a weak dependence on boundary conditions (isoflux or isothermal walls) and on Prandtl and Reynolds numbers. In particular, a close correlation was found between temperature and streamwise velocity fluctuations near the wall. Consistently, Perry & Hoffmann (Reference Perry and Hoffmann1976) found a remarkable similarity between wall-normal heat flux and the Reynolds shear stress. The similarity between thermal and velocity fields was further extended to the coherent structures. Iritani, Kasagi & Hirota (Reference Iritani, Kasagi, Hirota, Bradbury, Durst, Launder, Schmidt and Whitelaw1983) were first to establish the existence of the thermal streaky structures near the wall and their correspondence with velocity streaks.
Over the last decade, a number of studies have focused on the modification of coherent structures and on the secondary motion induced by regular (Leonardi et al. Reference Leonardi, Orlandi, Djenidi and Antonia2004; Krogstad et al. Reference Krogstad, Anderson, Bakken and Ashrafian2005), or irregular rough walls (Mejia-Alvarez & Christensen Reference Mejia-Alvarez and Christensen2010; Wu & Christensen Reference Wu and Christensen2010; Anderson et al. Reference Anderson, Barros, Christensen and Awasthi2015). Given the correlation between coherent structures, Reynolds stresses and turbulent heat fluxes observed on a smooth wall, the increased inclination of the coherent structures in a rough wall boundary layer should lead to a heat transfer augmentation. This is in fact observed in turbomachinery applications. Several studies have been performed where the angle of the turbulators with respect to the streamwise direction, as well as the shape of the turbulators, were varied (Ekkad, Huang & Han Reference Ekkad, Huang and Han1998; Tanda Reference Tanda2004; Won & Ligrani Reference Won and Ligrani2004; Tachie et al. Reference Tachie, Paul, Agelinchaa and Shah2009). These studies showed that angled ribs provide a better heat transfer performance than transverse ribs because of the secondary flow induced by the rib angle. The effect of large-scale secondary motion on heat transfer was also discussed by Miyake, Tsujimoto & Nakaji (Reference Miyake, Tsujimoto and Nakaji2001). They observed that a rough wall enhances turbulent mixing by inducing strong downwash. They also found that the streaks were wider in the spanwise direction compared to the smooth wall. This was consistent with the increased correlation of the velocity in the spanwise direction observed by Leonardi et al. (Reference Leonardi, Orlandi, Djenidi and Antonia2004) and with the visualizations of thermal streaks by Hetsroni et al. (Reference Hetsroni, Mosyak, Rozenblit and Yarin1999). The heat transfer augmentation is also accompanied by a drag increase. Promvonge & Thianpong (Reference Promvonge and Thianpong2008) measured heat transfer and friction loss in a channel with triangular, wedge and rectangular ribs. They observed a dependence of the heat transfer and friction loss on the shape of the roughness. The wedge ribs was the roughness geometry which maximized both heat flux and friction loss.
To understand further the mechanism underpinning the increase in heat transfer due to the roughness and how this is correlated to the drag we have performed direct numerical simulations (DNS) (described in § 2) of a turbulent channel flow with roughness on one wall. Two different roughness shapes have been considered, circular and square rods. In each case, the pitch to height ratio was varied over a significant range (
 $2<{\it\lambda}/k<15$
). The increase in heat flux and wall shear stress and their ratio is discussed in §§ 3 and 4. It is shown that circular rods are more effective in enhancing heat transfer since they have a smaller drag. The heat transfer increase has been correlated with the changes of the coherent structures induced by the roughness elements. This has been shown via time-averaged turbulent heat flux (§ 4), flow visualizations and two-point correlations (§ 5). The Reynolds analogy is discussed in § 6 via a quadrant analysis, two-point correlations and the turbulent Prandtl number. The effect of roughness on the temperature variance is shown in § 7. Conclusions are given in § 8.
2. Numerical procedure and geometrical configuration
The non-dimensional Navier–Stokes and continuity equations for an incompressible flow are
 $$\begin{eqnarray}\frac{\partial U_{i}}{\partial t}+\frac{\partial U_{i}U_{j}}{\partial x_{j}}=-\frac{\partial P}{\partial x_{i}}+\frac{1}{\mathit{Re}}\,\frac{\partial ^{2}U_{i}}{\partial x_{j}^{2}}+{\it\Pi}{\it\delta}_{i1},\quad \frac{\partial U_{i}}{x_{i}}=0.\end{eqnarray}$$
 ${\it\Pi}$
is the pressure gradient required to maintain a constant flow rate,
 ${\it\delta}_{ij}$
is the Kronecher delta,
 $U_{i}$
is the component of the velocity vector in the
 $i$
direction,
 $P$
is the pressure and
 $\mathit{Re}$
the Reynolds number, defined below.
The energy equation is
 $$\begin{eqnarray}\frac{\partial T}{\partial t}+\frac{\partial TU_{j}}{\partial x_{j}}=\frac{1}{\mathit{Re}\,\mathit{Pr}}\frac{\partial ^{2}T}{\partial x_{j}^{2}},\end{eqnarray}$$
where
 $T$
is the non-dimensional temperature, and
 $\mathit{Pr}={\it\nu}/{\it\alpha}$
is the Prandtl number with
 ${\it\alpha}$
the thermal diffusivity and
 ${\it\nu}$
the kinematic viscosity.
The Navier–Stokes and energy equations have been discretized in an orthogonal coordinate system using the staggered central second-order finite-difference approximation. Here, only the main features are described since details of the numerical method can be found in Orlandi (Reference Orlandi2000). The discretized system is advanced in time using a fractional-step method with viscous terms treated implicitly and convective terms explicitly. The large sparse matrix resulting from the implicit terms is inverted by an approximate factorization technique. At each time step, the momentum equations are advanced with the pressure at the previous step, yielding an intermediate non-solenoidal velocity field. A scalar quantity
 ${\it\Phi}$
projects the non-solenoidal field onto a solenoidal one. A hybrid low-storage third-order Runge–Kutta scheme is used to advance the equations in time. The roughness is treated by the efficient immersed-boundary technique described in detail by Orlandi & Leonardi (Reference Orlandi and Leonardi2006). This approach allows the solution of flows over complex geometries without the need of computationally intensive body-fitted grids. It consists of imposing
 $U_{i}=0$
on the points occupied by the body (in this case square bars and circular rods). At the first grid point outside the body, the second derivatives in the Navier–Stokes equations are discretized using the distance between the velocities and the boundary of the body rather than using the mesh size.
DNS have been performed for a fully developed turbulent channel flow with square bars and circular rods on the bottom wall (figure 1). Several values of the pitch (
 ${\it\lambda}$
) to height (
 $k$
) ratio have been considered (
 ${\it\lambda}/k=2,4,6,7.5,8.5,10,15$
), and
 $k/h=0.1$
where
 $h$
is the channel half-width. Two values of the Reynolds number
 $\mathit{Re}=U_{b}h/{\it\nu}$
have been considered, 7000 and 12 000 (
 $U_{b}$
is the bulk velocity and
 ${\it\nu}$
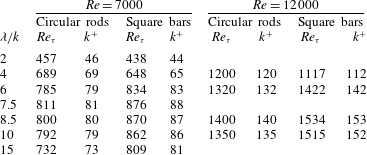
is the kinematic viscosity). The flow rate is maintained constant and it is the same for all the cases considered. The flow can be assumed to be ‘fully rough’ since roughness height
 $k^{+}$
ranges from about 40 for
 ${\it\lambda}/k=2$
to about 86 for
 ${\it\lambda}/k=7.5$
, and at higher
 $\mathit{Re}$
is above 100. The values of
 $\mathit{Re}_{{\it\tau}}$
and
 $k^{+}$
for each simulation are shown in table 1.
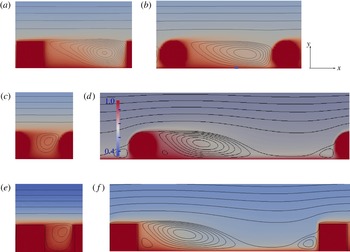
Colour contours of ensemble-averaged temperature
 $\langle T(x,y)\rangle$
and streamlines for
 ${\it\lambda}/k=4~(a,b)$
, 2 (c,e), 7.5 (d,f). The contour increment
 ${\rm\Delta}{\it\psi}$
is 0.0005 inside the cavity,
 ${\rm\Delta}{\it\psi}=0.01$
outside the cavity. Temperature colour scale is included in the circular rods plot for
 ${\it\lambda}/k=7.5$
and it is the same for all the plots. The size of the roughness element is
 $1/20$
of the total channel height.

Turbulent Reynolds number and roughness height normalised in wall units as function of
 ${\it\lambda}/k$
.

The molecular Prandtl number
 $\mathit{Pr}$
is set equal to 1. The computational box is
 $6h\times 2.1h\times {\rm\pi}h$
in the
 $x_{1}$
(streamwise),
 $x_{2}$
(wall-normal) and
 $x_{3}$
(spanwise direction) respectively (figure 1). The additional
 $0.1h$
increase in channel height corresponds to the cavity height where the square and circular roughness elements are placed. The plane of the crests is at
 $y/h=-1$
. Periodic boundary conditions apply in the streamwise and spanwise directions for the velocity, while the no-slip condition is imposed on both walls. The temperature is normalized by the difference between the temperature on the upper wall,
 $T_{U}^{\ast }$
, and that on the lower wall,
 $T_{L}^{\ast }$
, (where
 $\ast$
denotes dimensional quantities). The non-dimensional temperature is
 $T=1-2((T^{\ast }-T_{L}^{\ast })/(T_{U}^{\ast }-T_{L}^{\ast }))$
and it is equal to 1 on the surface of the rough wall and
 $-1$
on the upper smooth wall. The computational grid is
 $960\times 320\times 320$
in the streamwise, wall-normal and spanwise directions respectively. A non-uniform grid is used in the wall-normal direction with 40 points clustered within the roughness. Statistics are computed with about 300 velocity and temperature fields, 2 non-dimensional time units apart (time is normalized by
 $h/U_{b}$
). After the first 3000 non-dimensional time units, which were discarded when processing the data, convergence to a statistically steady state was achieved.
3. Mean velocity and temperature
Since the roughness on the wall is periodic in the streamwise direction
 $x$
, the physical quantities of the flow may reflect this periodicity. It is therefore useful to represent the variables as a superposition of three components (Hussain & Reynolds Reference Hussain and Reynolds1970): the instantaneous quantity, such as for example the temperature,
 $T(x,y,z,t)$
, can be decomposed as follows:
 $$\begin{eqnarray}T(x,y,z,t)=\overline{T}(y)+\tilde{T}(x,y)+T^{\prime }(x,y,z,t).\end{eqnarray}$$
An overbar indicates averaging with respect to time, spanwise and streamwise directions:
 $$\begin{eqnarray}\overline{T}(y)=\frac{1}{N_{x}N_{{\it\lambda}}N_{z}N_{t}}\mathop{\sum }_{x}^{N_{x}}\mathop{\sum }_{n}^{N_{{\it\lambda}}}\mathop{\sum }_{z}^{N_{z}}\mathop{\sum }_{t}^{N_{t}}T(x+n{\it\lambda},y,z,t)\end{eqnarray}$$
(
 $N_{t}$
is the number of fields saved in time,
 $N_{z}$
the points in the spanwise direction,
 $N_{{\it\lambda}}$
the number of roughness elements in the computational box and
 $N_{x}$
the points in the streamwise direction within one wavelength,
 ${\it\lambda}$
).
An ensemble average is defined as
 $$\begin{eqnarray}\langle T(x,y)\rangle =\overline{T}(y)+\tilde{T}(x,y)=\frac{1}{N_{{\it\lambda}}N_{z}N_{t}}\mathop{\sum }_{n}^{N_{{\it\lambda}}}\mathop{\sum }_{z}^{N_{z}}\mathop{\sum }_{t}^{N_{t}}T(x+n{\it\lambda},y,z,t)\end{eqnarray}$$
where angular brackets indicate averaging with respect to time and spanwise direction at spatial points which are at the same relative position to the roughness elements.
Streamlines superposed on colour contours of the ensemble-averaged temperature
 $\langle T(x,y)\rangle$
are shown in figure 1 for both circular rods and square bars. In each case, there is a flow separation on the crests of the elements and a recirculation zone within the cavity whose size and geometry depends on
 ${\it\lambda}/k$
. When the cavity is small (
 ${\it\lambda}/k=2$
), the flow skims over the roughness crest plane and the temperature is almost constant in the streamwise direction. The laser Doppler velocity data of Djenidi, Elavarasan & Antonia (Reference Djenidi, Elavarasan and Antonia1999) for square elements for
 ${\it\lambda}/k=2$
exhibit a similar behaviour. By increasing
 ${\it\lambda}/k$
, a larger waviness of the temperature contours can be observed. For
 ${\it\lambda}/k=7.5$
, reattachment occurs on the bottom wall. For this particular configuration for square bars, the roughness function is largest (Leonardi et al.
Reference Leonardi, Orlandi, Smalley, Djenidi and Antonia2003). The square bars have geometrical discontinuities which promote separation at the edges, while for the circular rods the separation points are determined by the loss of momentum due to viscosity. As a consequence, the temperature field over circular rods appears smoother than over square bars. Above the crest plane, a more pronounced waviness of mean streamlines and colour contours can be observed for the circular rods.
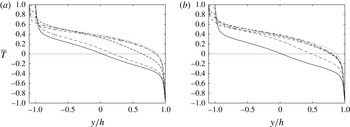
To assess the overall effect of the roughness on the overlying flow, the temperature is averaged in time as well as along streamwise and spanwise directions. Mean temperature profiles
 $\overline{T}(y)$
are shown in figure 2. On the rough wall (
 $-1.1<y/h<-1$
), the mean temperature is high and heat is convected toward the smooth wall where it is extracted. After a transient regime, the heat entering the lower rough wall is balanced by that exiting at the upper smooth wall. The temperature gradient on the crest plane (
 $y/h=-1$
) is smaller than that on the bottom of the cavity (
 $y/h=-1.1$
). This is because, at the crest plane, part of the heat is transported by the turbulent heat flux and the temperature gradient has to be smaller than that on the bottom wall. For square bars with
 ${\it\lambda}/k=2$
, the turbulent heat flux is very small and the temperature gradient at the crest plane is high. Compared to the smooth wall channel, the roughness shifts the zero crossing of the temperature profile to larger values of
 $y/h$
. In fact, the channel is not symmetric, having roughness on the bottom wall only (hot), the upper wall being smooth (cold). Through the ejections, the roughness induces increased mixing and heat flux. Since the heat flux on the rough wall increases, the temperature in the lower part of the channel also increases and the zero crossing for
 $\overline{T}$
is shifted to larger
 $y/h$
. On the upper smooth wall, the temperature gradient increases to balance the increased heat flux on the bottom wall. For
 $7.5<{\it\lambda}/k<15$
, for both square bars and circular rods the zero crossing is very close to the upper wall, and a thin thermal boundary layer can be observed on the upper wall.
Mean temperature distributions
 $\overline{T}(y)$
: ——, smooth channel; -- -- --,
 ${\it\lambda}/k=2$
; - - - -,
 ${\it\lambda}/k=4$
; — ⋅ ⋅ —,
 ${\it\lambda}/k=6$
;
 $\cdots \cdots$
,
 ${\it\lambda}/k=7.5$
; — ⋅ —,
 ${\it\lambda}/k=15$
. (a) Square bars, (b) circular rods.

As mixing and heat transfer are increased, so is the drag. For rough walls made of larger (
 $k/h=0.2$
) square bars, Leonardi et al. (Reference Leonardi, Orlandi, Smalley, Djenidi and Antonia2003) showed that most of the drag over a rough wall is due to the pressure drag and that the roughness function is maximum when the drag is maximum. Over a streamwise wavelength
 ${\it\lambda}$
, the relative contributions of the skin frictional drag
 $\overline{C_{f}}$
and form drag
 $\overline{P_{d}}$
to the wall shear stress
 ${\it\tau}$
are
 $\overline{C_{f}}={\it\lambda}^{-1}\int _{0}^{{\it\lambda}}\langle C_{f}\rangle \,\text{d}s$
and
 $\overline{P_{d}}={\it\lambda}^{-1}\int _{0}^{{\it\lambda}}\langle P\rangle \boldsymbol{n}\boldsymbol{\cdot }\boldsymbol{x}\,\text{d}s$
respectively, where
 $\overline{P_{d}}$
is obtained by projecting
 $\langle P\rangle$
onto the streamwise direction (
 $\boldsymbol{n}$
is the unit vector normal to the surface,
 $\overline{P_{d}}$
and
 $\overline{C_{f}}$
are normalized by
 ${\it\rho}U_{b}^{2}$
and
 $s$
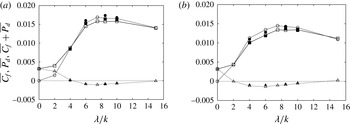
is a coordinate along the rough wall). The form drag and frictional drag over the square bars and circular rods as well as their sum are shown in figure 3. Leonardi et al. (Reference Leonardi, Orlandi, Smalley, Djenidi and Antonia2003) described the behaviour of the drag components for larger square bar elements. The trend is similar and is briefly recalled here. For square elements with
 ${\it\lambda}/k<6$
,
 $\overline{C_{f}}$
decreases as
 ${\it\lambda}/k$
increases. For
 $5<{\it\lambda}/k<10$
, the friction coefficient is negative due to the reverse flow in the cavities. This corresponds to a lengthening of the separated region adjacent to the cavity floor. Beyond
 ${\it\lambda}/k=7.5$
,
 $\overline{C_{f}}$
increases slowly as the reattached region increases.
Dependence of the skin frictional drag
 $\overline{C_{f}}$
, form drag
 $\overline{P_{d}}$
and their sum on
 ${\it\lambda}/k$
. Averaging is over one roughness wavelength on the lower wall. ▵,
 $\overline{C_{f}}$
; ○,
 $\overline{P_{d}}$
; ▫,
 $\overline{P_{d}}+\overline{C_{f}}$
: (a) square bars, (b) circular rods. Open symbols
 $\mathit{Re}=7000$
, solid symbols
 $\mathit{Re}=12\,000$
.

Similar to square bar roughness, for circular rods,
 $\overline{P_{d}}$
increases rapidly over the range
 $0<{\it\lambda}/k<6$
and has a maximum at
 ${\it\lambda}/k=7.5$
. For
 $6<{\it\lambda}/k<15$
, the dependence on
 ${\it\lambda}/k$
is weak. Over this range,
 $\overline{P_{d}}$
is smaller for the circular rods than the square bars. For smaller
 ${\it\lambda}/k$
, the form drag for circular cylinders is larger than that over square bars. This is because for square bars,
 ${\it\lambda}/k=1$
corresponds to a flat wall, while for circular rods it is a wavy wall along the periphery of the rods. A second set of simulations was performed at a higher Reynolds number
 $\mathit{Re}=12\,000$
. The distribution of
 $\overline{P_{d}}+\overline{C_{f}}$
(figure 3) does not change significantly because the form drag dominates the total drag and is weakly dependent on the Reynolds number.
4. Heat flux characteristics
After integration of the temperature equation (2.2) with respect to time, and streamwise and spanwise directions, we obtain
 $q=\overline{Tv}-(1/\mathit{Pr}\mathit{Re})(\partial \overline{T}/\partial y)=\text{const.}$
, where
 $q$
is the total heat flux,
 $V$
is the wall-normal velocity,
 $v(x,y,z,t)=V(x,y,z,t)-\overline{V}(y)$
(we recall that
 $\overline{V}(y)=0$
for continuity and due to the periodicity of the channel),
 $\overline{Tv}$
can be identified, because of the periodicity of the wall roughness, with the sum of the turbulent and dispersive heat flux, and
 $(1/\mathit{Pr}\mathit{Re})(\partial \overline{T}/\partial y)$
is the molecular conduction (the heat flux per unit area
 $q$
is normalized by
 ${\it\rho}C_{p}U_{b}T_{ref}$
). Since the walls are isothermal, the heat flux has to be constant within the channel, i.e. all the heat entering the channel from the hot wall has to exit from the upper wall. The mean temperature gradient is high at the crest plane and at the horizontal walls while in the centre of the channel it is much smaller than the turbulent heat flux. For
 ${\it\lambda}/k=4$
to 7.5, the heat transfer at the crest plane is almost entirely due to the wall-normal velocity fluctuations. The contribution from
 $\text{d}\overline{T}/\text{d}y$
decreases as
 ${\it\lambda}/k$
increases. The opposite occurs on the lower wall, where
 $v=0$
, so that the heat transfer is associated with the gradient of
 $\overline{T}$
. Consequently, on the bottom wall, for
 $4<{\it\lambda}/k<15$
,
 $\text{d}\overline{T}/\text{d}y$
is larger than over a smooth wall because the heat transfer is larger.
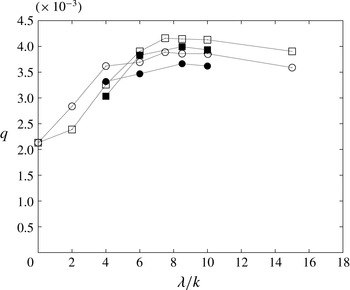
The heat flux per unit area is plotted in figure 4 as a function of the pitch to height ratio for both square and circular rods. The roughness causes an increase in heat transfer relative to the smooth wall (included as reference in the figure as
 ${\it\lambda}/k=0$
). For small values of
 ${\it\lambda}/k~(\simeq 2)$
, the heat flux is close to that of the smooth wall channel. For
 ${\it\lambda}/k\leqslant 4$
, circular rods are more effective in enhancing the heat transfer than square bars. As already mentioned in the context of drag, for small
 ${\it\lambda}/k$
, the flow almost skims over the square bars whereas the undulations over the circular rods enhance the mixing.
Dependence of the total heat flux on
 ${\it\lambda}/k$
: ○, circular rods; ▫, square bars; open symbols,
 $\mathit{Re}=7000$
; solid symbols,
 $\mathit{Re}=12\,000$
.

On increasing the separation between the roughness elements, the heat flux increases up to a maximum, which occurs at
 ${\it\lambda}/k=7.5$
for both square bars and circular rods (figure 4). For larger values of
 ${\it\lambda}/k$
, the heat transfer decreases. While for small
 ${\it\lambda}/k$
the heat transfer is larger for circular rods, for
 $6\leqslant {\it\lambda}/k\leqslant 15$
the square bars are more effective in enhancing the heat transfer. The stagnation pressure on the windward side of the square bar is larger than that over the circular rods. Consistently, the pressure gradient induced by the roughness is larger leading to stronger ejections which enhance the mixing and heat transfer. The values of
 $q$
at higher
 $\mathit{Re}$
exhibit a similar dependence on
 ${\it\lambda}/k$
to those at lower
 $\mathit{Re}$
.
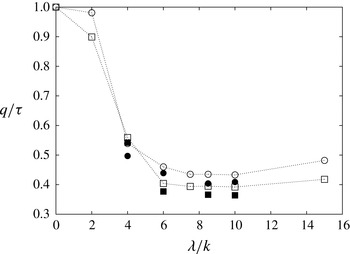
Figure 5 shows the ratio of the normalized heat flux and total wall shear stress (sum of frictional and form drag). For the smooth channel (indicated in the plot by
 ${\it\lambda}/k=0$
)
 $q/{\it\tau}=1$
as expected by the Reynolds similarity (i.e.
 $\mathit{St}/C_{f}/2=1$
where
 $\mathit{St}$
is the Stanton number). For
 ${\it\lambda}/k=2$
, where the pressure drag is small,
 $q/{\it\tau}$
remains close to 1 both for circular rods and square bars. From
 ${\it\lambda}/k=6$
to 15, with the form drag dominating over the frictional drag,
 $q/{\it\tau}$
reaches a plateau at
 $q/{\it\tau}\simeq 0.4$
. Results at
 $\mathit{Re}=12\,000$
present a similar trend to those at
 $\mathit{Re}=7000$
. Circular rods are more effective than square bars at enhancing heat transfer. Indeed,
 $q/{\it\tau}$
is higher for circular rods than for square bars almost independently of
 ${\it\lambda}/k$
.
Ratio of normalized heat flux and wall shear stress as a function of
 ${\it\lambda}/k$
: ○, circular rods; ▫, square bars; open symbols,
 $\mathit{Re}=7000$
; solid symbols,
 $\mathit{Re}=12\,000$
.

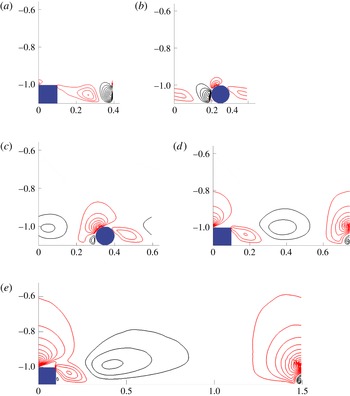
The heat transfer enhancement is due to an increase of the turbulent heat flux
 $\langle T^{\prime }v^{\prime }\rangle$
at the leading edge of the roughness elements. For
 ${\it\lambda}/k=2,4$
contours of
 $\langle T^{\prime }v^{\prime }\rangle$
do not extend significantly out of the cavity (figure 6). When the flow reattaches on the bottom wall, as for
 ${\it\lambda}/k=7.5$
, there is a stagnation point on the windward side of the roughness elements (for both square bars and circular rods). The pressure gradient induces strong ejections and a concomitant increase in the turbulent heat flux. This is the major contribution to the overall
 $\overline{Tv}$
and to the heat transfer enhancement (figure 6), while the turbulent heat flux in the cavity is quite small. Increasing
 ${\it\lambda}/k$
further affects only marginally the region around the roughness elements. The length of the cavity region is now larger but since it is ineffective in terms of heat transfer, the heat flux per wavelength decreases. In order to maximize the heat transfer, the roughness elements should be just sufficiently spaced to allow reattachment on the bottom wall and strong ejections near the roughness elements. For both square bars and circular rods this scenario corresponds approximately to
 ${\it\lambda}/k=7.5$
.
Iso-contours of turbulent heat flux
 $\langle T^{\prime }v^{\prime }\rangle$
(
 ${\it\lambda}/k=4$
(a,b), 6 (c), 7.5 (d), 15 (e)). Red positive, black negative. Increments of contour levels is 0.015.

Due to the variability of the ensemble-averaged flow within the cavity, and near the roughness crests, it can be shown that
 $\overline{Tv}(y)=Tv_{disp}+\overline{T^{\prime }v^{\prime }}$
where
 $$\begin{eqnarray}Tv_{disp}=\frac{1}{N_{x}}\mathop{\sum }_{x}^{N_{x}}\tilde{T}(x,y)\tilde{v}(x,y)\end{eqnarray}$$
is the dispersive component of the heat flux and
 $\tilde{T}=\langle T(x,y)\rangle -\overline{T}(y)$
(and
 $\tilde{v}=\langle v(x,y)\rangle -\overline{v}(y)$
) represents the local deviation of the time-averaged temperature (and velocity) from the temperature (and velocity) averaged both in time and streamwise direction. The dispersive heat flux results from the spatial inhomogeneities in the mean flow. The dispersive component of the heat flux is negligible for small pitch to height ratios (not shown here) and maximum for
 $5<{\it\lambda}/k<10$
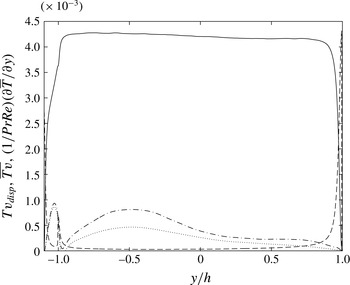
where the disturbance induced by the roughness is maximum (this is reflected in the waviness of the streamlines in figure 1). In figure 7 the dispersive component
 $Tv_{disp}$
is shown for
 ${\it\lambda}/k=7.5$
. The dispersive heat flux is maximum at the crests plane and within the cavity and, as expected, decreases with increasing distance from the wall with a peak at about five roughness heights above the crests plane (
 $y/h=-0.5$
).
Dispersive heat flux
 $\langle Tv_{disp}\rangle$
calculated with a time average over 600 non-dimensional time units (
 $\cdots \cdots$
) and over 100 non-dimensional time units (— ⋅ —),
 $\overline{Tv}$
(——), molecular conduction
 $(1/\mathit{Pr}\mathit{Re})\partial \overline{T}/\partial y$
(- - - -), for square bars with
 ${\it\lambda}/k=7.5$
.

While the dispersive component is much smaller than the turbulent heat flux (about 10 %), it is of the same magnitude order as that of the molecular conduction at the crests plane. The dispersive heat flux is much larger when averages are carried out over shorter time windows. For example in figure 7 the dispersive heat flux calculated over 100 non-dimensional time units is almost twice as much the dispersive heat flux calculated over 600 non-dimensional time units (a non-dimensional time unit being
 $h/U_{b}$
). This was already observed by Coceal et al. (Reference Coceal, Thomas, Castro and Belcher2006) and Leonardi & Castro (Reference Leonardi and Castro2010) for staggered cubes. Dispersive stresses are important on intermediate time scales, but when averages are performed over long time scales, they become very small. It can be speculated that roughness triggers a secondary motion which remains locked for relatively large time scales within the roughness canopy but, eventually, these large-scale structures meander and are transported away from the roughness canopy.
5. Thermal and velocity coherent structures
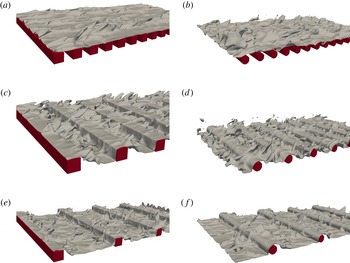
The increased heat transfer is associated with the increased mixing near the rough wall. Visualizations of instantaneous temperature can be observed in figure 8 where the iso-surface
 $T=0.8$
is shown. For square bars with
 ${\it\lambda}/k=2$
, ejections of hot fluid out of the cavities are aligned along the streamwise direction. Over circular rods at the same
 ${\it\lambda}/k$
, the streaky structures are disrupted and the iso-contours of temperature, compared to the smooth wall case, have a larger inclination and wider extent in the spanwise direction. As
 ${\it\lambda}/k$
increases, the inclination to the flow direction of high-temperature ejections also increases. This is consistent with figure 6 and the increased heat transfer observed in the range
 $6\leqslant {\it\lambda}/k\leqslant 10$
.
Iso-surface of instantaneous temperature
 $T=0.8$
:
 ${\it\lambda}/k=2$
(a,b); 4 (c,d); 7.5 (e,f).

Horizontal sections (
 $x,z$
) of the temperature fluctuations (
 ${\it\theta}(x,y,z,t)=T(x,y,z,t)-\overline{T}(y)$
) are shown in figure 9. For the square bars, temperature streaky structures can be observed. These elongated structures are similar to the thermal streaks observed by Hetsroni et al. (Reference Hetsroni, Mosyak, Rozenblit and Yarin1999) and to the velocity streaks. It was observed that for square bars with
 ${\it\lambda}/k=2$
, the velocity field is similar to that over a smooth wall (Leonardi et al.
Reference Leonardi, Orlandi, Djenidi and Antonia2004).
Colour contours of instantaneous temperature fluctuations (
 ${\it\theta}(x,y,z,t)$
): (a)
 ${\it\lambda}/k=2$
, (b)
 ${\it\lambda}/k=7.5$
at
 $y^{+}\simeq 12$
.

For
 ${\it\lambda}/k=7.5$
, iso-contours of temperature are less elongated and wider in the spanwise direction. A similar behaviour was found for the velocity field over square bars roughness at the same pitch to height ratio (Leonardi et al.
Reference Leonardi, Orlandi, Djenidi and Antonia2004). This is also consistent with the shape of the temperature coherent structures observed in a rough pipe where the roughness was made of lattices of spherical particles (Iritani, Kasagi and Hirota 1985).
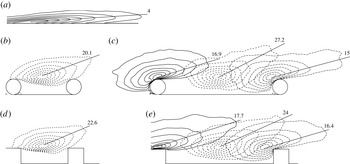
Two-point streamwise velocity correlations in the (
 $x,y$
)-plane
 $\langle {\it\rho}_{uu}(\boldsymbol{x}_{\mathbf{0}},\boldsymbol{x})\rangle$
,
 $y^{+}=10$
. Contours from 0.3 to 1 (increment is 0.1). (a) Upper (smooth) wall of the channel, (b,d)
 ${\it\lambda}/k=4$
, (c,e)
 ${\it\lambda}/k=8.5$
. The magnitude of the angle between the direction of maximum correlation and the horizontal direction is indicated.

The increased interaction between the wall and the outer region can be further corroborated via two-point correlation contours,
 $\langle {\it\rho}_{uu}(\boldsymbol{x}_{\mathbf{0}},\boldsymbol{x})\rangle =\langle u^{\prime }(\boldsymbol{x}_{\mathbf{0}})u^{\prime }(\boldsymbol{x})\rangle /$
(
 $u_{rms}(\boldsymbol{x}_{\mathbf{0}})$
 $u_{rms}(\boldsymbol{x})$
) (where
 $u_{rms}$
denotes a root-mean-square (r.m.s.) value),
 $\boldsymbol{x}_{\mathbf{0}}$
indicates the fixed point
 $(x_{0},y_{0})$
. Figure 10 shows
 $\langle {\it\rho}_{uu}(\boldsymbol{x}_{\mathbf{0}},\boldsymbol{x})\rangle$
for
 ${\it\lambda}/k=4$
and 8.5 in (
 $x,y$
) planes; for reference, the smooth wall contours are included at the top of the figure. The inclination of the contours is quantified by the angle between the horizontal direction and the segment
 $\boldsymbol{x}_{\mathbf{0}}\,\boldsymbol{x}_{\mathbf{1}}$
, the point
 $\boldsymbol{x}_{\mathbf{1}}$
being the furthest from
 $\boldsymbol{x}_{\mathbf{0}}$
on the contour
 ${\it\rho}_{uu}=0.3$
. Although there is some uncertainty in determining the inclination of the correlation contours, there is little doubt that the inclination of the contours over the rough wall is larger than over the smooth wall, emphasizing the increased communication between the cavities and the overlying flow. An increase in
 ${\it\lambda}/k$
is accompanied by an increase in the inclination. Within a roughness wavelength, the maximum slope occurs around the centre of the cavity. The increased inclination is also consistent with a reduced streamwise correlation over this surface (not shown here). This has already been observed both experimentally and numerically by Grass, Stuart & Mansour-Thehrani (Reference Grass, Stuart and Mansour-Thehrani1993), Krogstad & Antonia (Reference Krogstad and Antonia1994), Leonardi et al. (Reference Leonardi, Orlandi, Djenidi and Antonia2004), Coceal et al. (Reference Coceal, Thomas, Castro and Belcher2006), Wang, Salewski & Sundén (Reference Wang, Salewski and Sundén2010) and Hong, Katz & Schultz (Reference Hong, Katz and Schultz2011). The contours are more circular than for a smooth wall, thus indicating an increase in isotropy, which is consistent with the anisotropy invariant map of Smalley et al. (Reference Smalley, Leonardi, Antonia, Djenidi and Orlandi2002). The correlation contours are only weakly influenced by the shape of the surface. The effect of the roughness extends up to a maximum distance of
 $2.5k$
above the plane of the crests for both the circular rods and square bars. This confirms that, in order to enhance the mixing and heat transfer, it is more efficient to design a rough wall with circular rods since the associated drag is smaller. It is worthwhile to note that while the correlation contours extend only up to
 $2.5k$
above the crest plane, the effect of roughness is not confined to this thin layer. Instantaneous contours of wall-normal velocity fluctuations (not shown here) extend well beyond the centreline.
6. Comparison between velocity and thermal fields
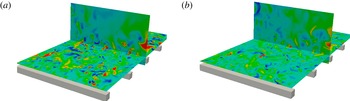
A similarity between the thermal and velocity fields has been observed over smooth walls. Kim & Moin (Reference Kim and Moin1987) and Kasagi et al. (Reference Kasagi, Tomita and Kuroda1992) showed a close correspondence between velocity fluctuations and passive scalar fluctuations near the wall. Figure 11 shows colour contours of instantaneous
 $u^{\prime }v^{\prime }$
and
 $T^{\prime }v^{\prime }$
in both (
 $x,z$
) and (
 $y,z$
) planes for the square bars with
 ${\it\lambda}/k=7.5$
. There is a close correlation between
 $u^{\prime }v^{\prime }$
and
 $T^{\prime }v^{\prime }$
, especially in the (
 $y,z$
) plane near the leading edge of the roughness elements.
Colour contours of instantaneous
 $u^{\prime }v^{\prime }$
(a) and
 $T^{\prime }v^{\prime }$
(b) in horizontal section and cross-section. The horizontal section is 20 wall units above the crests plane, the cross-section is at the leading edge of the roughness elements. Pitch to height ratio
 ${\it\lambda}/k=7.5$
.

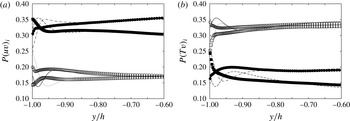
To further quantify the similarity between thermal and velocity fields, a quadrant analysis for
 $u^{\prime }v^{\prime }$
and
 $T^{\prime }v^{\prime }$
was performed (Lu & Willmarth Reference Lu and Willmarth1973). At each
 $y/h$
, events are separated in four quadrants for both
 $u^{\prime }v^{\prime }$
and
 $T^{\prime }v^{\prime }$
: quadrant 1, positive
 $u^{\prime }$
(or
 $T^{\prime }$
) and
 $v^{\prime }$
; quadrant 2, negative
 $u^{\prime }$
(or
 $T^{\prime }$
) and positive
 $v^{\prime }$
; quadrant 3, negative
 $u^{\prime }$
(or
 $T^{\prime }$
) and
 $v^{\prime }$
; and quadrant 4, positive
 $u^{\prime }$
(or
 $T^{\prime }$
) and negative
 $v^{\prime }$
. A positive heat flux, for the present boundary conditions (hot lower wall) corresponds to quadrants 1 (ejections of high-temperature fluid) and 3 (inrushes of low-temperature fluid). Since the temperature gradient is opposite to the velocity gradient, quadrants 1 and 3 of
 $T^{\prime }v^{\prime }$
correspond to quadrants 2 and 4 of
 $u^{\prime }v^{\prime }$
. The probability
 $P(uv)_{i}$
or
 $P(Tv)_{i}$
of an event being in the
 $i$
th quadrant is defined as the number of events in the
 $i$
th quadrant over the total number of events.
 $P(uv)_{i}$
and
 $P(Tv)_{i}$
for the smooth wall and the square bars rough wall (
 ${\it\lambda}/k=7.5$
) are shown in figure 12. Over a smooth wall boundary layer, Perry & Hoffmann (Reference Perry and Hoffmann1976) showed a correspondence in the quadrant analysis between the Reynolds stresses and the wall-normal heat flux. The present results over the smooth wall agree well with those of Perry & Hoffmann (Reference Perry and Hoffmann1976), showing a perfect overlap of
 $P(uv)_{i}$
and
 $P(Tv)_{i}$
near the smooth wall. For the rough wall, above
 $y/h=-0.8$
(two roughness heights above the crests plane), the probability distribution of events in each quadrant resembles closely that over a smooth wall, implying a strong correlation between the temperature and velocity fields also for rough walls about two roughness height above the crests plane. However, near the crests plane, differences between
 $P(uv)_{i}$
and
 $P(Tv)_{i}$
can be observed. While near the crests plane (
 $y/h=-1$
), the probability of ejections of low-momentum fluid (figure 12
a, Q2) is similar to that over a smooth wall, for the temperature field (figure 12
b, Q1),
 $P(Tv)_{1}$
is less than that over the smooth wall. On the other hand, with respect to the smooth wall, ejections of low-temperature fluid (figure 12
b, Q2) increase on the rough wall. Both the first and third quadrants of
 $Tv$
(
 $P(Tv)_{1}$
and
 $P(Tv)_{3}$
) contribute equally to the overall turbulent heat flux
 $\overline{T^{\prime }v^{\prime }}$
(not shown here). Therefore the roughness induces at the crests plane fewer but more intense events in the first quadrant as well as more events of lower intensity in the third quadrant. This is consistent with the turbulent heat flux iso-contours and temperature visualizations shown in figures 6 and 8 where intense ejections of hot fluid are confined to a small region near the roughness element. Conservation of mass implies that inrushes must occur elsewhere, and since they are spread over a larger area, their intensity is smaller. While there is a strong correlation between the temperature and the streamwise velocity at about
 $2k$
above the crests plane,
 $u$
and
 $T$
do not correlate well near the crests plane.
Probability of events in the
 $i$
th quadrant of the
 $u^{\prime }v^{\prime }$
(a) and
 $T^{\prime }v^{\prime }$
(b) planes for smooth channel (lines) and square bars with
 ${\it\lambda}/k=7.5$
(symbols): —— and ▫, Q1; - - - - and ▪, Q2;
 $\cdots \cdots$
and ○, Q3; — ⋅ — and ●, Q4.

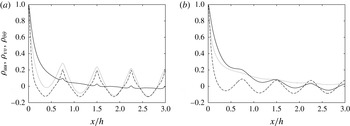
This is further supported by two-point correlations in the streamwise direction (figure 13)
 ${\it\rho}_{uu},{\it\rho}_{vv},{\it\rho}_{{\it\theta}{\it\theta}}$
, where
 $u(x,y,z,t)=U(x,y,z,t)-\overline{U}(y)$
, and
 ${\it\theta}(x,y,z,t)=T(x,y,z,t)-\overline{T}(y)$
. Temperature and wall-normal velocity correlations almost overlap near the crests plane. They both present a periodic behaviour with a period equal to the pitch to height ratio of the roughness. The streamwise velocity near the crests plane is less affected by the roughness geometry. At
 $y^{+}=55$
, an opposite trend is observed. The effect of
 ${\it\lambda}/k$
is still evident in the correlation of
 $v$
while it is very weak in the temperature and the streamwise velocity correlation profiles. The profiles of
 ${\it\rho}_{uu}$
and
 ${\it\rho}_{{\it\theta}{\it\theta}}$
are very similar.
Two-point correlation coefficients for the square bar roughness
 ${\it\lambda}/k=7.5$
:——,
 $u$
; - - - -,
 $v$
;
 $\cdots \cdots$
,
 $T$
: (a)
 $y^{+}=12$
, (b)
 $y^{+}=55$
.

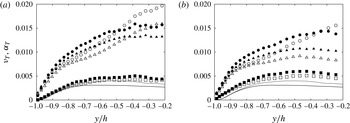
The turbulent viscosity hypothesis assumes a correlation between
 $\text{d}\overline{U}/\text{d}y$
and
 $\overline{u^{\prime }v^{\prime }}$
. The ratio
 ${\it\nu}_{T}=\overline{u^{\prime }v^{\prime }}/(\text{d}\overline{U}/\text{d}y)$
is the eddy diffusivity for momentum while
 ${\it\alpha}_{T}=\overline{T^{\prime }v^{\prime }}/(\text{d}\overline{T}/\text{d}y)$
is the eddy diffusivity for heat. The roughness increases both
 $\overline{u^{\prime }v^{\prime }}$
and
 $\overline{T^{\prime }v^{\prime }}$
, while the magnitudes of
 $\text{d}\overline{U}/\text{d}y$
and
 $\text{d}\overline{T}/\text{d}y$
decrease, especially near the cavities. Therefore, both
 ${\it\nu}_{T}$
and
 ${\it\alpha}_{T}$
vary with respect to the smooth wall channel (figure 14). Increasing
 ${\it\lambda}/k$
increases
 ${\it\nu}_{T}$
and
 ${\it\alpha}_{T}$
due to the increased intensity of the wall-normal velocity fluctuations. For both circular rods and square bars, the largest increase is observed for
 ${\it\lambda}/k=7.5$
which is the configuration corresponding to the maximum heat transfer. The effect of
 ${\it\lambda}/k$
on both
 ${\it\nu}_{T}$
and
 ${\it\alpha}_{T}$
extends to several roughness heights above the crest plane. Even at the centreline, the values of the turbulent viscosity and diffusivity are much larger than over a smooth wall.
Momentum eddy diffusivity (open symbols) and thermal eddy diffusivity (filled symbols) for (a) square bars and (b) circular rods: ▫,
 ${\it\lambda}/k=2$
; ○,
 ${\it\lambda}/k=7.5$
; ▵,
 ${\it\lambda}/k=15$
; ——, smooth channel
 ${\it\nu}_{T}$
; - - - -, smooth channel
 ${\it\alpha}_{T}$
. The value
 $y/h=-1$
corresponds to the crests plane.

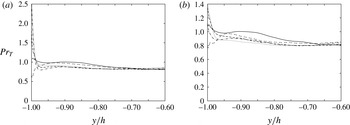
The ratio between the momentum and thermal eddy diffusivity is the Prandtl number. Published results for a smooth wall channel flow (e.g. Antonia & Kim Reference Antonia and Kim1991; Kawamura et al.
Reference Kawamura, Ohsaka, Abe and Yamamoto1998; Antonia, Abe & Kawamura Reference Antonia, Abe and Kawamura2009) have indicated that
 $\mathit{Pr}_{T}={\it\nu}_{T}/{\it\alpha}_{T}$
is about 1.1 near the smooth heated wall. For
 ${\it\lambda}/k=2$
a decrease of
 $\mathit{Pr}_{T}$
can be observed near the crest plane compared to the smooth wall, while for higher pitch to height ratio the turbulent Prandtl number increases near the crests plane and decreases elsewhere (figure 15). For the pitch to height ratio maximizing the heat transfer (7.5)
 $\mathit{Pr}_{T}\simeq 2.5$
for square bars and
 $\mathit{Pr}_{T}\simeq 1.4$
for the circular rods, reflecting the larger drag associated with the square bars. About three roughness heights above the crests plane, all the profiles collapse to a good approximation.
Turbulent Prandtl number for (a) square bars and (b) circular rods: -- -- --,
 ${\it\lambda}/k=2$
; - - - -,
 ${\it\lambda}/k=4$
;
 $\cdots \cdots$
,
 ${\it\lambda}/k=7.5$
; — ⋅ —,
 ${\it\lambda}/k=10$
; ——, smooth channel.

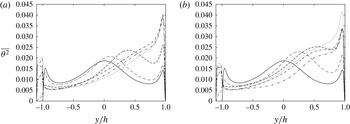
Temperature variance: ——, smooth channel; rough wall with: -- -- --,
 ${\it\lambda}/k=2$
; - - - -,
 ${\it\lambda}/k=4$
; — ⋅ ⋅ —,
 ${\it\lambda}/k=6$
;
 $\cdots \cdots$
,
 ${\it\lambda}/k=7.5$
; — ⋅ —,
 ${\it\lambda}/k=15$
. (a) Square bars, (b) circular rods.

7. Temperature variance
The changes in molecular conduction and turbulent heat flux induce a variation in the r.m.s. temperature distribution. The product
 $\overline{Tv}\partial \overline{T}/\partial y$
represents the production in the transport equation of the temperature variance. For
 ${\it\lambda}/k=2$
, the temperature variance has three peaks (figure 16), one on the centreline and the other two in the vicinity of the two walls, which is very similar to that found on a smooth wall (Johansson & Wikstrom Reference Johansson and Wikstrom1999). However, the peak at the centreline is slightly shifted towards the smooth wall. The increase in heat transfer on the lower wall shifts the zero crossing of the mean temperature upwards. For
 $6\leqslant {\it\lambda}/k\leqslant 10$
, the temperature gradient is very small in the lower half of the channel while it is high near the upper smooth wall. All the heat entering the lower wall must exit from the upper wall and associated with the increased heat transfer near the lower wall is an increased mean temperature gradient near the upper wall. Therefore, the production in the transport equation for the temperature variance is high near the upper wall (for an increase in
 $\text{d}\overline{T}/\text{d}y$
) and near the crests plane (for an increase in
 $\overline{Tv}$
), whereas it is very small in the centre of the channel. As a consequence, the peak in the centre of the channel almost disappears, the highest fluctuations of
 $T$
being observed near the upper smooth wall and at the crests plane. The circular rods exhibit a similar behaviour to the square bars. However, square bars have two discontinuous peaks of
 $\overline{T^{2}}$
in the roughness layer, one at the crests plane and one on the bottom wall. A smoother distribution can be observed for the circular rods, with the maximum located between the crests plane and the bottom wall.
8. Conclusions
DNS have been carried out in a channel flow with either square bars or circular rods on one wall. The results show that the roughness is effective in enhancing the turbulent (and total) heat transfer. For both square bars and circular rods, the heat flux is maximum at
 ${\it\lambda}/k=7.5$
and in correspondence the drag is also maximum. While the maximum heat transfer for circular rods and square bars differs only by about 5 %, the maximum total drag for the circular rods is about 12 % smaller than for the square bars. For the square bars, the pressure force is essentially aligned with the main flow direction. For the rods, the stagnation point lies on a curve and therefore the pressure force is inclined with respect to the streamwise direction, resulting in a smaller drag than over the square bars. Hence, circular rods are more effective than the square bars in terms of enhancing the heat transfer. This is quantified by the ratio
 $q/{\it\tau}$
(figure 5), which is larger for circular rods. While on a smooth wall
 $q/{\it\tau}=1$
, over square and circular rods with
 $5<{\it\lambda}/k<10$
,
 $q/{\it\tau}\simeq 0.4$
. This is due to the increase of
 ${\it\tau}$
due to the form drag. Iso-contours of
 $\langle T^{\prime }v^{\prime }\rangle$
and quadrant analysis indicate that the increase of turbulent heat flux is due to high-intensity ejections occurring near the leading edge of the roughness elements and less intense inrushes of cold fluid towards the wall. On a rough wall, the temperature gradient (
 $\text{d}\overline{T}/\text{d}y$
) is less important than over a smooth wall, the turbulent heat flux being the largest contributor to the total heat flux. The spacing between consecutive roughness elements which allows flow reattachment on the bottom wall immediately ahead of the downstream element corresponds to that which maximizes the heat transfer. In this case, a strong stagnation point occurs at the leading edge of each roughness element, which causes ejections, and hence an enhancement of both turbulent and total heat fluxes.
The increased interaction between the flow near the wall and that in the inner region of the channel has been further corroborated by two-point correlation contours. There is an increased inclination of the structures near the rough wall relative to the smooth wall. The correlation contours quantify the inference from visualizations, both of instantaneous temperature concentrations as shown in figure 8 and concentrations of
 ${\it\omega}_{y}$
, the vorticity in the
 $y$
direction (not shown here). These concentrations indicate disruption and strong deflection of vortical streaks around roughness elements, in agreement with earlier studies (Leonardi et al.
Reference Leonardi, Orlandi, Djenidi and Antonia2004; Nagano, Hattori & Houra Reference Nagano, Hattori and Houra2004; Ikeda & Durbin Reference Ikeda and Durbin2007).
At about two to three roughness heights above the crests plane, there is a good correlation between temperature and velocity fields. This has been quantified by a quadrant analysis and visualizations of
 $u^{\prime }v^{\prime }$
and
 $T^{\prime }v^{\prime }$
. Support of the breakdown of the Reynolds analogy in the vicinity of the roughness is provided by the ratio
 $q/{\it\tau}$
(figure 5) which shows that the maximum departure from 1 occurs at
 ${\it\lambda}/k\simeq 7.5$
, as well as the relatively significant departure from 1 of the turbulent Prandtl number, which is as large as 2.5 for square bars with
 ${\it\lambda}/k=7.5$
. The increase of the turbulent Prandtl number near the roughness elements, at least for
 ${\it\lambda}/k>2$
, is due to
 ${\it\alpha}_{T}$
being significantly reduced with respect to
 ${\it\nu}_{T}$
.
Acknowledgements
This research was supported in part by the National Science Foundation through TeraGrid resources provided by TACC. S.L. was supported by ONR MURI grants N00014-12-01-0875 and N00014-12-01-0962, R.A.A. and L.D. acknowledge financial support of the Australian Research Council.