1. INTRODUCTION
In recent years, stimulated Brillouin scattering (SBS) has received considerable attention because it has a broad range of applications (Kong et al., Reference Kong, Yoon, Beak, Shin, Lee and Lee2007, Reference Kong, Shin, Yoon and Beak2009; Ostermeyer et al., Reference Ostermeyer, Kong, Kovalev, Harrison, Fotiadi, Megret, Kalal, Slezak, Yoon, Shin, Beak, Lee, Lu, Wang, Lin, Knight, Kotova, Straber, Scheikhobeid, Riesbeck, Meister, Eichler, Wang, He, Yoshida, Fujita, Nakatsuka, Hatae, Park, Lim, Omatsu, Nawata, Shiba, Antipov, Kuznetsov and Zakharov2008; Shi et al., Reference Shi, Ouyang, Gong, Bai, Li and Liu2008; Wang et al., Reference Wang, Lu, Lin, Ding and Jiang2007; Hasi et al., Reference Hasi, Lu, Li and He2007, Reference Hasi, Gong, Lu, Lin, He and Fan2008; Meister et al., Reference Meister, Riesbeck and Eichler2007; Yoshida et al., Reference Yoshida, Fujita, Nakatsuka, Ueda and Fujinoki2007). Especially, the Brillouin amplifier can amplify a weak signal with high gain (Glick & Sternklar, Reference Glick and Sternklar1995; Bel'dyugin et al., Reference Bel'dyugin, Efimkov, Mikhailov and Zubarev2005). Therefore, it has potential applications in the lidar and optical communication system. To achieve high-gain amplification or enhance power load, Brillouin amplification in different media has been presented. Hasi et al. (Reference Hasi, Lu, Li and He2007) reported that the power load of the generator cell was enhanced by using the amplifier medium with small absorption rate, and the generator medium with high optical breakdown threshold. According to the characteristic that the Brillouin shift of CS2 is near to that of water, Gao et al. (Reference Gao, Lu, He, Zhu and Dong2008a) reported Brillouin amplification of weak Stokes signals from water, obtaining the signal gain of ~108 for the signal energy of 1pJ by using CS2 as the amplifier. Jones et al. (Reference Jones, Scott and Stewart1995) observed experimentally that the range of signal frequency detuning over which a Brillouin amplifier yields high gain was extended for a spectrally broadened signal. In the above researches, the frequency difference between the pump and the signal beams is not equal to the Brillouin shift of the amplifier, which can cause the input signal to be detuned in frequency away from the peak of the Brillouin resonance. In practical applications, if the amplifier medium is chosen, the signal may be detuned owing to the change of external environment such as the water temperature, moving objects, and so on. The characteristics of amplified spectrum of this detuned signal are of great importance for the detection and processing of the signal. However, few investigations on the correlation between spectral characteristics of the amplified signal and those of the input signal have been performed.
In this paper, we numerically study the response of the intensity and the spectral profile of the amplified signal to the frequency and linewidth of the input signal. The simulated results indicate that when the frequency of a weak input signal is shifted in the amplification bandwidth, for a narrow-linewidth signal (i.e., the signal linewidth is much narrower than the Brillouin linewidth of the amplifier), the frequency and linewidth of the amplified beam are the same as those of the input signal; whereas for a wide-linewidth signal (the signal linewidth is near or above the Brillouin linewidth), its amplified beam has a fixed central frequency, which is independent on the frequency of the input signal. We have performed experimental measurements which confirm some of our theoretical predictions.
2. THEORY
We assume the pump and the signal beams counter-propagating within the Brillouin amplifier. For a sufficiently weak signal, the transient SBS coupled wave equations in the undepleted pump regime are written as (Zhu & Gauthier, Reference Zhu and Gauthier2005)

and

where E P, E S, and ρ are the amplitudes of the pump, the signal, and the acoustic waves, respectively; n is the refractive index of the medium; g 1 and g 2 are the coupling coefficients; α is the absorption coefficient; Γ = 1/τ denotes the phonon decay rate, where τ is the phonon lifetime; Δω = ωB − ωsin is the frequency detuning of the signal wave from the SBS gain line-center; ωB is the Brillouin shift of the medium; ωSin = ωP0 − ωS0 is the frequency shift of the input signal, where ωP0 and ωS0 are the center angular frequencies of the pump and the signal waves.
Assuming that the pump wave is a monochromatic beam and transforming Eq. (1) into the frequency domain, we obtain

and

where  and
 are the Fourier transformations of E S and ρ. Substituting ρ from Eq. (2b) to Eq. (2a) yields

Solving (3) gives the amplified signal spectrum:
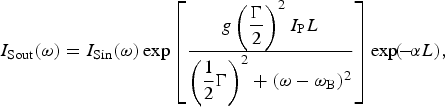
where L is the interaction length, I P = (nc/8π)|E p|2 is the pump intensity, g = 32πg 1g 2/ncΓ is the Brillouin gain coefficient. The input signal beam with a Gaussian frequency spectrum, I Sin(ω), is given by

where ΔωSin is the linewidth of the signal beam. The total amplified signal intensity integrated over its spectrum, I Sout, is then given by

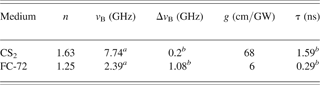
In the following numerical analysis, the simulation parameters are the pump intensity I P of 15 MW/cm2, the total intensity I Sin of the input signal of 10−9 MW/cm2, the laser wavelength of 532 nm, and the interaction length of 20 cm. The main medium parameters are listed in Table 1, where v B (=ωB/2π) and Δv B denote the Brillouin shift and Brillouin linewidth, respectively. Figure 1 shows the total amplified signal intensity, I Sout, and the signal gain versus the frequency detuning Δv(=Δω/2π) for various linewidths of the input signals (using CS2 as the amplifier medium). The signal gain is taken to be the ratio of I Sout to I Sin. We see that a detuned signal can still be efficiently amplified if the frequency detuning Δv is controlled in certain range. The narrow-linewidth signal has the higher amplification than the wide-linewidth one near the frequency matching, since its different spectral components can be amplified with approximately maximum gain. However, the output of the wide-linewidth signal will be stronger than that of the narrow linewidth if the detuning exceeds a certain value in the amplification bandwidth. This is due to the higher intensity in the wings of the wide-linewidth signal spectrum. Therefore, the detuning range over which yields high amplification increases as the signal linewidth Δv Sin is increased. This result is consistent with the experimental results reported (Jones et al., Reference Jones, Scott and Stewart1995).
Amplified signal intensity I Sout and signal gain versus the frequency detuning Δv for the linewidths of the input signals ΔνSin = 0.25 GHz, 0.15 GHz, 0.01 GHz.

The parameters of some SBS media at 532 nm
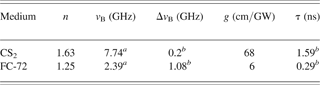
a The parameters of the media are measured in the experiment; b The parameters are calculated according to the equation given by Erokhin et al. (Reference Erokhin, Kovalev and Faizullov1986) and the results at 1064 nm (Erokhin et al., Reference Erokhin, Kovalev and Faizullov1986; Yoshida et al., Reference Yoshida, Kmetik, Fujita, Nakatsuka, Yamanaka and Yoshida1997); Others are quoted from Erokhin et al. (Reference Erokhin, Kovalev and Faizullov1986) and Yoshida et al. (Reference Yoshida, Kmetik, Fujita, Nakatsuka, Yamanaka and Yoshida1997).
The signal linewidth has the effect not only on the amplified signal intensity but also on its frequency shift and linewidth. Figure 2 shows the amplified signal spectra (ASS) for different signal linewidths, taking CS2 for example. The frequency shift of the signal beam, v Sin(=ωSin/2π), is 7.60 GHz. The detuning Δv is 0.14 GHz. It can be seen that the frequency shift v Sout of the ASS changes from v Sin to the Brillouin shift v B with increasing signal linewidth Δv Sin. For the case of Δv Sin/Δv B = 0.05, the ASS has the same frequency shift and linewidth as the input signal, since every spectral component of the signal beam experiences an approximately uniform gain due to the very narrow linewidth. At Δv Sin/Δv B = 0.3, the ASS has a distorted spectral line-shape. As the signal linewidth is increased, its spectral components will be non-uniformly amplified. The components near the resonant region have higher gain; therefore, the ASS peak is pulled toward v B. When Δv Sin/Δv B = 1, compared with Δv Sin, the ASS linewidth Δv Sout obviously narrows. The component that is resonant with the Brillouin interaction dominates over other components owing to the maximum gain.
(Color online) Amplified signal spectrum ASS for Δv Sin/Δv B = 0.05, 0.3, 1.

We also calculate v Sout as a function of Δv Sin/Δv B for different signal frequency shifts using available common SBS media as the amplifiers. Figure 3 only gives the results of two typical media of FC-72 and CS2. By analyzing the calculated data, we find that when Δv Sin/Δv B ~ 0.1, (v Sout − v Sin)/v Sin is usually less than or near 5%, and at this time v Sout can be considered to be near v Sin. Therefore, for the case of Δv Sin ≪ Δv B, amplified beams essentially retain their original spectrum parameters. If Δv Sin/Δv B ~ 1, v Sout will be close to v B and will be independent of v Sin. For the case of Δv Sin/Δv B between 0.1 and 1, v Sout depends on v Sin and is between v Sin and v B. The same conclusions can be obtained for other nonlinear media as well.
(Color online) Frequency shifts v Sout of amplified signals versus Δv Sin/Δv B for different input signal shifts v Sin.

3. EXPERIMENT
The experimental setup is shown in Figure 4. The laser used is an injection-seeded, Q-switched, and pulsed Nd:YAG laser (Continuum Powerlite Precision II 9010) with a linewidth of 90 MHz and repetition rate of 10 Hz. After frequency doubling, the output wavelength is 532 nm, and the pulse width is 7–8 ns. The beam from the laser initially has s-polarization. It passes through a half-wave plate, and is split into two beams by polarizer P1. The reflected beam is focused into the generator cell (BG). The retuning SBS beam is used as a signal beam. The transmitted beam from polarizer P1 is used to form a pump beam. These two beams collinearly interact in the 20 cm-long Brillouin amplifier (BA). The diameter of the pump is 8 mm at the entrance of the cell, while the signal beam has the diameter of 6 mm. The amplified signal beam reflected by polarizer P3 is overlapped with a portion of the pump beam reflected by 4% beam splitter (BS1), and is directed toward the confocal scanning Fabry-Perot interferometer (F-P, Burleigh SAPLUS) with a free spectral range (FSR) of 2 GHz (the maximum resolution is 6.7 MHz). For measuring the frequency shift of the signal, we insert a baffle between BS1 and P3, and hence the signal and pump beams are directed into the F-P. The interferometer is driven by the device (Burleigh RG-93) controlled by self-made ramp generator with a 500-s scanning period (Gao et al., Reference Gao, Lu, He, Hasi and Zhang2008b). The signal detected by a CR115 photomultiplier tube (PMT) is integrated and averaged over 10 laser shots by a gated integrator and Boxcar averager (Stanford Research System SR-250). Before experiments, we blocked a signal beam and only directed a pump beam into the amplifier cell, and did not find self-SBS spectrum of the medium.
Experimental setup: BG, Brillouin generator; BA, Brillouin amplifier; P's, polarizers; ND, neutral-density filer; M's, mirrors; L, lens; BS's, beam splitter; F–P, scanning Fabry–Perot interferometer; PMT, photomultiplier tube.

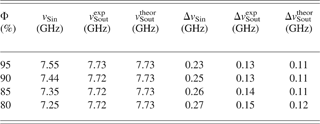
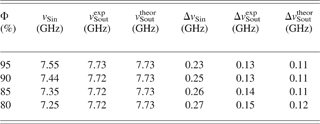
Theoretical predictions of the amplified spectrum for a narrow-linewidth signal have been validated by comparing them with the experimentally measured Brillouin gain spectrum based on pump-probe technique in the optical fiber (Nikles et al., Reference Nikles, Thevenaz and Robert1997). Therefore, we focus on the case of a wide-linewidth signal and study the dependence of the amplified spectrum on the input signal frequency. CS2/CCl4 mixture is chosen as the generator medium. By varying the fraction of CS2 in CCl4, the input signal frequency is changed. CS2 is used as the amplifier medium. The volume fractions Φ of CS2 are 95%, 90%, 85%, and 80%, respectively. The signal energy is attenuated to 1 nJ by the neutral density filters (ND). The pump energy is 55 mJ. In order to accurately measure the spectral change, we first measured the input and the output signal spectra by using the interferometer with 8 GH FSR and determined their frequency shift range from 7 GHz to 8 GHz. We then replaced the 8 GHz FSR mirror set with the 2 GHz FSR one. Because of the low FSR, the frequency shift of the input and amplified signal can be determined by subtracting the measured shift from 8 GHz. Figure 5 shows the input signal (a) and its amplified spectrum (b) at Φ = 90%. The aim to introduce the pump beam is to compare the frequency shift before amplification with that after amplification. The solid lines are the fitted curves by Gaussian functions. We see that the frequency shift of the amplified beam is closed to the Brillouin shift of the amplifier, and the linewidth becomes narrow with respect to the input signal. The signal spectra generated by mixture media with other volume fraction and corresponding amplified spectra are similar to those shown in Figure 5. Their frequency shifts and linewidths are listed in Table 2. According to the experimental conditions and taking into account the convolution correction of the pump bandwidth (Herráez et al., Reference Herráez, Song and Thévenaz2006); we obtain the theoretically predicted values of the frequency shifts and linewidths of amplified beams, as shown in Table 2. As seen the frequency shifts of amplified beams are independent of those of input signals. Experimental results agree with the theoretical predictions.
(Color online) Spectra of the input signal (a) produced by 90%CS2 and 10%CCl4 and its amplified signal (b) as well as the pump beam. Because of the low FSR the frequency shift of the input and amplified signal can be determined by subtracting the measured shift from 8 GHz.

Comparison of measured and calculated frequency shifts v Sout and linewidths Δv Sout of amplified beams for different signal frequency shifts
4. CONCLUSION
We have shown that the intensity and spectral profile of the amplified signal depend on the frequency and linewidth of the input signal. First, for the case in which the signal linewidth is much less than the Brillouin linewidth of the amplifier, the linewidth and the frequency of the input signal are essentially preserved. Hence, this case is suitable for beam amplification applications to measure the change of the frequency or linewidth of the weak signal. Second, if the signal linewidth is near or above the Brillouin linewidth, the amplified spectrum will narrow, and its frequency shift will close to the Brillouin shift of the amplifier. Moreover, the amplification bandwidth will be increased. This result has implications in the detection of moving objects. Finally, when the signal linewidth is between the two cases mentioned above, the amplified spectrum presents the aberration such as the asymmetric profile. The simulated results have been validated experimentally for the cases of the narrow- and wide-linewidth signals.
ACKNOWLEDGMENTS
This work is supported by the National Natural Science Foundation of China (Grant No. 60878005, 60778019), the Program of Science and Technology of Education the Bureau of Heilongjiang Province, China (Grant No. 11521048), and the Program of Excellent Team in Harbin Institute of Technology.